
Let’s take a look at what Arctic sea ice extent has been up to over the years. We’ll use the satellite data which extend back to late 1978, rather than the MASIE data which don’t start until 2006 (especially since those who publish it recommend using the satellite data anyway).
We’ll start with annual average sea ice extent. Not all years are covered completely, especially this year because it isn’t over yet. So we’ll do two things to improve the situation. First, we’ll transform extent to extent anomaly to remove the average annual cycle. Second, rather than have the final data point (for 2015) be less precise simply because it has less data, we’ll average over years from October through the following September. We’re still computing one-year averages, and the sea ice doesn’t really care when we choose to start our calendar.
And here they are:

The downward trend is quite clear. And yes, it can (easily) be confirmed statistically — it’s not just a visual impression.
But there’s also a visual impression of more than just a linear decline. This can be confirmed in multiple ways, including changepoint analysis, which finds not one but two changes in the trend rate. Let’s plot a smooth curve fit to the data in red, and a piecewise-linear fit estimated by changepoint analysis in blue:

The difference between the most recent trend rate and zero isn’t statistically significant. But then, neither is the difference between the most recent trend rate and the original trend rate (in the early part of the data). If you want a graphical representation, look here. It underscores how uncertain the most recent trend is, due to the brevity of the time span. We can be confident that it’s not declining as fast as it was during the 2003-2007 time span, when it really took a nosedive.
One thing is for certain: there’s no validity to any claim of “recovery.” For one thing, evidence that the current trend is upward (rather a necessity for “recovery”) just isn’t there. For another thing, annual average sea ice extent is not only still well below what it was 30 years ago, it’s well below what it would have been had the downard trend at that time continued unabated:

Seriously. Talk of “recovery” is downright foolish.
Many people focus on the annual minimum of sea ice extent. Here’s that data:

Again an overall downtrend is clear (and again, easily confirmed statistically). This time, changepoint analysis can only confirm one rate change, but a smooth suggests more might be going on:

Statistically, the issue can’t be decided using just this data. Part of the reason is that the annual minima have a higher noise level than annual averages. This is well indicated by the standard deviation of the residuals from smooth fits and piecewise-linear models; for annual averages it’s only about 0.13 million square kilometers, but for annual minima it’s about 0.45, more than three times as large.
We shouldn’t give short shrift to the annual maxima. Here they are:

One more time, clear downtrend easily confirmed statistically. But this time, a smooth fit doesn’t suggest any trend change and changepoint analysis doesn’t find one:

All we can say for sure is that it was trending downward, and all the evidence points to the fact that it still is. By the way, the noise level for the annual maxima is about 0.26 million km^2, more than for annual averages but less than for annual minima.
Probably one of the reasons for the differing behavior between annual minima and maxima is latitude dependence. There’s probably more to the story as well, but I’m not qualified to opine on that.
Perhaps we’ll have a comment about this from Ron Clutz. I’m interested in knowing whether or not he really meant it when he titled his blog “Science Matters.”


The vertical axes for your graphs of the annual minimums and maximums is labelled “Extent Anomaly”, but they aren’t anomalies. Just thought I should point out the minor error; we wouldn’t want anybody getting confused
Worse yet, we wouldn’t want anyone trying to misuse your work by saying something idiotic like “look how high the anomaly is! That means there must be SO much more ice than there used to be.” I wouldn’t put that past some members of the denial community.
hmmmm…But the Prophet James Hansen, whom you all follow like fervent disciples, stated the Arctic would be ice-free by now.
[edit]
[Response: No. He didn’t. I don’t know whether you heard it from some liar or made it up yourself, but it’s a lie.]
However I do remember Anthony Watts repeatedly saying that arctic sea ice levels would have recovered by now. I do hope you are visiting his site as well and pointing out his error to him, Michael. I am sure your input on this would be very welcome.
tamino…
His use of “prophet” and “ice gone by now” probably trace back to a Goddard-touted newspaper link http://usatoday30.usatoday.com/tech/science/2008-06-23-1642922053_x.htm which states the same (last 3 paragraphs). I certainly know of no other source, nor particularly do I know of any such assertion directly from Hansen himself.
Possibly he mentioned Waslowski’s rather ahead of the consensus prediction in his testimony as a worst case. A denier would run a long, lying way with that sort of thing as we all know.
Uh, duckster, that was one “Kevin King”, not Michael.
Have you ever noticed that the scientific illiterates at WTF always go right to religion. It is as if they cannot conceive of scientific prediction based on reliable data and conservative analysis. No wonder they’re idiots.
Your comments about the difference (if any) between the pre-2003 and post-2007 trends reminds me of Gelman & Stern’s 2006 paper, entitled “The Difference Between “Significant” and “Not Significant” is not Itself Statistically Significant”, doi: 10.1198/000313006X152649
Thanks for this, Tamino. I’ll link to it on the Arctic Sea Ice blog.
There have been many temporary and partial recoveries in the sea ice. It has never fully recovered, and there is no prospect of it doing so. You obviously don’t like the term, but I can’t think of a better one.
Greg, I think the word “rebound” is perfectly adequate. It certainly is much better and,frankly,more more honest than “recovery”. I believe it was either Tamino or maybe Phil Neven on his EXCELLENT blog whom I saw use it for the first time a few weeks ago. But it immediately fit what I was looking for to describe not just what is actually happening up there,but also highlights really starkly the propaganda ploys the Denier Machine employs in its never ending attempts to muddy the discourse on this.
I believe “Dead cat bounce” is the more accurate term :-)
https://en.wikipedia.org/wiki/Dead_cat_bounce
Yes, “Dead Cat Bounce” is fitting. As I was reading this, I thought that calling it a recovery is similar to claiming that the body bouncing as it hit the ground was starting to fly. You know the guy: he’s the one that falls off the 30-storey building and says as he falls past the 10th floor “so far, so good”. For him, the dead cat bounce would be a recovery.
Most of the “temporary recoveries” they’ve been heralding are better known as “winters”. For the remainder, I agree with Greg Wellman’s suggestion of “dead cat bounce.”
You could consider “natural variation” or just “noise” as correct terms. There is precisely no Earthly scientific reason why each year should produce successively lower extents at each season. To characterize noise as “temporary and partial recoveries” is simply wrong.
Typo alert: For extent minimum and maximum you did not use anomaly, but extent (the title of y axis is wrong).
Perhaps it is worthy of a mention here as the post begins by dismissing from the analysis MASIE (which measures ice edge for ships and not primarily ice areas). Although there is only 9 full years of MASIE data, there is one statistically-significant trend that can be found from it. For the present available data, the annual figure (that’s full calendar years) for the quantity MASIE – NSIDC(SIE), it has a trend of +60km^2/y ±20km^2(2sd). I haven’t carried out any seasonal analysis of this trend.
How would you use Chao tests to find a change point? Look for the highest significance?
Another graph would be very interesting: Yearly average arctic ocean albedo.
My last commen stupid if taken literally. Albedo time insolation I wanted.
Our host did this for us in 2012. See https://tamino.wordpress.com/2012/10/01/sea-ice-insolation/ and especially the image at https://tamino.files.wordpress.com/2012/10/iceinsol.jpg.
Sometimes deniers claim (falsely) that 1979 was a high period for sea ice. This graph http://arctic.atmos.uiuc.edu/cryosphere/IMAGES/seasonal.extent.1900-2010.png (from Cryosphere Today) shows sea ice extent back to 1900. Obviously not from space observations, but a lot of people live in the Arctic and have observations.
I’d overlooked that interesting chart. They should update it.
Ron Clutz said on his blog yesterday I think it was, that he would respond to Tamino more, on Tamino’s blog.
I wouldn’t hold your breath waiting for him. Right-wingers are ethically challenged, and their word isn’t worth much.
“I wouldn’t hold your breath waiting for him”.
Yeah why such a delay in responding?
He never directly addressed a single criticism in the post. I pointed out several and asked him to do so but he never did. He discussed some points the commenters made but that was it, he would not engage Tamino directly. Hell, even Tim Curtin had it in him to do that much although by the time it was over he probably wished he hadn’t (who can forget those exchanges). Ron revealed at least through the comments that he either didn’t read the post or if he did he didn’t seem to understand very much of it.
I read a number of financial web sites, including CBS Marketwatch.com. Whenever someone posts about the “recover in arctic sea ice” I ask them to take a look at the long term trend and to ask whether they would buy a stock with such dynamics as a long term investment. Sure looks like the sea ice is on its way to bankruptcy.
This is once again noise to confuse the debate and introduce language that fosters delay and inaction. There is no more recovery in Arctic sea ice than there is pause in global temperatures increase. Calling a recovery every little variation that gives one year a larger extent/area than the previous is profoundly misleading. Recovery means that ice would be at least increasing consistently for a number of years. Perhaps that’s what frustrates Clutz, but it is the way it is. The term recovery can be used only once there is statistical evidence of a recovery and that will take time. So far time only shows a continuing death spiral.
I’ve been goading Clutz on his blog to follow through on what he promised, and respond to Tamino. He offered up a load of crap on HIS blog. (Including a defense of his family name showing coats of arms) LOL
We will see if he has the intestinal fortitude to come back here and actually engage in this discussion. He may post something, but I doubt he will take part in back and forth on the topic. (Of course he won’t, what denier ever does)?
As a side note, long before I’d ever heard the name “Ron Clutz”, I noticed that a disturbing number of right-wingers have names that school yard kids upon first hearing, would laugh their heads off at. (John Boehner) is just one example. There must be a phenomenon where a kid is mercilessly taunted for their name, and it provokes a psychological pathology. (Conservatism)
I think we should start treating folks with these embarrassing names who turn out this way with compassion.
Tamino, perhaps you can make a list of embarrassing surnames out there, then then see how many of these poor folks are narrow minded deniers? I bet it would turn out to be snignificantly statistic.
[Response: I doubt there’s anything to it. I also suggest that we take the high road, sticking to the science and ignoring any potential embarrassment about surnames. We can do better than schoolyard taunting.]
It’s taunting for taunting’s sake. It has nothing to do with whatever name they happen to be stuck with.
I am a firm believer in mocking and “harassing” deniers. It’s the least we can do.
[Response: I suggest mocking should be aimed at the foolishness of their arguments, something which is usually rather easy to do.]
Examination of Arctic sea ice area anomaly suggests a shift to a different arctic climate pattern beginning in mid-2007 and ending in the first half of 2013. Since then this measure has reverted back to the pre-2007 behavior.
This shift is indicated by a dramatic increase in the annual range and volatility of the sea ice area anomaly value.
Unfortunately I don’t know what this different Arctic climatic mode was.
“Unfortunately I don’t know what this different Arctic climatic mode was.”
Nor does anyone else, AFAIK. Certainly the sea ice science community seems to have bee pretty shocked by what they witnessed in 2007. And I’m not aware of anything that really convincingly diagnoses just what happened and why. Discussion on Neven’s sea ice blog has highlighted differences among ‘big loss’ years, so maybe there is not a single cause. Could it be that the ‘rapid decline’ trend identified in Tamino’s analysis is just the result of natural variability plus the underlying forced trend?
Alternately, what happens if next year turns out to be another ‘big loss’ year? It’s only a few years of data since the last change point, after all. What would the statistical consequence be if extent crashed below the 3 million barrier?
Regards the change point for September sea ice extent in the mid 1990s, this seems to tie up with the hypothesis from Lindsay & Zhang that the AO/PDO in the late 1990s led to a new phase of volume loss in the PIOMAS model (and hence the real world). This volume loss was driven by ice albedo feedback.
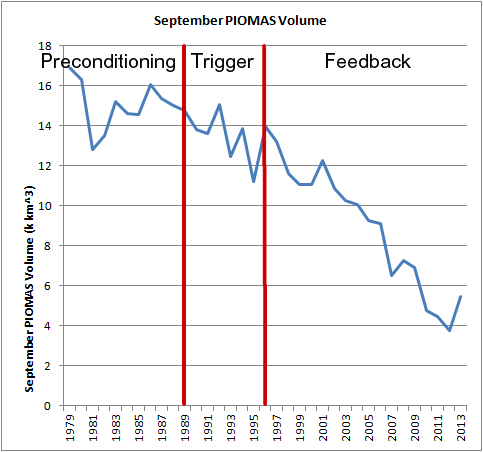
Whether we are still in the ice albedo feedback phase is an interesting question. However it is obfuscated by the weather driven (stochastic) pulse of increased volume residing in the Central Arctic since 2013.However the smoothed fit to September extent could be read as a post 2007 settling into a new regime not dominated by ice albedo feedback, in the sense of a role for that feedback in multi-annual ice loss. Ice albedo feedback has always been a key player within the seasonal cycle.
More on Lindsay & Zhang in this blog post.
http://dosbat.blogspot.co.uk/2014/03/what-caused-volume-loss-in-piomas.html
Jeff, Doc,
What has happened after 2007 is that a shift to first year ice from multi year ice (ice that has a lifespan of more than one year) has led to greater volume growth in the winter. This is because the thermodynamic growth of ice maintains April ice thickness at a little under 2m thick due to current conditions of cold. A measure of Arctic winter cold is gained from Freezing Degree Days (FDDs),
FDDs have not fallen as fast as has overall volume.

So as there is more open water at the end of the season and this must thicken to about 2m thick, volume gain in the autumn goes up. This feedback is the thickness growth feedback and it is driven by the fact that for thinner ice (or open water) thickening is greater than for thicker ice.

The apparent increased volatility since 2007 is in line with what is to be expected for a transition to a first year ice predominant ice pack. Take a seasonal thinning from April to September of 1.75m. If a region of the pack is 3m thick then it takes extremely good melt weather to produce large amounts of open water, more likely that just won’t happen. Thin that to just under 2m and a year of poor melt weather preserves a lot of ice (e.g. summer 2013 and 2014), However a year of good melt weather has the potential for greater thinning than average and opens up far more open water (e.g. 2007, 2011, 2012, 2015). However come the Autumn and rapid ice growth occurs due to winter cold, which creates large volume gains, and in the case of a largely first year pack ‘resets’ conditions back to the start of the season overwriting previous impacts.
It is worth noting the intimate relationship between the loss of volume and the decline in September extent.

Using PIOMAS Gice sub grid thickness volume in the Arctic Ocean is broken down into three thickness bands. The decline in volume comes exclusively from the thicker ice, while thinner ice has remained level, September extent is seen to track the decline of thicker ice volume, this is due to increased open water formation efficiency as the pack has thinned.
In 2010 there was a volume loss event as large as that in 2007, following that (and the implied thinning), April volume for the Arctic Ocean seems to have levelled from 2011 to 2014.

It has levelled around 19.3k km^3, the volume one would expect for a pack dominated by an average thickness of 2m thick. We will have to wait for the increased volume in 2015 to ‘work through the system’, to see if this volume reverts to a similar level.
This enhanced winter growth of ice with the transition to a mainly first year ice pack has the effect of reducing the memory of the sea ice system. This has been stated in Armour et al 2010, “Controls on Arctic Sea Ice from First-Year and Multiyear Ice Survivability”,
[Quote].
Given the strong thickness–growth feedback of sea ice (Bitz and Roe 2004), where in a warming climate we can expect the thicker MY ice to thin at a greater rate than the thinner FY ice, and the fact that the ratio of MY to FY ice entering into the MY ice category each year is decreasing, it is likely that the difference between FY and MY ice survival ratios will decrease in a warming climate. If this occurs, the Arctic sea ice system would move toward a regime of decreased memory and decreased sensitivity to climate forcing…
[Quote]
This is a major reason why models show a long tail, not a fast crash, an expectation I fully expect to be borne out by the future evolution of ice loss.
More on Thickness Growth Feedback in this blog post.
http://dosbat.blogspot.co.uk/2015/01/the-slow-transition-thickness-growth.html
PS, for what it’s worth. That Clutz bloke hasn’t got a clue about sea ice. Tamino’s rubbishing of his crap was well deserved. That the GWPF reproduced it speaks volumes for a camp on the tail end of losing the argument.
Thanks for that, Chris. Well-explained. If that is all correct, then the trend in FDD becomes pretty critical for the future evolution of the sea ice, I would think.
A question on that: in your graph of Freezing Degree Days, is ‘north of 70’ inclusive or exclusive of the ‘north of 80’ category? That is, are there two independent bands, or two nested bins?
Doc,
Yes, two nested regions, 70degN includes 80, but also includes a bit of open ocean in the North Atlantic, and some land (mainly N Greenland IIRC).
Yes a lot depends on what happens to winter warmth. A significant factor here being open water in the summer: The larger the open water and the earlier there is open water (of a larger extent) the more heat will be absorbed and that heat needs to be vented in autumn before the sea can start to freeze over. In this sense the ocean acts rather like an energy storage element like a capacitor or flywheel.
Once the sun has dropped outgoing longwave radiation (OLR), including radiation aloft from convection driven by warm moist air, becomes dominant and large temperature gradients can rapidly cool the ocean. Nonetheless, late refreezes have been a notable feature after 2007 and 2012. But the end result may mean that without something to retard OLR losses this delayed freezing has a relatively small impact on winter cold and April thickness.
This may to some way to aligning with the results of Mahlstein & Knutti, 2012, “September Arctic sea ice predicted to disappear near 2C global
warming above present” In which the authors find a linear relationship between global temperature increase and decline of sea ice within models (and to a limited degree using available data). increasing GW is of course due to CO2 (which blocks OLR), and probably more importantly increased sensible and latent heat from warmer air drawn into the Arctic Ocean from further south. Water vapour being a far more powerful GHG than CO2, and is an important factor in the melt season, e.g. Francis & Hunter, 2007 “Changes in the fabric of the Arctic’s greenhouse blanket”,
So as the globe warms, the influx into the Arctic does, with warmer more moist air being what keeps temperatures up, reducing the winter thickening of ice due to thermodynamic growth. And the resultant thinner ice in April increases loss of extent in the summer until so much ice melts in the summer that the ocean becomes sea ice free in summer (or virtually so – extent in September <1M km^2). Mahlstein & Knutti find that this should happen at around 2degC GW.
M&K 2012
Click to access mahlstein12jgr.pdf
Thanks again, Chris.
Thanks for indulging my tendency to ramble about sea ice. ;)
Clutz won’t be back. He has the perfect excuse not to engage in the personal attacks levelled at him in the comments. This illustrates perfectly a tactic frequently used by the disinformers – the “they were mean to me so I won’t play” card. This allows the disinformer to avoid any substantial criticism by focussing on the easiest to handle juvenile taunting. A win for the disinformer as they can claim they tried to engage but were driven away by personal attacks because their attackers “couldn’t play the ball” (or variations thereof).
Yadda yadda concern trolling etc. but I see the pattern so often it amazes me that apparently responsible, concerned adults can continue to provide the likes of Clutz with such an easy out. Pearl clutching (watch Tom Fuller for an expert in this) plays well to the disinformers target demographics who 1) may not be used to the robustness of internet debate or 2) know very well the best way to cover ignorance or avoid admitting a mistake is to go on the attack & thus project that mindset onto others.
Ah, but Clutz did respond to Tamnio’s ‘hit piece’ by doubling down with a whole new blog entry. Conclusion: Arctic Ice Extent is no longer declining, move on.
Yeah, I hear you about personal attacks. If nothing else, when innocent bystanders wander into the long grass that is internet comment threads it can leave them with the impression that people are ill-tempered and rude (a few people can do that and make it funny, which I’m jealous of, but it is only a few) – which isn’t a good impression to give.
But some of us did give the guy a lot of time and showed a lot of patience and explained as best we could that stats is actually about extracting meaning from data (which requires a bit of due care and diligence), not about getting confused by or using wiggly lines as a form of sleight of hand. Honestly, I don’t really think he was interested.
Quiet Waters,
To be fair to Clutz, I did a rather scathing criticism showing that deeper in the sea ice data there is evidence of the ongoing decline of ice. He has posted a link at the top of his post, while taking perverse delight at being called a fool (taking an old definition of the term).
Amusing diversion over, I’m back to my general policy of ignoring denialists and leaving the ongoing process to undermine them.
I have basic questions about Arctic ice:
– Are there any marine-terminating glaciers that feed into the Arctic Ocean? Antarctica has the paradox of more [berg] ice as the Southern Ocean warms.
– Are there growing outlets of meltwater (i.e. from land glaciers or ice fields) into the Arctic Ocean? Doesn’t freshwater on the surface make for quicker formation of sea ice?
–Yes.
–Situation is different in the Arctic as Arctic is an ocean basin while Antarctic is a continent surrounded by an ocean. I suspect, but do not know, continental freshwater runoff from rivers vastly outweighs the freshwater runoff from elevated ice sources in the Arctic. I’m sure some expert knows for sure.
Elaborating a bit on what jg said:
–Total ice mass is way, way less. Probably flow rates, too.
–Freshwater fluxes into the Arctic Ocean are very large. The McKenzie is one the the world’s great river systems, draining nearly 1.8 million km2 and discharging more than 10,000 m3/sec. On the Russian side, the Lena is even bigger–nearly 2.5 million km2 and 17,000 m3/sec–with the Yenisei larger still at ~2.6 km2 and 19,000 m3/sec.
So, yeah, I’m pretty sure that jg was absolutely correct about the relative freshwater fluxes. (Heat fluxes, too; the river water is usually significantly warmer than the ocean water to which it flows. Sometimes that’s visible in coastal melt or freeze patterns, IIRC.)
https://www.google.com/search?q=arctic+ocean+glacier
Exactly! A firehose of older articles and tangentially related discussions, few of which address the new warmer-water/low-ice dynamic in the way that recent research has addressed the surrounding waters of Antarctica and Greenland. (Though perhaps there *is* a pertinent one buried in the 1,7000,000 search results. And vaccines cause autism!)
Thank you, jgnfld. I was thinking of David Barber’s Tedx description of the changing qualities of the sea ice in the AO, plus the freer motion of bergs, and wondered if the *number* of bergs would also increase *within* the AO. Also, I’ve learned that we should watch increasing freshwater flows into/onto the ocean, a la the “cool pool” SSE of Greenland.
Tamino, September’s PIOMAS volume data were published yesterday so I have updated my ice cube animation.
(You played a part in getting me interested in using my programming skills to do Arctic related graphics!)
Arctic Sea Ice Minimum Volumes 1979-2015
Nice!
Stumbled onto an elegant instructional for isotope fractionation
… This is great. Now I understand, and trust the data process behind so many of those graphs.
Published on Aug 4, 2014
“An introduction to isotope fractionation”