
I recently posted about the difference in sea ice changes between the Arctic and Antarctic. A comment appeared from Dave Burton which included some nonsense trying to claim that the Antarctic sea ice gain is more important for climate than the much greater Arctic loss. He happened to be the same Dave Burton associated with “NC-20,” a group which tried to get the North Carolina state legislature to outlaw any official use of sea level rise forecasts other than the extrapolation of a linear trend based on past observations.
I informed him that I intended to do a post about his claims on sea level rise. I even promised, at his request, that I would not censor his replies to that post. He starting commenting prolifically on the sea-ice post, with no fewer than 15 comments in the space of about 48 hours. He seemed exceptionally eager to engage — I got the impression he could hardly wait to argue with us about our silly ideas that the next century would bring much greater sea level rise than the last, an ominous threat to the future.
When the sea-level post appeared four days ago, he suddenly went silent. We’ve heard not a peep from Dave Burton since. I guess the cat got his tongue.
Among all the talk about sea level, we haven’t forgotten about sea ice. Let’s talk about Burton’s original comment:
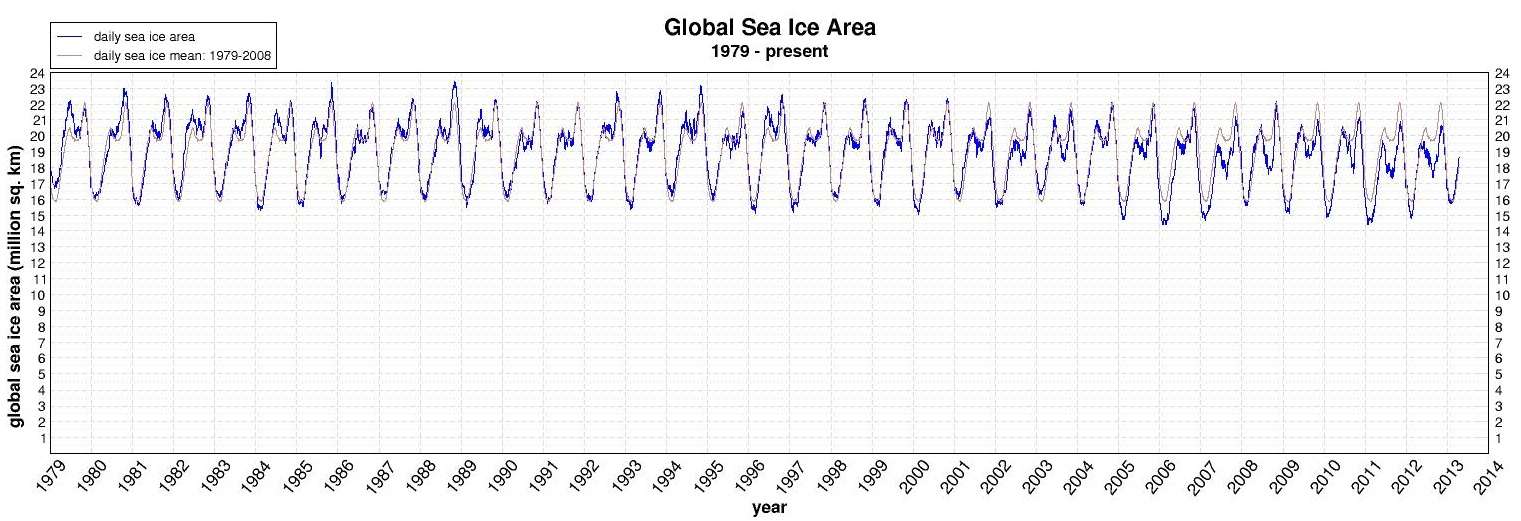
daveburton | September 24, 2012 at 3:45 pm | ReplyIt is true that total sea ice extent is down. Compared to the 1979-2008 average for this date, global sea ice is currently down about 7%:
Of course, total sea ice extent varies by about 30% over the course of a year, so a 7% drop isn’t really very much. Moreover, Antarctic sea ice extent (which is high this year) is more important than the Arctic sea ice extent (which is low this year) because:
1. Antarctic sea ice is a better climate indicator than Arctic sea ice, because Arctic sea ice is greatly affected by factors other than climate, Antarctic sea ice less so. Antarctic sea ice is anchored to a continent, rather than blown around by the vagaries of the wind. Plus, this year, a big, unusual August storm that broke up the Arctic ice. And,
2. As an albedo-based feedback mechanism, Antarctic ice is more important than Arctic ice, because Antarctic ice is at less extreme latitudes.
I’ll leave it to readers to dispute most of his claims. In this post, I’d like to compare the albedo feedback between Arctic and Antarctic sea ice changes.
First of all, for most of the year higher latitudes receive less solar energy than lower latitudes. But deep in the heart of summer this is no longer true. In fact at the point of midsummer, the poles receive more solar energy than any other place on earth. Here’s the solar insolation as a function of latitude, for various times of year from northern midwinter (southern midsummer) to northern midsummer (southern midwinter) (note: this does not include the correction for varying earth-sun distance, it’s merely to illustrate the latitude dependence at a given time of year):

During the summer months, when ice albedo feedback really counts, higher latitudes really do get more solar energy than lower latitudes. When the insolation depends strongly on latitude, with higher latitudes getting much less solar energy, the total insolation is so small that the impact of albedo change is small.
Another factor is that earth is farthest from the sun during northern hemisphere summer (when albedo change counts most) but closest to the sun in southern hemisphere summer. That has lead some to believe that the impact of albedo change will be enhanced in the southern hemisphere. This is an understandable mistake; in southern hemisphere summer earth really does receive more solar energy per unit of time because we really are closer to the sun. But the rate of travel of the earth along its orbit is inversely proportional to the square of our distance from the sun — exactly the same proportion by which solar energy changes — so the northern hemisphere summer may be weaker than the southern, but it also lasts longer. For total insolation, the two factors cancel each other so at any given latitude, the annual-total solar energy input is unaffected (a fact which was emphasized by Peter Huybers in relation to ice age cycles). So no, proximity to the sun during southern hemisphere summer doesn’t enhance the ice albedo effect.
If we really want to know the relative impact of ice albedo change between hemispheres, the thing to do is: the math.
I took daily values of sea ice area from NSIDC. I modelled the Arctic ice pack as a circle around the pole of the same area, and the Antarctic ice pack as a ring around the Antarctic continent, with the edge of the Antarctic continent as being at latitude 70S. This is only a crude representation of the geometery of the sea ice packs, but it’s at least correct to first order.
Then I computed, for each day, the sun’s declination (its altitude above or below the celestial equator). I also computed the earth-sun distance so I could apply that correction to the solar insolation. This enabled me to compute the total amount of solar radiation hitting parts of the earth which are covered by sea ice, which I call “sea ice insolation“. I did so separately for the northern and southern hemispheres.
For both hemispheres, sea ice insolation shows a strong annual cycle. So I computed the average total sea ice insolation for each year, for each hemisphere, corrected for earth-sun distance and angle of elevation of the sun. This gives the annual average sea ice insolation in TW (teraWatts). We can then look at the trends in sea ice insolation, to see which pole has lost or gained more in terms of solar energy impacting sea-ice-covered regions.
It’s quite a complicated calculation, so it’s possible I’ve made an error. But the amounts are certainly in the right ballpark, and I’ve done orbital calculations for decades, so I suspect I got it right. The data cover the time span from 1979 through 2011 (2012 isn’t over yet so is not included).
And here’s the result: annual average sea ice insolation, together with linear trend lines, for both hemispheres:

Since 2012 is incomplete, this doesn’t include this year’s ever-so-slightly record high Antarctic sea ice or way-astounding record low Arctic sea ice. But you can see the trends. Clearly. The trend has shown an increase in Antarctic sea ice insolation of about 53 TW, and a decrease in Arctic sea ice insolation of about 329 TW. That’s over 6 times as great.
If we spread 53 TW over the entire earth we get a global average of 0.10 W/m^2. So even if the difference between ice and ocean albedo were equal to 1 in the southern hemisphere (i.e., Antarctic sea ice were perfectly reflective while ocean was completely absorbing) the net global climate forcing would amount to -0.10 W/m^2. But sea ice isn’t perfectly reflecting, not even in the southern hemisphere where the sea ice is often snow-covered, and ocean is not perfectly absorbing. If the top-of-atmosphere (TOA) albedo difference between sea-ice-covered and open ocean areas is 0.2, then the global climate forcing from Antarctic sea ice changes would be about -0.02 W/m^2.
If we spread 329 TW over the entire earth we get a global average of 0.65 W/m^2. If the TOA albedo difference between sea ice and open ocean is 0.2, then the global climate forcing from Arctic sea ice changes would be about +0.13 W/m^2.
And it turns out that 0.2 is not a bad figure for the TOA albedo difference, according to Hudson 2011 (JGR, 116, D16102, DOI:10.1029/2011JD015804):

In fact Hudson states that “Results show that the globally and annually averaged radiative forcing caused by the observed loss of sea ice in the Arctic between 1979 and 2007 is approximately 0.1 W m-2,” so my crude calculation is certainly in the right ballpark. As I said, this is a pretty complex calculation so I may have made an error, but I certainly ended up in the right neighborhood according to Hudson.
I’m gonna go out on a limb and suggest that Dave Burton didn’t do this calculation. In fact let me take a wild guess — he doesn’t know how. But he still felt qualified to lecture us about the albedo impact of Antarctic vs Arctic sea ice changes. And he certainly feels qualified to lecture the North Carolina state legislature about planning for future risk from sea level rise.
My opinion: Dave Burton is typical of the vast majority of fake skeptics about climate science. He really, really isn’t qualified to discuss the subject. But not only does he do so, he tries hard to influence public policy about it. This is why governments worldwide have been so effectively paralyzed — because there are so many voices, speaking so loud, whose influence (on both politicians and the general public) is way out of proportion to their qualifications even to understand, let alone advise, on the subject. Dave Burton is hardly unique in this respect, he’s actually typical. The loudest voices seem to be those of the most ignorant.
Just my opinion.
I suggest to the people of North Carolina that taking Dave Burton’s advice on scientific topics is a very bad idea.


Thanks Tamino a timely post, plenty to go through.
What he is totally ignoring is that and ice free arctic will have substantial effects on the wetter on the northern hemisphere.. As there are a lot people living there as well as a lot of agriculture the change in the wetter patterns may have big local impacts without the overall global temperature / OHC rising.
The southern hemisphere will be stabilized by the Antarctic for some time to come
“But the rate of travel of the earth along its orbit is inversely proportional to the square of our distance from the sun — exactly the same proportion by which solar energy changes — so the northern hemisphere summer may be weaker than the southern, but it also lasts longer.”
My immediate reaction to this was that it is obviously wrong, but I think I now see what is going on. It certainly is to me rather counterintuitive.
The reason I thought it was wrong is that the length of summer is not determined by the distance from the sun – it is determined by the direction of the Earth’s tilt. If the Earth’s tilt precesses at a constant rate relative to the sun, then the length of the NH and SH summers must remain equal.
So why is this reasoning wrong? Because we need a change of frame. The earth’s tilt doesn’t precess (on annual scales at least) – it remains in a constant direction while the earth moves round the sun. When the Earth is farthest from the sun, it is subtending angle more slowly, and so the angle between the earth’s tilt and the earth-sun vector is changing more slowly. Hence the argument is correct, the summer is longer.
Interesting. I’d never thought of that.
[Response: It’s Kepler’s 2nd law.]
Kevin,
The length of the seasons is determined entirely by the *speed* of Earth’s orbit at various points. The endpoints of the seasons are at right angles radiating from the Sun, which the Earth’s elliptical orbit intercepts at various distances from the Sun. Earth moves faster when we’re closer to the Sun, so when we’re closest to the Sun (January), that is the shortest season (NH winter, SH summer).
I should also point out that it’s not only Earth’s speed which causes the difference, but also the shorter length of the seasonal quarter-orbit. In other words, not only are we moving faster during January, but we have a shorter distance to cover.
If you formulate it in terms of angular motion, you don’t need to be concerned with the arc length. Kepler’s second law says that in a given time , the radius vector sweeps out a fixed amount of surface area, in this case a narrow triangle with surface area
  , where
  is the heliocentric longitude of Earth. This being constant, it follows that
  is proportional to
  .
.
Kevin
I think your main problem is that you appear to think that the seasons are caused by the precession of the earth’s axis. This is not the case. For the purpose of this exercise the direction of the earth’s axis remains constant. The seasons are caused by the fact that the earth orbits around the sun while the axis keeps pointing twoards the pole star. To understand this get yourself a globe, set it up so that the North Pole is pointing roughly North put an orange about a metre to the south and then move the globe around the orange keeping the North Pole pointing north. You start with the Arctic pointing away from the orange (Northern Winter, Southern Summer), when you have gone through 180 degrees the North Pole will point twoards the orange (Northern Summer, Southern Winter) even though the axis is still pointing in the same direction.
The earth’s axis does precess but only at about 1.38 degrees per century – it makes a difference on a multi millenia timescale and is part of the mechanism of the Milanchovich cycles.
Err, yes. I think you may have stopped reading my comment half way through.
I first explained my initial incorrect understanding. Then I explained my subsequent correct understanding. The latter being what you just said.
It was a didactic exercise to help anyone else who found the issue counterintutive for the same reason as me.
Oops – sorry Kevin – though I actually got through about three quarters of your comment.
Another important factor is that in the dark, sea ice and even more so sea ice with snow on top’ insulates the water underneath and slows the water loosing heat to the atmosphere and thence to space. So far from the additional Antarctic winter sea ice offsetting the reduced summer Arctic sea ice it actually makes the problem worse.
This is very interesting. A few points/questions.
1. It’s interesting to compare the decline in annual sea-ice insolation with, say, September sea-ice extent and area. Your plot shows that sea-ice insolation has declined by a bit under 20%. September sea-ice extent previous to this year has declined by about 40% (NSIDC), and sea-ice area by about 45% (Cryosphere Today/NSIDC).
This is because the decline in sea-ice has been much lower around the time of the northern hemisphere summer solstice in late June, and thus it is important to note that the sea-ice albedo feedback has not yet kicked in as much as you might imagine by looking at the dramatic declines in September sea-ice.
The massive changes we have seen already are only just the beginning.
2. I would find it interesting to see monthly data for your sea-ice insolation. This might make it clear why Burton’s simplistic argument is wrong (I suspect a large part of the answer is that Antarctic sea-ice is already seasonal, and pretty much completely melts out every year).
3. You simplify the geometry of the Arctic and Antarctic sea-ice packs. Why do you not use the actual data? Could you not use something like HadISST to give the geographical distribution of sea-ice?
If this makes the calculation horrendously complicated, than another alternative might be to see if you can get hold of clear-sky SW at TOA from a reanalysis. I don’t know whether you’d trust the clouds in the reanalyses, but the clear-sky should be pretty good, and would be dominated by the change in albedo due to changes in sea-ice. Maybe I’ll do this.
You do understand you are arguing with people who want to legally ban sea rises unless they conform to the past? But I found your post as interesting as ever. Incidentally King Canute got a bad name for telling the sea to halt, he supposedly set his throne on the beach to demonstrate to his courtiers that he had NO power over turning the tide.
Hi, this is not a comment, more a request- if you happen to be at a loose intellectual end an area of hot debate for non sceptics [and I suppose deniers] is the effectiveness of solar panels, particularly in northern Europe. Germany apparently met 50% of its peak demand for 2 days in May, so I wonder about the future, could solar fill a nuclear or coal gap? These burning issues do make me wish I did some math at school! thanks Jules
Hi,
(Disclaimer, I have 2.76kWp of solar panels on my roof – SW UK)
Trivially, Solar power cannot displace 24/7 baseload (Nuclear/Coal) without some form of extremely expensive* storage. Doesn’t make it useless, but it does often appear that you are displacing peaking plants. I’d also add that from a AGW perspective, replacing Nuclear capacity with renewable capacity is not helpful.
This does give economic problems – for the NH winter months, solar power is minimal, so you need other power plants. And those power plants will have static costs (i.e. cost of capital, staffing, maintenance), so their energy costs per unit will go up.
For my 2p.. we need to switch the way we look at electric grid balancing. If we look at the big low-to-zero CO2 sources (Nuclear, Hydro, Wind and Solar), then only one (Hydro) can quickly ramp to demand spikes, and is by definition limited in capacity. Wind and Solar are coming down in cost but cannot deliver reliability; and there is no realistic storage on the scale required. Nuclear power has issues ramping to meet demand. So, the answer is to build lots of all of them. Sufficient that primary demand is always met (with hydropower kept ready for spikes/outages), and the excess can be used for various ‘sinks’; domestic hot water/heating, Ammonia manufacture, Aluminium and other electrolysis, hydrogenation in oil refineries, processing of organic-based waste material to methanol, industrial heat, electric car charging.. There are many potentially variable demands, some of which would also offset other CO2 sources.
A variable-demand grid would make any source of zero-CO2 electricity useful, which is closer to the point. As it is, Germany is phasing out nuclear power and building coal power stations, and the policy elsewhere of using gas power plants to offset renewable variability limits the possible CO2 savings.
*Even completely free storage would waste some energy. Solar power storage – to make it coal-equivalent – would have to be able to average over all 4 seasons. That’s not realistically going to happen; the numbers don’t stack up.
In some areas it can. California solar thermal plants have achieved better on-line time than neighboring coal plants by storing excess heat from the day in molten salts, then using it to turn the turbines at night and in cloudy weather. Some have operated 24/7 for several days at a time.
AD: I’d also add that from a AGW perspective, replacing Nuclear capacity with renewable capacity is not helpful.
BPL: That’s not true either. Nukes need vast amounts of concrete, which release CO2 as it sets. Mostly this is for the cooling towers; coal plants use almost as much. Solar thermal plants don’t need cooling towers at all.
This is way off-topic but…
Every Rankine cycle steam turbine requires condensing the spent steam at the bottom of the cycle. There are four ways to do this; all four are in use but the first two are most common.
1. Once-through cooling water from an adjacent body of water. The resulting warmed water is returned to the source, further downstream or just deeper.
2. Water evaporator. The evaporating water cools the spent turbine steam into water for pumping.
3. Air cooling. This is similar to radiators in automobiles, just on a much larger scale.
4. Closed loop underground pipes. The cooling water is pumped through an extenive system of pipes far enough undergraound that the ground temperature is a steady 10 degrees Celcius year round.
A solar thermal plant must use on of these four methods. While I don’t know of any nuclear power plants using methods 3 or 4, this is certainly possible. Indeed, a combination of any of this methods is also possible.
Skeptical Science October 1, 2012 has a relevant (very..) post on The Economic Damage of Climate Denial which discusses a 2012 paper by Johnson and Hope. http://www.skepticalscience.com/johnson-hope-2012.html
Kepler’s Second Law and math…nice way to limit the knotheads….
BPL..
Living in the UK, you can sometimes forget about the concept of Solar Thermal (or, indeed, ‘the Sun’)… it’s not realistic for most of Northern Europe where we have strong seasonality. Which also means Germany.
And I was talking about Germany’s recent decision to switch off it’s nuclear plant – where construction emissions have already been emitted. Which will, by the time they have replaced them with the new coal plants, effectively undo all of their investment in wind and solar, at least as far as CO2 emissions go.
(Sorry about the off topicness, I have commented with another semi-informed rant at SkS..)
@tokodave
The first comment on that Sceptical Science post brings up the infrastructure investment needed for centralized power production vs. distributed, which is easier to do with renewables. The spread of mobile phones in developing countries is an excellent example of how the lack of infra has led to technology leapfrogging before.
Thanks for the link!
Tell me if I’m doing this right. Removing ice from Antarctica leaves land, albedo 0.14 on average. Removing ice from the Arctic leaves ocean, albedo 0.04 on average–perhaps as high as 0.10 due to the high angle. Darker albedo causes greater warming. So the claim is prima facie wrong. Ice in each hemisphere will have about the same albedo; it is certainly not brighter in the Antarctic, where it is overwhelmingly older.
[Response: This discussion is only about sea ice.]
Oops. My bad.
Right now, if North Carolina wants to pretend sea level rise is not going to accelerate its more clearly a bad idea for the US than it is for North Carolina. I put more detail in this comment on your Unnatural Hazards post.
An excellent book is The Rising Sea by Orrin Pilkey and Rob Young. Pilkey and Young point out that if a 3 foot sea level rise over 100 years is assumed it would end development on most barrier islands.
“Underlying this problem in the United States is the Stafford Act. Passed by the U.S. Congress in 1988, the act allows the expenditure of money to restore community infrastructure once the president issues a disaster declaration. It is an unquestioning, automatic response to a disaster. No environmental impact statement is required, and money may even be spent on coastal areas where other expenditures of federal money are prohibited. Those who invest in vulnerable coastal areas need to assume responsibility for that decision.”
“The guarantee of recovery is perhaps the biggest obstacle to a sensible response to sea level rise. The goal in the past has always been to restore conditions to what they were before a storm of flood. In the United States, hurricanes have become urban renewal programs. The replacement houses become larger and even more costly to replace again in the future. The problem is compounded when even people whose rental investment houses were destroyed are considered victims; maybe people who insist on building adjacent to eroding shorelines facing the open ocean should be considered fools rather than victims?”
Its one thing to assist people in areas built up before new risks were known. If we, as US taxpayers, are stupid enough to allow N.C. to do whatever it likes because we’ve said we’ll pay for whatever, we deserve what we get.
In cloudy areas like the southern ocean, does the albedo difference between ice and water really matter that much?
[Response: The albedo difference due to converting sea ice to open ocean isn’t as large under cloudy conditions but is still nontrivial (see the figure on albedo as a function of solar zenith angle, taken from Hudson 2011). An important factor (according to Hudson) is how sea ice changes might affect cloudiness fraction.]
First, kudos for this being the first blog post I’ve seen that invoked one of Kepler’s laws in a discussion of climate science. Awesome. ;-)
Second–and far more importantly–I imagine a large part of the reason Burton fell silent is because he realized he was overmatched. It’s one thing to peddle one’s particularly noxious brand of BS in front of an obsequious Heartland crowd or a bunch of enthusiastic, profit-uber-alles, “We hate regulations, so we hate science!” North Carolinians. But it’s something else entirely to attempt a fertilizer sale while standing stand toe-to-toe with someone who actually knows what he’s talking about. In short, Burton backed down. And rightly–if cowardly–so.
“As an albedo-based feedback mechanism, Antarctic ice is more important than Arctic ice, because Antarctic ice is at less extreme latitudes.”
Well, white is white. Arctic ice cover in the winter dips down south of Hudson Bay. Comparable latitude: Tierra del Fuego. Much more land cover in Canada than in Tierra del Fuego. At comparable latitudes,the Southern Hemisphere is mostly open ocean.
That leads to the NH snow albedo effect, which is absent in the SH.
[Response: And from the little data I’ve seen, it’s substantial — but I haven’t yet done the math.]
And, of course, I completely neglected the ice and snow cover in Siberia.
The Great Circumpolar Bear Cult strikes again.
You’ve upset a lot of “skeptics” now. They believe that you should not defer to experts, but should understand it all yourself. This is based on a general distrust of authority.
I played Diplomacy once with a “skeptic”. We always wanted new players to start off well, so we’d tell them the optimal opening moves for their country. But he knew we were tricking him, so did the opposite and rapidly wiped himself out.
Re the paragraph beginning with “My opinion:” The organization for which I work has been described as a technical debating society. People who think they know more than they actually know hold forth on scientific topics, including climate, about which they know very little. Some of them even think that admitting ignorance about a scientific subject is a sign of weakness. The junk I’ve heard during discussions of climate at my place of work is appalling.
“Doctor Burton’s Magic Elixir”
— by Horatio Algeranon
Doctor Burton’s Magic Elixir
Is a tempting trouble fixer.
Take a single swig today
And watch your worries melt away,
Along with sea-ice in the arctic.
Burton’s cure is quite cathartic,
Keeps at bay the Reality Blues
Heads you win and tails we lose.
Great post tamino. Mind if we use it over at SkS? I’ve been wanting to look into the relative albedo effects of sea ice in the two hemispheres.
[Response: Feel free.]
Jim Pettit wrote: “I imagine a large part of the reason Burton fell silent is because he realized he was overmatched.”
Probably true, but he started so strongly by using Tamino’s first name in a wink & nod “I know your ip address” Wattsian kind of way that he had to know what he was getting himself into.
Or then again, maybe not. Perhaps just another example of his ignorant arrogance?
I continue to think that an important and under-appreciated aspect of the Arctic v. Antarctica debate is what the pre-1979 data tells us: namely, that Antarctic sea ice was likely higher than 1979 levels according to alternate satellite data from the 70s as well as whaling records, and that therefore while sea ice there has been growing for the past 33 years it is still lower than it was in the 1950s, whereas in contrast, Arctic sea ice is almost certainly lower than it was since the 1950s (extensive ship records), very likely lower than the last 300 years (scattered ship records), and very possibly lower than the last several thousand years (driftwood, modeling, sedimentation, beach erosion, and other indirect methods).
Add that to this analysis on insolation, the fact that on a percentage basis Arctic ice is declining way faster than Antarctic is increasing as well as somewhat faster on an absolute basis, and a number of logical errors (eg, comparing the 7% reduction in global sea ice to a 30% annual variability makes about as much sense as saying that we wouldn’t worry if a mad scientist put up a giant sun-shade that blocked 1/5th of the sun’s light because daily variability is equal to 100% of the sun’s light, or trying to claim that Antarctic sea ice is “anchored” when in fact winds blow it around all the time), and it all adds up to Burton being way, way off-course (approximately equal in magnitude to passing through the Panama Canal and thinking he’s found the Northwest Passage).
Hi Tamino,
Great post as always, just maybe an itty-bitty minor issue:
“This gives the annual average sea ice insolation in TW (teraWatts)”
Insolation is usually written as a power per unit area (sometimes other dimensions too, but most commonly that). Annual implies a time integral so are the units W-hr/m^2 or J/m^2 for units of annual insolation, or for the total area simply W-hr or J. Correct me if I’m wrong.
[Response: Indeed my terminology is not quite correct. I should have called it something else, like sea-ice-solar-power (power being energy per unit time, in units of watts or TW).]
You really don’t have to know very much science to see that Dave Burton and others who try to sell this kind of propaganda are way off base.
Tamino – many thanks for this clear description of the net decline of planetary albedo from the polar ice caps – your facility with such mathematics is to me astounding.
There is a further aspect of the issue – to which you made reference above – being that of the ongoing decline of snow cover, which I gather is of very significant impact on arctic amplification. In order to present comprehensive scientific information on albedo loss, in a form that can be assimilated by ordinary people (from farmers to journalists to politicians) I wonder if you might consider assembling a time series of global albedo loss due to cryosphere decline, translated into the metric of CO2e ppmv – since this is the standard measure for public discussion of mitigating the climate threat ?
Alongside the implications of the OTI timelag on warming, the lack of any credible depiction of a major feedback’s track record has to be among the greatest of the shortcomings in public information on climate, and albedo loss being thus far the leader it seems a fitting first candidate.
On one point I would, with much respect, beg to differ and ask you to reconsider:
“. . . he tries hard to influence public policy about it. This is why governments worldwide have been so effectively paralyzed — because there are so many voices, speaking so loud, whose influence (on both politicians and the general public) is way out of proportion to their qualifications . . . ”
This is I know the orthodox assessment, but having first been accredited to UNFCCC sessions in the early ’90s, it seems to me way over-generous to ascribe such influence to third-rate shills like Burton. With the superpowers in deadlock over climate since 2000, what other governments worldwide would gainsay them ? The paralysis arises from the ‘brinkmanship of inaction’ between them, as was imposed by Cheyney and as has, sadly, been adopted and rigorously pursued by Obama.
Evidence of that ongoing pursuit is widely available – from his unforced adoption in March 2009 of Bush’s unilateral 2005 emissions baseline, that reneged on the UNFCCC mandate, which signalled that US climate policy would be unchanged;
– though Obama’s ‘deal’ at Copenhagen demanding that China accept its people each having about one third of the emissions rights of each American by 2050 –
– through the derailing of the senate climate bill, as the forensic New Yorker article by Ryan Lizza described in detail, by Obama and senior staff,
– to the long retreat from speaking strongly of climate – down to once a month and then not even that – despite polls repeatedly showing a substantial cross-party public majority for action. (Climate Progress has been posting them to the point of tedium – with more today).
I suggest the gagging of Obama is self-inflicted, as a necessary part of the bipartisan climate policy of a brinkmanship of inaction with China. The likes of Burton et al, whose occupation was hastily boosted after the 2008 election, serve only as a cover notionally excusing that silence, when in fact, given rising climate impacts, Obama cannot afford to encourage any public demand for climate action whatsoever before the policy objective is achieved. And the reason that maintaining the bi-partisan policy matters so much is that the US has no other non-military means available by which to deflect China’s rise to global economic dominance – than awaiting the approaching climatic destabilization of China’s regime by rising food price unrest. (Are there any reading this who are unaware that maintaining US global economic dominance has been Washington’s paramount priority since WW2 . . ?).
This analysis of the reason for global paralysis on climate was developed independently by me some years ago, and has since come to light unprompted in various parts of the world over the last few years. With Stern’s latest rhetoric and the crash of arctic sea ice volume it is plainly high time it was more widely considered. Since we’ve been trying for a generation to get people and politicians to comprehend the science, it seems ironic to now ask for scientists to apply their extraordinary intellectual rigour to the analysis of the actual politics of climate rather than adopting an orthodoxy – but such are the strange times we inhabit.
Regards,
Lewis
[Response: I don’t think we can rely on scientists to analyze the actual politics of climate — at least, not climate scientists. Perhaps a better strategy is to communicate the danger so clearly and forcefully that the voting public demands action — wake them up before some impending disaster does so.
I too am not satisfied with Obama’s handling of the global warming issue. But I’m not willing to cut off my nose to spite my face; I’m absolutely certain that a Romney administration would be a total, unmitigated disaster. His goal is to increase the wealth of the wealthy at the expense of everybody else, and he’ll sabotage any hope of realistic climate policy to do so. It seems to me that he objects to people feeling “entitled” to a liveable planet.
At present, the best thing we can do in the short term is re-elect Obama. After the election, I’ll be happy to pressure him.]
So Burtons first point is that the Arctic sea-ice isn’t a good indicator for climate because it’s sensitive to the weather…? That would be novel if it wasn’t quite so stupid.
Another great post… but I’m wondering, a bit, about the obvious: most of the comments a la Burton I’ve seen concern the Antarctic *maximum*, whereas the greatest change in the Arctic occurs around the *minimum.* Both are lagged from the respective Solstices, occurring in fact close to Equinox, but still, looking at the extent curves–seen in the “Poles Apart” post earlier this month–it seems as if relatively more of the Antarctic extent ‘delta’ might occur in the dark of the long polar night than is the case for the Arctic. (For instance, the Antarctic extent declines quite precipitously in the first month or so of Polar light. BTW, it’s interesting to note the differing shapes of the Arctic and Antarctic mean annual extent curve.)
Since your analysis used daily data, and approximated the relevant geography, this effect (if any) should be captured therein. Perhaps it’s a contributing factor to the dramatic difference seen in your Graph 2?
Wonderful post indeed. Its totally wrong to compare Maximums with Minimums from one Pole to another. I am ready to bet that sea ice Maximum in the Arctic can extend to all time records in the next few years. All it takes is calm winds, clear skies and the right relatively mild polar temperatures (-2 for sea -11 for air). The winds bit can be highly moderated by sea ice or land. The real comparison is minimum to minimum Pole to Pole. And I am not at all convinced Antarctica slightly increasing minima means its cooling! Is rather the opposite.
Dave Burton
“Antarctic sea ice is anchored to a continent, rather than blown around by the vagaries of the wind”
Right. The continent surrounded by the southern ocean, which brings fear into the hearts of seamen. No winds there to blow the ice around.
Oh, good grief. My eyes skipped that part. I’m sure my wheat clipper sailing great grandfather’s heart never skipped a single beat when rounding Cape Horn. Those calm waters and balmy breezes would have been a sailor’s delight.
“The evening was calm and bright, and we enjoyed a fine view of the surrounding isles. Cape Horn, however, demanded his tribute, and before night sent us a gale of wind directly in our teeth. We stood out to sea, and on the second day again made the land, when we saw on our weather-bow this notorious promontory in its proper form — veiled in a mist, and its dim outline surrounded by a storm of wind and water. Great black clouds were rolling across the heavens, and squalls of rain, with hail, swept by us with such extreme violence, that the Captain determined to run into Wigwam Cove.”
http://www.literature.org/authors/darwin-charles/the-voyage-of-the-beagle/chapter-10.html
Did someone say ‘major summer storm?’ Try one week, more or less, at any given location in the Southern Ocean.
“Even a cursory look at the Atlas of Pilot Charts for the area confirms the Southern Ocean’s fearsome reputation. Gale frequencies, wave heights and sea temperatures south of 40°S during the relatively stable summer months of January and February resemble mid-winter conditions in the North Pacific or North Atlantic.”
“In the southern Atlantic and Indian oceans, average wave heights exceed twelve feet up to 30% of the time between 40 and 45°S, and 50% of the time south of 50°S. Ice limits reach as high as 35°S in the Atlantic. While summertime gale frequencies in the high latitudes of the
northern oceans average between 1 and 3%, south of 40°S summertime gale frequencies of 5-8% are the norm with double-digit percentages south of 50°S in many areas. This translates into an average of one gale per week south of 50°S with the accompanying frontal systems sweeping through the Roaring Forties every few days.”
Click to access SouthernO.pdf
‘ … Hudson states that “Results show that the globally and annually averaged radiative forcing caused by the observed loss of sea ice in the Arctic between 1979 and 2007 is approximately 0.1 W m-2,” … ‘
Here is another number to compare with the Hudson estimate. From
http://psc.apl.washington.edu/wordpress/research/projects/arctic-sea-ice-volume-anomaly/
‘ To melt the additional 280 km^3 of sea ice, the amount we have have been losing on an annual basis based on PIOMAS calculations, it takes roughly 8.6 e19 J or 86% of U.S. energy consumption.
However, when spread over the area covered by Arctic sea ice, the additional energy required to melt this much sea ice is actually quite small. It corresponds to about 0.4 W/m^2 . ‘
sidd
And the interesting thing about that is that when the ice is gone the energy supply will continue, increased by the albedo effect. Having all that energy looking for something to do next to the Greenland Ice sheet is not very comforting.
Another bunch apparently do believe all this stuff is for real: fossil fuel companies. Otherwise, why would they have the confidence they do that it will be profitable to drill for oil and gas in the Arctic, without fear of their operation being iced in over the whole year?
People of North Carolina: here’s advice that seldom fails. Follow da money.
More on my blog.
Very interesting. I did a similar calculation a few months back that uses average monthly insolation for weighting, which allows us to roughly compare the percent change in sea ice versus the percent change in clear-sky TOA albedo (I did not take into account differential cloud coverage by latitude):
Interestingly, the insolation weighting both INCREASES the rate of decline in the NH and DECREASES the rate of incline in the SH relative to the unweighted values, presumably because of the minimum/maximum relative to the time of year. However, when combining the two, the trend in total sea ice is about -0.209%/yr, whereas the insolation-weighted portion relevant to the albedo feedback is -0.173%/yr.
I believe this is because the latitudes of the SH sea ice receive more insolation, so if one were feeling charitable Dave Burton could be considered technically correct on this narrow point…all else being equal, the same change in sea ice area for the NH vs. the SH would result in the SH sea ice having a greater albedo impact. However, with respect to the actual change we’ve seen in NH vs. SH sea ice, the Arctic change has been so much larger that the total sea ice albedo has definitely declined.
One thing I would like to see clarified, is where sea ice comes from at both poles.
I understand that a lot of it is obviously just sea water freezing, but given that Antartic sea ice is surrounding a large continent, is it possible that a lot of Antarctic sea ice is glacial outflows from the continent. If this is the case, then surely an increase in sea ice may indicate that glacial outflows have increased – which would not be a good thing.
Could someone help out with this one please – how much of sea ice at both poles is frozen seawater, and how much is glacial outflows, and what the implications of this are.
Thanks
At both poles most is frozen seawater and some small fraction is bergy bits from tidewater glacier snouts. It is the case that Pine Island glacier in particular seems to be melting back but the additional ice volume doesn’t explain the secular trend in Antarctic sea ice extent. Increases in the circumpolar wind does as, aided by the Coriolis effect, it tends to push the sea ice northwards.
The fastest flowing glaciers flow at about 30m/day (and most flow much slower than this). An outflow of 30m/day = 11km/year. Even assuming this occurred all around Antarctica, it’s still a very small fraction of the sea ice which currently extends 500+km from the Antarctic coast.
David, its not 2 meter high ice pushing into the ocean, and also mega ice shelf breaks become huge ice islands encouraging sea ice formation, of course they also fall apart. Having data on Antarctic yearly calving would be great!
“If this is the case, then surely an increase in sea ice may indicate that glacial outflows have increased..”
Let’s suppose this is true for a moment.
Why have glacial outflows increased? Glacial outflows would have increased because of warming.
What else will this warming have done? It will have melted sea-ice.
So in order to produce an increase in sea-ice overall, the glacial outflow would have to be greater than the reduction in sea-ice that the warming would otherwise have caused. This seems to be a very high bar for glacial outflow to meet.
We’ve seen with the Arctic that the winds can produce large yearly variations in sea-ice extent. It is far more plausible that there is some systematic mechanism – eg the reduction in Antarctic ozone – that is causing a circulation change, that is leading to the ice being more spread out.
If we had good thickness observations for Antarctic sea ice then this would help to provide evidence for one explanation over the other, but I don’t think we do – yet.
In a hat-tip to Rabett run (http://rabett.blogspot.com/2010/09/taking-it-to-new-level.html), Manabe et al 1991 (http://journals.ametsoc.org/doi/pdf/10.1175/1520-0442%281991%29004%3C0785%3ATROACO%3E2.0.CO%3B2 and http://journals.ametsoc.org/doi/pdf/10.1175/1520-0442%281992%29005%3C0105%3ATROACO%3E2.0.CO%3B2) discussed the sea-ice effect.
Eventually, of course, continued warming will overwhelm this response. But increased Antarctic sea ice is a small negative feedback to warming, _not_ a positive feedback to some imagined cooling, or a balance to the Arctic melt.
I linked to a paper that describe the formation of sea ice in the Ross Sea, which is, i believe, a region with very fast growth of sea ice. What they are describing is a wind-driven, sea-ice factory. Winds force the sea ice away from the coast line. Open water results. It freezes. The winds blow it away from the coast line. Open water results. It freezes. The spaces of open water right on the coast line, polynyas, are not as persistently formed in other areas, and the formation of ice area is less. Maybe I misunderstood.
JCH , it would be novel, rather unbelievable in the Arctic to have similar sea ice moving away then causing a continuous gap mechanism to extend fast ice ice further in such a process. Usually sea ice freezes causes a polynya beach layer, often building rafting or rubble on its shore then the polynya freezes to form further down wind or especially where the current goes. I think the few penguins film I’ve seen suggested that they have to travel further and further away to find open water as winter progresses.. If you look at sea ice animations as per CT, you wont see such “Ross sea” like process. There must be a sea current or wind moving the broken up Ross ice shelves Northwards, if so its possible, huge icebergs may move through almost any ice thickness, but they have to be really big and especially not beset on sea bottom.
Wayne, I found this description in a paper about Penquins:
Important components of the Ross Sea ecosystems are several polynyas (Jacobs & Comiso 1989, Arrigo et al. 1998). These are areas of persistently open water or loose pack ice within the larger region covered by sea ice. Two of them, the large Ross Sea polynya (along the front of the Ross Ice Shelf) and the Terra Nova Bay polynya (off middle Victoria Land), are the latent-heat type formed in response to persistent, strong
winds and the heat generated by the continual freezing of sea water (the newly-formed ice being continually swept away). The other two are sensible-heat polynyas formed by the upwelling of warm CDW at the shelfbreak. The largest of these, the Ross Passage Polynya, is just off Cape Adare, Victoria Land; the other is at the northern end of Pennell
Bank (Figs 1, 3). …
I think what is being described in the paper in the following link is unique to Antarctica, and a reasonable explanation for part of the difference in ice extent behavior between the poles.
…[37] Figure 13 shows on the left‐hand scale, the annual
polynya ice productivity in km3 for the RSP, which is by far
the dominant Ross Sea polynya. As described in the work of
Martin et al. [2007], Figure13alsotakesintoaccounttheeffect of icebergs B15
These days there is more water vapor in the air, so snow is more of a factor also. See for example: http://www.elic.ucl.ac.be/users/thierry/articles/1999_Fichefet_Morales_ClimDyn.pdf
Mandas,
http://www.antarctica.gov.au/media/news/2012/latest-southern-ocean-research-shows-continuing-deep-ocean-change.
Suggestive that the Antarctic Sea Ice is refreeze of fresh water either from sea ice melt or glacial melt. Either way the surface salinity should also be affected, in a similar way to the Arctic fresh water bulge. There is data but I am not so sure how to interpret it.
Great link, rbd–though not all that cheery, aside from the “feel-good” aspect of using Mawson’s 1912 measurements.
This just might be worth pointing comment stream types toward:
Click to access 25-3_maksym.pdf
Justin Gillis mentions it in his Goddard-slamming piece on Antarctica in the NYT:
http://green.blogs.nytimes.com/2012/10/03/running-the-numbers-on-antarctic-sea-ice/
Thanks JCH , Nice to learn about Antarctica Polynyas, the well known persistent ones in the Arctic have very similar reasons that create them.
DSL, http://earthobservatory.nasa.gov/Features/WorldOfChange/sea_ice_south.php
This NASA Antarctic animation is great As I wrote often before, the sea ice Maximum is of very little interest without volume. The minima seasons portrayed show what I thought, sea ice persisted near the very large or big ice shelves. Ice begets ice and also protects its neighbors. This animation strongly suggests the effects of calving.
And of course Dave Burton is all but absent from this discussion. Could it possibly be due to the inclusion of real analysis, proper maths and real facts in the “debate”? One can only speculate…
Are you complaining, then?
;-)
In my opinion? The one and only question is: “What are the risks, impacts, effects, and time frame for AGW?” As we grade their submittals, DB must be flunked. However, remember what AR4 said about sea ice. How do we grade that?
In my world, getting the correct answer is the one and only mark of an expert. The wrong answer published in Science or Nature, or a IPCC working group report is still the wrong answer.
On a global topic, where billions of lives are at stake, there is no partial credit.
Aaron, Sometimes we learn more by being wrong than we do by being right. What matters is getting things right eventually and soon enough to make a difference.
Scientists have gotten the climate change issue right for 30 years and been ignored by their fellow humans. That they do not get everything right is understandable when dealing with a complicated system. In fact, I would contend it is irresponsible to expect perfection from science.
If you are grading people, you generally ask more than one question..
If we want to know who has more expertise, perhaps we should take a sample of 20 claims and/or predictions from a ‘skeptic’ source and, perhaps, the IPCC (determining the source would itself be a matter of debate). Then see who gets the most correct.
Thank you for this post, Tamino. I never really understood why some people seem to think that the minor increase (less than 1 % over the past few decades) in Antarctic sea ice during winter (when it is pitch dark out there, so albedo change has no effect) would somehow “compensate” for the loss of Arctic sea ice (close to 50 % over the past few decades) in summer, when the sun is high in the sky, with albedo effect thus making a big difference on how much heat this planet absorbs on an annual basis.
A significant reduction in “sea ice insolation” in the Arctic, and thus a reduction of surface albedo, makes sense considering the steep decline in Arctic sea ice over the past few decades (and specifically over the past decade).
But I found it interesting that you did find an increase in “sea ice insolation” in the Antarctic though.
Does this mean that Antarctic summer sea ice minimum (in summer, when albedo effect matters most) shows an increase ?
[Response: Bear in mind that the maxima and minima don’t happen at midsummer or midwinter — they happen around the beginning of spring and fall.]
There may be a serious error in your calculations (as well as those of Hudson). Your calculations are based on TOA insolation and albedo. Unfortunately, all the solar radiation not reflected by clouds does not reach the surface of the Arctic Ocean, where it can be reflect or absorbed by water or sea ice. In the standard KT energy balance diagram, average insolation is 342 W/m2 and 77 W/m2 is reflected by clouds, leaving 265 W/m2. Your TOA analysis ignores the 67 W/m2 of this 265 W/m2 that is absorbed by the atmosphere, leaving 198 W/m2 to reach the surface, where an average of 30 is reflected.
Unfortunately, the atmosphere over the Arctic Ocean is not typical of the average location on Earth. Light passes through it at a much shallower angle, which produces a longer path for absorption and scattering. In this situation, one should rely on observed surface insolation in the Arctic rather than calculations. Monthly insolation data from drift and stationary stations in the Arctic can be found at http://neespi.org/web-content/meetings/EGU_2012/Rusina-poster.pdf: 236 W/m2 in July, 140 W/m2 in Aug and 47 W/m2 in Sept. These numbers properly account for the SWR reflected by clouds AND absorbed by clouds and the atmosphere (which you missed). In Sept, when recent loss of sea ice has been at its greatest, observations show only 47 W/m2 reaching the surface and only about 10 W/m2 more energy would be absorbed by water than sea ice. Your graph of TOA insolation doesn’t have a legend, but it makes sense to assume the first month with zero insolation at 90 degN is October. If so, TOA insolation in September averages 250 W/m2 and you would calculate an ocean/sea ice difference of 50 W/m2.
[Response: To account for these effects is precisely why Hudson used TOA albedo figures (and is how TOA albedo is defined). Also, the insolation calculation done here accounts for the very small incoming solar energy during September. It’s the decreasing trend of Arctic sea ice during May-June-July-August which dominates the change in Arctic insolation.
I’m afraid you’re the one who’s mistaken.]
There is some data to back up Tamino’s calculations:
In the conclusion they state:
Using more than five years of ERBE all-sky TOA albedo
monthly data from the 2.5° × 2.5° grid over the polar oceans
and NH land, we found that when sea-ice or land-snow cover
varies from 0% to 100%, the TOA albedo changes by about
0.2 with small seasonal changes.
The effects of sea‐ice and land‐snow concentrations
on planetary albedo from the earth radiation budget
experiment
As I pointed out, TOA numbers ignore absorption of SWR by the atmosphere and clouds.
[Response: No they don’t. TOA albedo is defined as the fraction of incoming solar SWR which is returned to space. That which is absorbed by the atmosphere and clouds isn’t returned to space. You are simply mistaken.]
SWR that is not reflected by clouds can be absorbed on its way to the surface. At average locations, about 1/4 is absorbed, but the poles are not average locations. TOA albedo can be measured from space, but those measurements don’t tell us whether reflected SWR comes from clouds and particles in the atmosphere or water or ice on the surface.
You appear to be standing by your calculated values even when they disagree with observations and a mechanism producing the discrepancy appears obvious. Please reconsider.
[Response: My calculation doesn’t involve surface reflectance specifically, in fact it doesn’t involve albedo at all (however it’s defined). It computes the amount of solar energy striking the top of the atmosphere, and computes the amount which hits the atmosphere above sea-ice covered area. It’s as simple as that. You are the one who needs to reconsider.]
On a percentage basis, sea ice extent in the Arctic is down only modestly (<10%) in all months except Jul-Aug-Sep. In May 2012, for example, the skeptics were crowing about average sea ice extent. The largest percentage change occurs in September (almost 50% below average in 2012), which is why I focused on that month. Unfortunately, the amount of SWR OBSERVED reaching the surface that late in the summer is so small that it makes little difference (averaged over the globe) whether it lands on sea ice or water.
[Response: As I said before, the change in sea ice insolation is dominated by May-June-July-August precisely because that’s when incoming solar energy is largest. That’s why I did this calculation. The impact of September sea ice is indeed dramatically reduced by the low incoming solar energy, but it’s the decreasing trend in sea ice during summer months which drives this calculation, and it is quite substantial.
Your argument about “on a percentage basis” is utterly irrelevant. What counts for climate forcing is the actual area, not the percentage. The trend in Arctic sea ice is down 1 million km^2 in May, 1.5 million in June, 2.4 million in July, and 2.6 million in August. These trends are quite large, during precisely the months when incoming solar energy is at its greatest, and it is these months which dominate the calculation of sea ice insolation.
You are just plain mistaken.]
Great analysis. Some of the comments mention the albedo effects of decreasing snow cover. I don’t know if you’ve seen this paper, but it does combined ice/snow through 2008:
http://www.nature.com/ngeo/journal/v4/n3/full/ngeo1062.html
And here’s a link to a talk on the same paper that’s not behind a firewall:
Click to access Flanner_B11.pdf
They find about 0.45 W/m2 (possibly considerably higher) for the combined effect — but note that their data only go through 2008, so they’re not including the big ice and snow* losses for the last four years. I suspect we’re well about 0.6 W/m2 these days.
*For snow data, look here:
http://climate.rutgers.edu/snowcover/chart_anom.php?ui_set=1&ui_region=nhland&ui_month=6
Look at the sunny months May, June, July, and August, in particular.
Note that the link I give above (to Flanner et al. 2011) finds the 1979-2008 change in sea ice forcing to be +0.22 (0.15 — 0.32) W/m2, so Tamino’s calculation is in the ballpark, but conservative (at least by this measure).
I agree that the area of sea ice loss is the relevant parameter, not the percentage. However, both the absolute area reduction and the irrelevant percentage are small in the late spring. There is plenty of solar radiation in the late spring, but there has been little change then to the surface it strikes. High radiation and significant surface change make July and August the key months. Measurements demonstrate that the amount of radiation arriving at the surface in September is too small to produce a significant effect.
BDO wrote: As I pointed out, TOA numbers ignore absorption of SWR by the atmosphere and clouds.
Tamino responded: [Response: No they don’t. TOA albedo is defined as the fraction of incoming solar SWR which is returned to space. That which is absorbed by the atmosphere and clouds isn’t returned to space. The absorbed radiation never reaches the surface You are simply mistaken.]
BDO returns: Your facts are right, but your conclusion is wrong. Only radiation that arrives at the surface can be absorbed or reflected by sea ice or water. The most unambiguous method for determining the effect of changing sea ice is to measure how much radiation arrives at the surface and measure the albedo for each surface. I provided you with a publication data showing how much radiation reaches the surface each month. The albedo change could be as small as 20%, if “open water” is replacing ice covered with old melt ponds. Unfortunately, no one may know what albedo change is usually associated with >15% sea ice becoming <15% sea ice.
The TOA approach is flawed because albedo alone doesn't determine how much SWR arrives at the surface. Imagine cloud cover that keeps 80% of SWR from reaching the surface of the Arctic by reflecting 40% and absorbing 40%. The TOA approach would assume that 60% of the radiation reaches the surface, but measurement would show only 20%. There may be situations where TOA albedo provides a reasonable approximation, but September in the Arctic is not one of those situations.
[Response: You are still, quite simply, wrong.
TOA albedo is defined as the fraction of incoming SWR which is returned to space as SWR. It therefore excludes energy which is absorbed anywhere — be it ocean, ice surface, or *atmosphere*.]
The paper linked above by John Cartmill is very relevant and illuminates the method used in this post.
The authors of the paper calculate what they call “radiative effectiveness” (RE) for NH sea ice in two ways (yielding a result of about 0.2 from March through Sept (with the actual values being 0.19, 0.23, 0.25, 0.23, 0.17, 0,20, 0.20 ) . RE is the difference between TOA albedos that has been used in this post and the value “0.2” used above is very close to (same when rounded to one significant figure) as the RE’s for NH and SH sea ice arrived at by the authors of the paper.
It’s worth noting that NH sea ice and NH land snow have essentially the same RE (about 0.2)
BDO wrote and Tamino made no response to the following passage:
“Only radiation that arrives at the surface can be absorbed or reflected by sea ice or water. The most unambiguous method for determining the effect of changing sea ice is to measure how much radiation arrives at the surface and measure the albedo for each surface.” Will this method give the correct answer?
When describing his calculation, Tamino writes:
“Then I computed, for each day, the sun’s declination (its altitude above or below the celestial equator). I also computed the earth-sun distance so I could apply that correction to the solar insolation. This enabled me to compute the total amount of solar radiation hitting parts of the earth which are covered by sea ice, which I call “sea ice insolation“.”
Insolation is the amount of radiant energy arriving at a surface. Unfortunately, Tamino has calculated the TOA insolation above regions covered by sea ice, not the true sea ice insolation. (An unfortunate mistake in a post titled sea ice insolation.) Some of the TOA insolation is absorbed, especially by clouds, on its way down to the sea ice.
[Response: It’s a pity that you’re so intent on not admitting you’re wrong, that you’ll pick nits. Yes the use of the word “insolation” was incorrect terminology. What I was computing was TOA solar power over ice-covered regions. That was clear to absolutely everybody but you. Maybe it was even clear to you but you’re desperately clinging to the myth that you might not be wrong. And, it is the relevant calculation for this.]
Later Tamino writes:
“So even if the difference between ice and ocean albedo were equal to 1 in the southern hemisphere …”
These appear to be surface albedos.
[Response: They are hypothetical choices, and clearly impossible ones (because of things like atmospheric absorption), given only to illustrate how limited is the albedo impact of southern hemisphere sea ice growth.]
Later, Tamino begins to specify “TOA albedo” and makes an inspired guess that the difference in TOA albedo between sea ice and water might be 0.2.
[Response: It’s not an “inspired guess.” It’s an estimate based on study of the albedo graph from Hudson (reproduced in this post).]
Since TOA albedo is measured from space, “sea ice TOA albedo” doesn’t depend ONLY on whether solar radiation is absorbed or reflected by sea ice; reflection by clouds increases “sea ice TOA albedo” and absorption and reflection by clouds and the atmosphere decreases that portion of sea ice albedo actually originating from the sea ice.
[Response: That’s why Hudson’s figure shows separate curves for different land conditions under both open sky, and cloudy sky. The same effects apply to open ocean areas. The relevant quantity is the *difference* in TOA albedo between ice-covered and open-ocean areas. Which is exactly what I used.]
Therefore, when you calculate the sea ice albedo feedback, you are really calculating sea ice albedo feedback combined with whatever cloud changes occur as sea ice melts. After taking clouds into account, Hudson says: “These results show that a strong sea-ice-CLOUD feedback could greatly enhance or completely overwhelm the global effect of the [sea ice albedo feedback].”
[Response: Yes it could. But it hasn’t yet. This calculation is only what has happened, not what “might” happen. Everybody understood this perfectly, except possibly you.]
So, my original points were basically correct: 1) You have miscalculated “sea ice insolation”, explaining why the observed values I cited differ from yours. 2) The TOA approach is complicated by the absorption of solar radiation on its way to and from the surface, mostly by clouds. The feedback you ascribe to loss of sea ice is convoluted with cloud feedback. Cloud anomalies could cause sea ice anomalies or sea ice anomalies could cause cloud anomalies.
[Response: 1) I didn’t miscalculate anything, I simply mis-named the calculation. Everybody got that but you. 2) Yes it’s complicated, but I didn’t do that calculation at all, Hudson did and I used his result (approximated from his graph).
Your original gross error (involving the basic concept rather than mere misuse of terminology) was a simple mistake. But your obstinate refusal to admit your error, and this truly pathetic attempt to save face, embarrasses you beyond belief. It also taxes my patience.]
BDO said
Thank you for pointing out that further, earlier, reduction in Arctic sea ice into August and even July will have a much larger infuence on albedo feedback than similar reductions from the past decade in late August and September.
Also note Tamino’s latest post on snow cover anomalies :
which shows that snow cover reduction peaks in June, when the sun is brutal.
In other words, snow cover reduction is currently most significant for albedo feedback, and sea ice reduction is just getting warmed up, so to say. Sea ice has a lot of potential to become a lot more dominant in the future than it has been in the past.
and :
No, BDO, the TOA method that Tamino and Hudson used is not “flawed” and neither is the surface albedo method (which for example I used below for snow cover calculations).
It is simply a different way of calculating albedo effect.
As I pointed out below, “both your and my method are valid and should obtain approximately the same result”.
Now if you could just present YOUR results, then we would have something to talk about.
But in absense of that, it seems that you are just digging yourself a deeper and deeper hole without any indication that you have a scientific argument to add.
Bruce, thank you so much for bringing up the most important and most neglected part of albedo effect : snow cover.
Tamino’s method of determining heat absorbed by reducing ice cover could be replicated for snow cover, using the Rutger snow cover database, so we can quantify the relevance of snow cover versus ice cover.
Tamino did a very sophisticated analysis of ice cover, but in absense of the models he used, I took a first shot at snow cover anomaly, calculated for 2012, based on Rutgers data :
http://climate.rutgers.edu/snowcover/chart_anom.php?ui_set=1&ui_region=nhland&ui_month=6
A quick back-of-the-envelope calculation shows that during June 2012, the 6 million km^2 snow cover anomaly added about 1000 TW heating to the Northern Hemisphere. This uses the assumption of 280 W/m^2 on-the-ground insolation in June in the Arctic, and a 0.5 difference between a dark soil and snow cover. Both of these assumptions are reasonable I think.
For global forcing calculation : 1000 TW is almost 2 W/m^2 if spread out over the entire globe. Thus, June snow anomaly alone
added something like 0.15 W/m^2 global forcing if spread out over 12 months.
If we add the 4 million km^2 snow cover anomaly in May (causing about 0.1 W/m^2 global annualized forcing), and the 2.5 million km^2 snow cover anomaly in April and again in July (each adding about 0.05 W/m^2), snow cover anomaly in the Northern Hemisphere will have added something like 0.35 W/m^2 global annualized forcing.
This number seems to be reasonable compared to the Flanner et al number of about 0.22 W/m^2 until 2008, considering how much more snow cover was lost in June between 2008 and 2012.
Not just does the 2012 snow cover anomaly seem to cause a much larger forcing on the planet than ice cover anomaly, but the bulk of the heat absorbed by snow cover reduction is in the far north, and thus directly affects the amount of heat going into the early melting season, and thus into sea ice reduction.
So maybe the significant (1-3 sigma) underestimation of snow cover in the Nothern Hemisphere by CMIP5 models, as reported here :
http://www.agu.org/pubs/crossref/pip/2012GL053387.shtml
may explain the underestimation of sea ice in CMIP5 models as reported by Stroeve et al
http://www.agu.org/pubs/crossref/2012/2012GL052676.shtml
I think it is time to take a very close look at snow cover anomalies, and at snow modules in CMIP5 models, and figure out why models and reality differ so much (2-3 sigmas).
[Response: I doubt the *effective* albedo difference between snow and bare land is as large as 0.5. Remember you have to use TOA albedo. Even if snow were perfectly reflective (albedo = 1), not all incoming solar reaches the ground to be reflected, some is absorbed by the atmosphere, so the TOA albedo is less than 1. And, any cloud cover makes for a high albedo even when striking areas not covered by snow; although cloud-over-snow will still have higher TOA albedo than cloud-over-land, the difference isn’t as great as 0.5. Hence for a good estimate, you even have to know roughly the average amount of cloud cover. Just my guess, I’d think that 0.2 is probably closer to the effective albedo difference than 0.5.]
“…but the bulk of the heat absorbed by snow cover reduction is in the far north, and thus directly affects the amount of heat going into the early melting season, and thus into sea ice reduction.”
Exactly. But it’s not just sea ice reduction, it’s a positive feedback in the whole arctic amplification process, including — importantly — the melting of permafrost and the concomitant release of CO2 and CH4. Which, of course, has the potential for major amplification worldwide.
And then there’s all that extra heat hanging around in the arctic just looking for something to warm up. Hey, look! Greenland…
Tamino: Flanner et al use a variety of models to account for cloud cover (and pick ones, in the way of scientists everywhere, that lead to conservative results).
Tamino said :
Please note that I used a slightly different method than you did.
You calculated TOA radiation, so you need to use TOA albedo to figure out the difference in heat absorption.
I used insolation ON THE GROUND similar to the numbers you would use to calculate PV panel energy production.
So, I can use actual albedo difference on the ground (which is independent of cloud cover) to calculate the difference between presence and absence of snow.
In other words, ‘cloud cover’ in your case is present in the TOA albedo number, while in my case it in the surface insolation number.
TOA albedo is hard to determine by observation, and is also not constant over time (since there are typically fewer clouds in spring than in (late) summer). So I think that taking insolation-on-the-ground observations should generally obtain a more accurate result that is also easier to calculate.
I used the “PV-potential” data set from Natural Resources Canada data which shows 260-280 W/m^2 on the ground in June in the area where snow cover anomalies occur.
That data is probably more accurate than estimating the TOA albedo from a model, right ?
Actually, if we had world-wide insolation maps, we could combine them with ice/snow cover (anomaly) maps, and obtain a much more accurate number of heat absorption due to sea ice or snow cover anomaly.
Does NCEP/NCAR have insolation data ? I seem unable to find it…
Either way, both your and my method are valid and should obtain approximately the same result. Would be good if you could verify (or prove wrong) my 0.35 W/m^2 forcing number for the 2012 NH snow cover anomaly using your method…
Is there any chance you could do your calculations for snow cover ?
Rutgers has the snow cover (anomaly) maps for each month…
Tamino,
Thanks for you follow-up post on snow cover :
If you have some time, can you please see if you could calculate snow cover forcing using the same method you used fo ice cover forcing in this post ?
Dr Trenberth in his 2009 paper …’Tracking the Earth’s global energy” calculates that the global warming heat gain for the planet is 145E20 Joules/year. This is equal to 0.9W/m2 warming imbalance for the whole surface of the planet.
Trenberth’s Table 1 shows heat absorbed in melting Arctic sea ice is 1E20 J/yr and ice sheets (Greenland and Antarctica) is 1.4E20 J/yr; roughly half of which is Greenland. So the total energy budget for Arctic sea ice + Greenland is 1 + 0.7 = 1.7E20 J/yr.
This is 1.7/145 or 1.1% of the budget for global warming of the entire planet; or equal to 0.01W/m2 for the Earth’s surface.
How does this compute with your statement that ‘the global forcing from Arctic sea ice changes would be about 0.13W/m^2’? Your number is 13 times higher.
[Response: Hypothetical situation: the Denver Broncos take in an extra $39 million in ticket sales and other revenue because Peyton Manning is their new quarterback. But they’re only paying him $3 million in salary this year.
How does this compute with the statement that “the revenue gain from hiring Peyton Manning would be about $39 million?” That number is 13 times higher.
The answer is: So what?]
The issue of concern isn’t the energy required to melt the ice and snow – that’s really a one-time energy value.
The real issue is the albedo change from those melts, the added energy that will be accumulated year after year – increasing the energy imbalance between incoming and outgoing that leads to global warming, with a heavy emphasis on polar amplification. Those are the forcing changes, not the melt energy.
You are confusing two very different numbers, with very different implications. I would strongly suggest looking at the issue again, as your post quite incorrectly conflates melt (one time) with ongoing incoming energy (year after year).
Well and succinctly stated, IMO.
An analogy, it costs a one time expenditure of $x to paint the roof of one’s house white but the AC costs are reduced by $y every day.
I just found out that NCEP/NCAR actually does have downward solar radiation flux data (daily), available here :
http://www.esrl.noaa.gov/psd/cgi-bin/DataAccess.pl?DB_dataset=NCEP+Reanalysis+Surface+Flux&DB_variable=Downward+Solar+Radiation+Flux&DB_statistic=Mean&DB_tid=35273&DB_did=4&DB_vid=1235
That means that in pinciple, we should be able to calculate quite accurately not just how much extra heat was absorbed by ice loss (and snow cover loss), but also when and where that heat was absorbed.
NOAA rocks !
Tamino,
To take your analogy, you must explain what happened to the $36 million left after paying Mr Manning $3 million.
[Response: Bullshit.]
The Earth system (unlike a football team) has to balance the books.
In fact the $36 million went on expenses like sending energy back out to space.
Your global forcing of 0.13W/m2 is in fact your claimed extra incoming energy flux of which 0.01W/m2 is the actual net Arctic + Greenland ice melt leaving 0.12W/m2 as outgoing energy flux.
[Response: Bullshit. It certainly increased ocean heat content, and how much went into the deep ocean we don’t know. Nor is this an accounting of all the other fluxes, in or out.]
Why do you talk about the 0.13 incoming
[Response: Because that’s the topic of this post.]
and not the 0.12 outgoing?
[Response: Outgoing? I doubt it.]
‘crit massa’ : You are comparing apples and oranges, as Tamino (rather harshly) tried to explain.
Still, to answer your question (“show us where the 0.12W/m2 has gone”) more directly, let’s see if we can track down where the whole 0.13 W/m^2 forcing (20*10^20 J) for albedo effect due to Arctic ice loss, and how that compares to Trenberth’s 1*10^20 J.
For starters, remember that this heat is inserted over a small area (of 1-2 M km^2) during a small amount of time (the melting season).
Local peak heat influx due to albedo change is of the order of 100 W/m^2 when open ocean replaces ice cover in July and a bit less in August. Either way, even Stefan Boltzman would confirm that only a small percentage of that heat would radiate to space right there and then. So the heat went elsewhere (not to space), at least initially.
How large is the fraction that makes it to melting sea ice ?
For that, let’s look at ice volume numbers. The best we have is PIOMAS, which is a model validated by observations.
Here is PIOMAS data presented in a graph, which reveals a lot of what happens :
http://neven1.typepad.com/.a/6a0133f03a1e37970b017d3c780730970c-pi
When you look at the gray graph (the 1979-2001 average volume developments over a one-year period), note that ice volume used to drop about 16,000 Gton (from 30k->14k) during the melting season, which would then freeze back again during the freezing season.
When you then look at the graphs from 2002-2012, you’ll notice that the amplitude of the graph increased to a seasonal melt of some 19,000 Gton. So apparently over the past decade, an additional 3000 Gton melts out. That’s approximately 10*10^20, or HALF of the 0.13 W/m^2 albedo change forcing.
Luckily, due to more open ocean and thinner ice cover, ice grows faster during the freeze season (this is a negative feedback factor), so much of that 3000 Gton lost in summer will freeze on again in winter. But not all !
The same PIOMAS graph suggests that over the past decade, some 800 Gton is lost every year. So an extra 3000 Gton melts away, but only an extra 2200 Gton is added during winter.
This 800 Gton annual loss over the past decade represents 2.6*10^20 J, or a forcing of 0.016 W/m^2.
That number from PIOMAS suggests that Trenberth underestimated volume loss in the Arctic. Trenberth acknowledges that “thickness and volume are quite uncertain” and seemed to have come to his 1*10^20 J number with a simple back-of-the-envelope calculation (rather than using PIOMAS or another volume model).
Either way, your “show us where the 0.12W/m2 has gone”, the volume numbers suggest that it is very well possible that a significant portion of that heat made it to melting ice in the same season. The remainder will have warmed Arctic ocean water, which will in turn have caused atmospheric warming anomaly (meaning warmer summers) at lower latitudes.
Does that help ?
One final note : The still continuing 800 Gton annual loss suggests that increased heat influx and positive feedbacks (such as albedo effect quantified here) is still stronger than the negative feedback of increase rate of volume gain during freezing season.
If there is no stronger negative feedback mechanism emerging, once we are without summer sea ice, that heat will find another piece of ice to melt 800 Gton/year from.
And that may cause a lot more problems than Arctic sea ice loss itself.
We should consider ourselves VERY lucky that there is still ice left over in summer in the Arctic.
Tamino,
Rather than expletives – show us where the 0.12W/m2 has gone.
[edit[
[Response: This post isn’t about the global net energy imbalance. Feel free to make demands about what appears on your own blog. Not mine. Screw you.]
‘crit massa’
Regarding your question “show us where the 0.12W/m2 has gone”, please note my response above, which explains why you are comparing apples and oranges.
But besides that, please note Figure 3 in Hudson 2010 :
Click to access Hudson11_AlbedoFeedback.pdf
which shows that albedo ice effect until 2008 was increasing at a rate of about 0.1 W/m^2 per decade.
Since CO2 forcing increases at a rate of about 0.25 W/m^2/decade (2 ppm/year with 3.7 W/m^2 forcing for a doubling from pre-industrial 280 ppm), it seems that albedo effect due to Arctic sea ice loss is currently close to HALF of CO2 forcing.
And note that this does not include the 2012 mega-melt and its additional forcing, nor accounting for the spectacular decline in snow cover over the past decade
which (at 0.35 W/m^2 annualized globally over the past decade) could easily could top CO2 forcing numbers over the same period.
If you have some negative feedback effects to contribute, please do so now. Because without that, it seems that the Arctic snow/ice albedo effect over the past decade is even stronger than the GHG forcing that created it in the first place.
Meanwhile, it is interesting to note that, deep into October, Arctice sea ice extent has just gone above the previous all time low of 2007. That was a record low far below any other in the satellite record, which happened with a perfect storm of melting conditions a mere 5 years ago, but only to be shattered weeks ahead of schedule last summer. Even the most rabid fake skeptics can’t seem to muster their usual “it’s refreezing really fast” B.S.
Any drop in anomaly caused by retarded refreezing will show up over the next couple of weeks. The water surrounding the ice is warmer than normal, but not by much. But the area anomaly is still very, very low already.
The fake sceptics will save their misinformation for further into the refreeze, like they always do.