
Over at WUWT someone posted a comment on Bob Tisdale’s post (see my post about that) drawing attention to my removal of the influences of el Niño, volcanic aerosols, and solar fluctuations from the temperature record. This didn’t sit well with some of their readers, particularly someone using the moniker “Javier,” who had this to say:
Javier
October 14, 2016 at 6:20 pm“Tamino has removed ENSO, volcanoes, and solar from satellite data and from surface data.”
Or so he claims, but since we are not capable of attributing warming to specific causes properly, what he has done is construct a fantasy that has no relationship with reality, where he can then draw his fantasy conclusions. Anything goes by the name of science these days. Some of these people should be working for the entertainment industry.
Well, I suppose sometimes ad hominem and “argument by assertion” can’t be avoided, but you should include at least some actual reasoning along with that, don’t you think?
What struck me, though, is an earlier comment by this same “Javier”:
Javier
October 14, 2016 at 7:00 amDo your homework. The trend is always determined by the choice of starting point and ending point. That is usually called cherry picking if you want to make a point with the trend of your choice.
His comment is directly, and very ironically, relevant to a post by “Javier” himself.
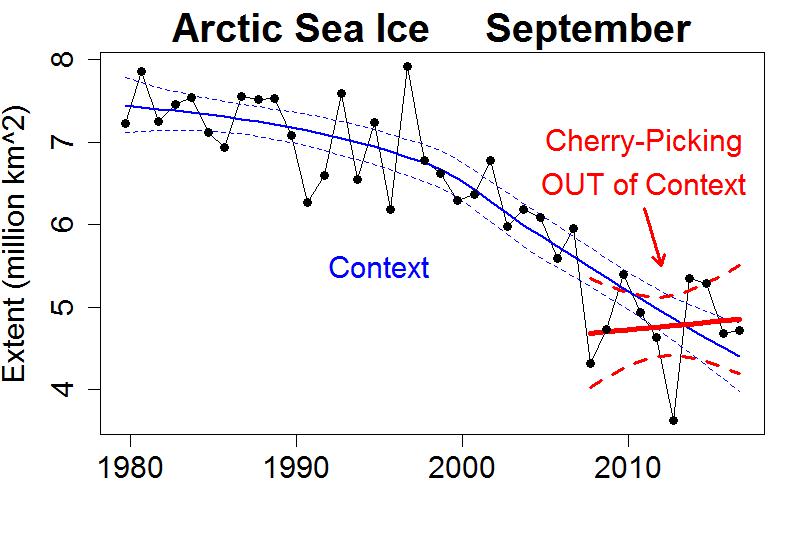
In that post, Javier suggests that Arctic sea ice has “turned the corner” (meaning, ceased its decline) based on … wait for it … this graph:

Evidently Javier was unhappy about NSIDC using daily data on sea ice extent to show that this year had the 2nd-lowest annual minimum on record. So, he decided to go with the September monthly averages for each year, and to start with 2007 to show a “trend” which, he says, shows “that Arctic sea ice has been increasing since that fateful September of 2007.”
Gosh, Javier, what was that you were saying about “The trend is always determined by the choice of starting point and ending point“? Didn’t you “Do your homework“?
Of course the trend isn’t determined by the choice of start and end points, but it’s strongly influenced by it. That’s especially true if you start (or end) with an extreme, which I discussed here. And that’s exactly what Javier has done: start, not just with the most extreme September average in the record, but one so extreme he himself refers to it as “fateful.”
Javier has also resorted to another denier favorite: computing a “trend” based on a time span that’s way to short. Way too short. Ten years, from 2007 to 2016. And, in classic fashion, he omits to estimate any uncertainty with that “trend.”
Let’s do the math for him.
Using September average sea ice extent from NSIDC, and using only the data from 2007 through 2016, the estimated trend by linear regression is +18 thousand km^2 per year. Upward!!! But, the “margin of error” (95% confidence interval) for that figure is somewhere between +142 thousand km^2/yr and -105 thousand km^2/yr. Downward :(
Apparently that’s the best he could do, despite cherry-picking an extreme starting point. Of course he follows this keen trend analysis with what I can only call “mathturbation” to support a claim of trend change … and rather crude mathturbation, in my opinion.
Remember the zombie comment about “context”? Let’s put Javier’s choice in some context, using just the September averages (like he did) but not waiting until 2007 to start:
In my opinion, we’ll get even better context if we use annual average sea ice extent rather than just the September average. I’ll average extent anomaly values October-through-September so the most recent year is a complete one:

Two things are worth noting. First, the average over the previous 12 months is right in line with the trend (the downward trend). Second, this most recent October-through-September average is the lowest.
We can’t know with certainty how long the trend will continue downward, or how low it will get, except for the fact that it can’t really go below zero. But for many readers of WUWT there’s nothing to worry about, because they have it on the authority of “Javier” that it may have “turned the corner.” Do you feel reassured?
This blog is made possible by readers like you; join others by donating at Peaseblossom’s Closet.


Do I feel reassured? Only that the perversity of human nature is consistent. And I wasn’t actually worried that we’d suddenly taken a collective turn toward sweet reason.
“We can’t know with certainty how long the trend will continue downward, or how low it will get, except for the fact that it can’t really go below zero.”
I can’t see it getting close to zero, at least not in this century or probably the next. Regardless of the various positive feedbacks, just how warm and stormy would the Arctic Ocean have to get to prevent sea ice forming in the winter at high latitudes, or to prevent a stable thermohalocline from forming?
That said, I’m in my 50s and fully expect to see an ice-free summer Arctic Ocean in my lifetime, and probably while I’m still in my 60s.
Talking about arctic sea ice, according to NSIDC the current sea ice level is right at the 2012 level.
http://nsidc.org/arcticseaicenews/
The idea that sea ice could be ‘recovering’, in a region of the world that’s warming at the rate of 1°C every 20 years, is just laughable. No-one actually believes this arrant nonsense, least of all the people who make such claims. The sole purpose of denial is, as always, to reject any and all responsibility for the consequences of our actions, for as long as possible.
“Or so he claims, but since we are not capable of attributing warming to specific causes properly, what he has done is construct a fantasy that has no relationship with reality, where he can then draw his fantasy conclusions.”
Essentially, what Javier is claiming is he doesn’t buy (and, so, we shouldn’t buy) the additivity of these effects. In doing so, he implies that they are highly coupled and, so, non-linear to boot. That’s a pretty strong constraint and claim. As such:
(1) He needs to demonstrate, using historical observations, that this is the case. This is not that difficult. If, say, volcanoes were coupled deeply with the climate, there should be evidence of such coupling, in the form of a long decay of some kind after an impulse. Mt Pinatubo in the 1990s should suffice.
(2) He needs to argue, theoretically, how such a coupling happens. If the forcings are deeply coupled into parts of the climate system, that means those parts need to “talk to” one another, rather like the teleconnections that meteorologists talk about. The thing about teleconnections, for example, is that their contribution and magnitude is quantified. Accordingly, the question Javier needs to answer is that if the climate is so fundamentally interconnected in the manner Javier says, why don’t we see evidence of it at this level?
I understand that this may be giving Javier more due than Javier deserves. I don’t know what else Javier claimed at WUWT and such places. (I won’t go there and participate, on principle. I do invite any of them to come to my own blog, http://667-per-cm.net, with their claims and we can discuss it there.) On the other hand, I often find it instructive for an audience to be systematic about such claims, and challenge them in the same manner one would any proposition. I don’t expect to convince people like Javier, but it is useful, I think, for readers to see it.
There’s a new article in the NYTimes (which as verified commenter with interest in the subject I was bound to see) that promotes Cliff Mass. On the whole, it’s not bad, but my skills are not up to spotting if there is inappropriate bias in the actual article. The author is a former student and clearly an admirer of Cliff Mass. I’d like to see someone with more expertise than mine weigh in. I’d guess comments will be closed in the next 24 hours or less, but thought it worth mentioning here. Here’s a link to my response (you can close the comments to see the article).
“Why Isn’t the U.S. Better at Predicting Extreme Weather?”
Magazine means it will likely be in Sunday’s print edition. Perhaps someone with the skills can write a letter to the editor:
I think Mass’s criticisms of the NOAA’s dated and under-resourced hurricane modeling can be separated from his often contrarian positions on AGW. Ultimately the blame lies, as was pointed out by many of the NYT commenters, on the largely Republican-led long-term starvation of government programs (with the partial exception of the military and intelligence agencies).
Thanks Magma, I am convinced that you and I are in large agreement. In this case, I read as carefully as I could, and felt he made a good argument. I am familiar with the issues with Cliff Mass and climate change, and also the highest respect for his meteorological expertise.
I am troubled that this kind of argument is used by third parties to advocate against the work that NOAA does; we are all familiar with the machinations of Rep. Lamar Smith and the nonsense of Sen. Cruz. It worries me that this kind of argument is used to defund the best expertise and the best work on the problems that we all face as the problem grow.
A pretty good view on Arctic (and Antarctic) sea ice is given by Nick Stokes’ moyhu website:
https://s3-us-west-1.amazonaws.com/www.moyhu.org/blog/polview.html
Arctic sea ice level has moved during this october below the 2012 level.
And even in the Antarctic, sea ice level is despite numerous skeptic claims about unprecedented increase actually at lowest level since good a decade.
Such information is exactly what people like Javier deliberately ignore.
So what!