
Back when Richard Muller announced the formation of the Berkeley Earth Surface Temperature project, those who deny the danger from global warming were thrilled. They thought the Berkeley project would prove once and for all just how Earth’s temperature had really changed. More to the point, Muller was skeptical about Earth’s reported temperature history, so they expected it to show that all those other guys — NASA, NOAA, HadCRU — got it wrong. Anthony Watts welcomed it, praised it, and announced that he would accept the results, whatever they were.
When the Berkeley project announced their results, deniers changed their tune. Instead of “showing the love” to Richard Muller and the gang, they turned on them like a pack of wolves. That’s because the Berkeley project showed that all those other guys — NASA, NOAA, HadCRU — got it right.
Yes, Earth is really heating up. Fast. And since Berkeley is the first of the major organizations reporting global temperature to release their end-of-year results for 2015, they’re also the first to make it official: 2015 was the hottest year on record. By a long shot.
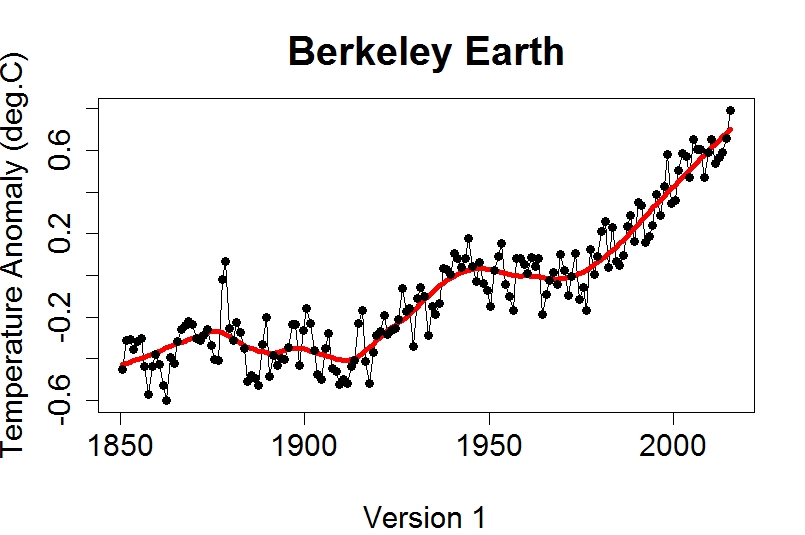
When it comes to global temperature over land and sea, Berkeley produces two versions, different in the way they treat areas covered with sea ice. Version 1 uses air temperature estimates for sea-ice covered regions, version 2 uses ocean temperature estimates. They describe it thus:
Two versions of this average are reported. These differ in how they treat locations with sea ice. In the first version, temperature anomalies in the presence of sea ice are extrapolated from land-surface air temperature anomalies. In the second version, temperature anomalies in the presence of sea ice are extrapolated from sea-surface water temperature anomalies (usually collected from open water areas on the periphery of the sea ice). For most of the ocean, sea-surface temperatures are similar to near-surface air temperatures; however, air temperatures above sea ice can differ substantially from the water below the sea ice. The air temperature version of this average shows larger changes in the recent period, in part this is because water temperature changes are limited by the freezing point of ocean water. We believe that the use of air temperatures above sea ice provides a more natural means of describing changes in Earth’s surface temperature.
Let’s not keep you in suspense any longer. Here are annual averages through 2015 (which is now complete) according to version 1:
Here it is according to version 2:

Any way you look at it, 2015 is the hottest. Any way you look at it, there was no “pause” in global temperature.
It’s now becoming so obvious, that deniers are having a hard time. They’ve become desperate, reverting to some of their more foolish arguments (when it comes to foolishness, this is hard to beat). They’re trying hard to blame 2015’s heat on the recent el Niño — which only begs the question, why is 2015 so much hotter than other el Niño years?
The important fact is that we’re rapidly approaching temperature levels that are beyond dangerous. Using the Berkeley data version 1, this year was 1.14 deg.C hotter than the pre-1900 average; with the version 2 data it was 1.09 deg.C hotter. Either way, we’re more than half way to the 2 deg.C limit some call “courting disaster.” Major disasters. Personally, I think that’s too optimistic. I think 1.5 deg.C hotter than pre-industrial is courting major disasters.
The situation has become so obvious that even republicans are starting to get it. Republican voters, that is. Republican politicians staunchly refuse to accept reality. That’s because they’re not serving their voters, they’re serving their donors. Money talks — loud — while voters, be they republican, democrat, independent, get screwed by the very politicians who take money from fossil fuel billionaires.
What can we do? Vote them the hell out of office. Whether you’re republican, democrat, independent, or “other,” help us all by getting rid of the politicians who deny the reality, the man-made cause, and/or the danger of climate change. That includes every republican candidate for president.
If you like what you see, feel free to donate at Peaseblossom’s Closet.


Reblogged this on Hypergeometric and commented:
And there *STILL* are intelligent people out there, including statistician colleagues, who don’t buy the facts of warming. Generally speaking, they have a look at a few time series and get quickly skeptical, failing to realize that obtaining the warming result, as the BEST project discovered, is a non-trivial business. But, if pursued, in the end, you get the result that Tamino, NASA, NCAR, and the Met Office, Professor Hansen, and others obtain. BEST’s work, by the way, uses some great statistics, including applications of kriging, otherwise known as Best Linear Unbiased Estimation (“BLUE”) applied to spatial fields.
I guess the result will need to be confirmed and reconfirmed in different ways, using different techniques, as is typical in science, and maybe, just maybe, these lingering doubters will be convinced.
As for me, I never needed an observational record to accept the reality of climate disruption: It’s all just basic Physics, people.
1.5 deg.C hotter is only around 2 decades away now. Unfortunately, 2 decades is still an eternity in politics.
“when it comes to foolishness, this is hard to beat”
Mind you, C.R. Dickson in his WUWT article does at least carefully explain a problem that I’m sure many WUWT readers must have puzzled over for years, namely that, “A blood cell or a microbe doesn’t get any bigger when it’s magnified; it only looks larger.”
All credit to C. R. Dickson for clearing up that impenetrable mystery for his WUTW readers.
C. R. Dickson, like all great educators, obviously understands the requirement to pitch his erudition at a level commensurate with his audience.
I do hope Mr. Dickson will write again on the subject of optics. I’m sure a piece entitled, “Is there really another me there when I look into a mirror” would be most useful contribution to the cognitive development of WUWT readers.
Well, if he does write about mirrors, and you want to make some WUWT readers’ heads explode, you could always drop in and ask the misleading question “if a mirror reverses an image left-to-right, why doesn’t it reverse the image top-to-bottom?”
Actually, I used to wonder about that, myself…
You raise an interesting prospect.
As the denizens of the planet Wattsupia are usually so affronted by elitist responses, they would probably have some difficulty with the answer “Because if the image flipped up & down like it does left & right, it would no longer be a mirror image.”
Perhaps then, they should be directed to calm themselves and lie down and think about it. After all, the reflection of a lying body does not exhibit that same transformation. The head and the feet remain as you would expect; they are on the same side in the mirror as they are in reality.
And of course, the denizens of Wattsupia for once will not be out of their comfort zone in this exercise. Whether they appreciate the situation or not, the denizens of Wattsupia have far more experience of people lying than any other set of denizens.
;-)
It’s all about the z-axis ….
Yes, that’s the misleading part. To paraphrase Doc Brown from Back to the Future, if anyone hasn’t figured it out “you’re not thinking three-dimensionally”. If you lose yourself in the X (left-to-right) and Y (top-to-bottom) plane, and forget about Z, you’ll never see the answer… (no matter how long it stares back at you!)
I couldn’t find it, but I’m pretty sure Doctor Inferno had a blog post about the correct range to use on the temperature axis of climate graphs. Basically start at 0K and go up to 5000K. It seems that WTFUWT haven’t seen this little parody, but are determined to recreate it.
Possibly you’re thinking about his Arctic sea ice graphs?
http://denialdepot.blogspot.ca/2010/11/how-to-cook-graph-skepticalsciencecom.html
While I appreciate what Richard Muller and the BEST team are doing to counter denier’s claims now, I will note that Muller’s 2011 lecture where he accused Michael Mann, Jones, and Briffa of “deceiving the public and deceiving other scientists” in the so called hide the decline ‘scandal’ is still out there with comments from deniers on the video as recent as two weeks ago.
There’s probably nothing he can do to take that video down, but my question is did he ever apologize for those incorrect remarks, and distance himself from the ‘climategate’ conspiracy mongers? It’s all well and good to do good science now and be praised for it, but one also has to own up to their past misjudgements (defaming?) of others, if they want to be seen as being intellectually honest now. That lecture is still causing damage.
I doubt if he’ll ever apologize since he sees nothing to apologize for. When he first did his temperature estimates, he said that the problem that the emails showed had to do with paleoclimate, not the temperature reconstructions. http://www.sciencemag.org/news/2011/04/qa-richard-muller-physicist-and-his-surprising-climate-data
I wonder if Muller still thinks of Anthony Watts and Steve Mcintyre as his “heros” ?
To quote Father Ted ” These cows are small, those are far away.”
Thank you for quoting Father Ted! I still mourn Dermot Morgan and miss his tremendous wit.
The C. R. Dickson write-up at WUWT, if I understood it, was deriding the use of anomalies and produced a graph using actual temperatures which showed a flat line. If the purpose of graphing the data is to observe and study it, why would you use a method and a scale which doesn’t show the changes? Is that a valid question to ask?
Not sure, but it’s definitely the question I asked myself.
which only begs the question, why is 2015 so much hotter than other el Niño years?
Well, that’s obvious, isn’t it? Between NASA faking temperature data and the NOAA hiding emails and satellites doing satellitey things and Michael Mann hockey stick Atlantic hurricanes sea level bzzzzzz*POP*sssssss…
NEW DENIER TO THE FRONT PLEASE
Is BEST the best? I suspect it probably is, but a thorough, independent technical appraisal would be useful. And are there still better ways? I recall my old spatial stats-practitioner colleagues doing far cleverer things than Danie Krige ever imagined.
(Yes I know — it doesn’t matter; they’re all the same. But it is interesting.)
“Is BEST the best?”
That works as a play on words, but whether it’s the best temperature reconstruction scientifically is a matter of scientific opinion. By my personal criteria, the BEST reconstruction is the best because it so plainly revealed the hypocrisy pervading the deniosphere, as exemplified by Watts.
Tee Hee. Dickson’s post is priceless.
So If I do a plot of the change in my core body temperature, in Kelvin to deal with the real world. From 309 K on the left rising to 315 K on the right 3 days later, obviously that will be a very real world example of ‘nothing to see here’.
And if I extend the graph for another two days the final caption will read. ‘And my funeral was today’.
That Dickson’s piece on WUWT quotes Stephens et al with direct measurements of energy imbalance 0.6+-17 Wm-2, implying that they are measuring the noise instead of signal. But it is no secret that satellite observations are not accurate enough to constrain the imbalance. That’s why they use changes of ocean heat content. That’s something that DIckson failed to mention, ah?
Click to access 2005_Hansen_etal_1.pdf
Reblogged this on Notes from the Overground and commented:
More grist to the mill.
JMA have posted a preliminary temp anomaly for 2015, based on Jan-Nov.
The annual anomaly of the global average surface temperature in 2015 (i.e. the average of the near-surface air temperature over land and the SST) is estimated at +0.40°C (*) above the 1981-2010 average (+0.76°C above the 20th century average), likely to become the warmest record for the 125-year period since 1891. On a longer time scale, global average surface temperatures have risen at a rate of about 0.71°C per century.
* Note that this figure is still subject to change, because at the moment of this announcement it is only a preliminary result that was calculated based on temperature observations for the period of January to November in 2015.
http://ds.data.jma.go.jp/tcc/tcc/products/gwp/temp/ann_wld.html
They today posted their preliminary value for the month of December. Quite a large jump from last year’s hottest December – at least 0.2C higher.
The monthly anomaly of the global average surface temperature in December 2015 (i.e. the average of the near-surface air temperature over land and the SST) was +0.67°C above the 1981-2010 average (+1.05°C above the 20th century average), and was the warmest since 1891.
http://ds.data.jma.go.jp/tcc/tcc/products/gwp/temp/dec_wld.html
Very likely the 2015 annual temperature for JMA will break last year’s record by >0.1C.
Five Warmest Years (Anomalies)
1st. (+0.40°C)*, 2nd. 2014 (+0.27°C), 3rd. 1998 (+0.22°C), 4th. 2013, 2010 (+0.20°C)
I’m sure it is just a strange coincidence that today, on my birthday, Steven Goddard banned me from his blog site. But I gotta say it’s a pretty good birthday present.
Congratulations, and many happy un-returns!
People will debate numbers all day long. What really matters is that the solutions to our dirty energy problems are finally cost effective. Our massive air pollution emissions are no longer acceptable. Wind and solar power will continue to grow at a record pace. Effective energy storage solutions are on the way as well. The future looks bright from here.
Pollyanna was right.
The future looks much better than it did, but ‘bright’ is pretty optimistic. I see no prospect of nearly 100% reduction in emissions in 20-odd years. It’s epic and most of the high-emitters (westerners) whilst they accept that there is a problem in a vague sort of way, and not changing anything significant about the way they live their lives. Kevin Anderson has a good handle on where we are at IMHO. Without CO2 sequestration on the same scale as the current fossil fuel industry, 2C can only be avoided by 10%/yr emissions reductions, which is has only ever been achieved before in massive recessions and the French 1980s nuclear rollout.
One chap in my (UK) office just decided that he needs to visit the Chinese office 4 times/yr to ‘help them out’. The other is ‘not very interested’ in insulating his house whilst doing works. These people have 25-tonne footprints and feel no reason to change despite getting an ear-bending from me on a regular basis. Whilst that’s the normal reaction, and I’m the wierdo, I don’t see this happening anything like fast enough.
“That’s because they’re not serving their voters, they’re serving their donors.”
I think suggesting it is all about money is a unnecessarily simplistic.
GOP candidates also pander to and foster abject ignorance of scientific matters when it comes to creationism (especially young earth creationism) and the motivation there is clearly not financial.
I think there is a general failing from politicians across the board to lead rather than follow, to set the bar higher rather than dumbing down to the lowest common denominator … and this, very sadly is a huge part of ‘our’ failing to address seriously many issues, especially the biggest issue of all.
You forget: if they don’t win the votes, they can’t get the bribes or do what is needed for their sponsors, so pandering to the reactionary right and wilfully ignorant is just a method of attaining the votes needed to accrue the money.
It’s still financial.
I didn’t say there wasn’t a financial element, just that it isn’t only about the money.
Frankly I’d imagine most would pander to the great unwashed regardless of financial incentive, it being the simplest method of securing Republican party nomination (certainly) and eventual election (not so certain, depending on the electorate – but most GOP nominated presidential candidates at least, have to make some sort of swerve back towards sanity in the general) Showing any sort of leadership is a harder but I’d suggest, still not impossible sell.
Once elected of course, opportunities abound for the lining of pockets during, and especially after a stint in office, so even if you refused all fossil fuel sourced ‘bribes’, there would be plenty of other opportunities.