
The streets flood even without storm, rain, wind, even on a calm sunny day. It didn’t used to happen, but now the highest spring tides of the year (around October) bring flood waters, septic systems back up, waste oozes onto streets and lawns, saltwater leaks into groundwater and spoils drinking supplies. It’s not a pretty sight, and it’s not confined to Miami and New Orleans, it’s all along the coast.
It’s an undeniable sign sea level is rising. But one wonders: how fast?

The best estimate of global sea level changes based on data from tide gauge readings is, in my opinion, that from Church & White (which I’ll call “CW”). Alternative choices have been discussed before, but that’s not what this post is about; here’s the data from CW:

The thin black line follows the data, the thick red line is a smoothed estimate (using the lowess smooth). There’s a blue box in the upper right drawing attention to the time period since 1993, when we also have data from satellites.
That’s all well and good, but how fast is the level rising? The smoothed estimate enables me to compute the rate of change, and I also did so by least squares regression on a 10-year window sliding throughout the data. Result here:

The red line is the rate estimated from smoothing, with pink shading showing its uncertainty range (2σ). Black triangles mark the rates estimated from linear least squares on 10-year windows. At this time scale at least, it seems sea level is rising faster now than it has been before.
It’s interesting to compare the overall rate before and after 1993 — when the satellite data kick in. Still using the CW data, the rate before 1993 is estimated at 1.46 mm/yr., but since then it has been going at 3.56 mm/yr. That suggests that yes, sea level might be rising considerably faster now than is has been before.
What about the satellites? I found four satellite-based data sets for global sea level which were easy to get: from the University of Colorado (U.Colo), the Copernicus group (Copernicus), the European Space Agency (ESA), and CSIRO in Australia. And here they are:

In addition, there are two more from CSIRO. They recently refined their “nominal” estimate by comparing the results to tide gauges, which themselves must be corrected for vertical land movement (VLM). They did so in two ways: using a Glacial Isostatic Adjustment model (GIA), and using data from GPS instruments (GPS). That gives three estimates from CSIRO:

Since we have six satellite-based data sets to try (and there are others I haven’t retrieved), what do they say about the rate of change? If we use least squares regression on each data set we’ll estimate the average rate during the time since 1993. Here’s what I got:

Interestingly, the highest estimate comes from the tide-gauged based data from CW, at 3.56 mm/yr, the lowest is from the GPS-refined CSIRO data at 2.91 mm/yr. Any way you look at it, it’s rising faster than it was before 1993.
When you find a pretty strong linear trend in some data (as we have), it’s often revealing to subtract that linear trend and look at the residuals left over. In this case, they’re fascinating:

It sure looks like something changed about 2011, and it’s easy to confirm that statistically. The rate of sea level rise increased. I used a lowess smooth to estimate how the rate has changed for each of the data sets, including the tide-gauge based data from CW (shown as a dashed line):

My analysis confirms that although the rate of sea level rise has averaged about 3 mm/yr during the satellite era, it’s faster now, rising at about 5 mm/yr.
Yes different data sets disagree. Of course — if they didn’t they wouldn’t be different. But the things they agree on are that sea level rise has accelerated, and that its rate now is closer to 5 mm/yr than to 3 mm/yr.
This blog is made possible by readers like you; join others by donating at My Wee Dragon.


You won’t go to the beach anymore; the beach will come to you.
I keep hearing that satellite data is wrong due to satellite orbit degrading, and that real observations on the ground show no increases since The 1800s.
If you want to participate in a science discussion, you need to give the source. “I keep hearing” is not sufficient.
Have you been reading Tony Heller’s blog? Or are Tony Heller himself? Here is the explanation for the satellite half of what you keep hearing: https://earth.esa.int/web/guest/missions/esa-operational-eo-missions/envisat/news/-/asset_publisher/x9cY/content/improvement-of-envisat-ra-2-reprocessed-data-v2-1
Great article as always. The dip in the graph just after 2010 is from rain in Australia. It rained so much and over such a wide spread area it lowered sea levels
https://www.theguardian.com/environment/2013/aug/23/australian-floods-global-sea-level
Of course most of that runs down rivers back into the ocean… But like Pinatubo’s eruption impacting surface temps, it’s fascinating to see something on that scale.
Thanks for that article. Really is cool to be able to illustrate global impact with such a “confined” rain event.
From the 2019 Sep 23 issue of The Nation:
21
Years until the sea level is projected to rise by 12 inches in Florida’s Miami-Dade County
20%
Area of Miami that will be underwater if the sea level rises by 12 inches
380
Estimated number of tidal floods that Miami-Dade County will experience every year with a 15-inch rise
$1.7T
Property value at risk of being wiped out by a sea-level rise in South Florida
2.4M
Number of people who live less than four feet from the current high tide in Florida
$3.2B
Amount needed to build barriers to shield just Miami-Dade County from sea level rise
— Molly Minta
——————————-‘—————————
What is wrong with the last of these statements?
I’m not sure that it is a good idea to mix tide gauge and satellite data. These are 2 methods that measure 2 different things. It is best to keep to one measure only. Since tide gauge is a much older method it seems to be best to use this and see if there is an exponential rise in sea level. The main problem is that you can’t average tide gauge from one place to the other unless you know the vertical movement of the tide gauge measurement instruments self. This is to say of course you can average but it does not make sense to do. Try for you self to estimate the level of rise of the East Sea and you will see why this is so.
f747: I keep hearing that satellite data is wrong due to satellite orbit degrading, and that real observations on the ground show no increases since The 1800s.
BPL: You heard wrong. Tidal gauges are on the ground, and they show accelerating sea level rise.
Here is data showing that the long term tide gauge sea level changes are not different to what they’ve always been.
https://content.sciendo.com/view/journals/quageo/34/1/article-p27.xml?tab_body=pdf
[Response: It’s usually a good idea simply to delete nonsense like yours. But the regular readers haven’t had such a good laugh in a while…]
So… Citing a carefully researched scientific paper… Your response is basically “ha ha”.
[Response: Did you notice that most of the references are to papers by Albert Parker, and Alberto Boretti? Did you know they’re the same person? Did you know that Boretti/Parker once submitted TWO comments to a journal, about the same paper, but under his two different names?
Did you notice that it calls itself a “Polemic”?]
So your response is ad-hominem? The data is what it is.
fred747,
It isn’t just here that the‘ work’ Parker/Boretti is considered a joke. The paper you cite dates from 2015, yet, according to Google Scholar, it has managed just two citations within the literature. And you will never guess the name of the author of those two citing papers. (To remove all doubt, the name used is not Boretti.)
Parker/Boretti has had his day in the sun (eg see Visser et al 2015) but now he is just performing to a vacuous denialist audience, with the occasional comedy turn in places like this. So thank you. We do enjoy a good laugh occasionally.
‘Ad hominem’ is NOT a fallacy when the ‘homo’ so labeled is a proven scientific liar. It is evidence that their writing should be ignored if one is looking for facts.
Let me help you here: It is an ‘ad hominem’ argument to say that a convicted embezzler shouldn’t be hired as a compamy treasurer. But it is NOT a fallacy.
If he is a “scientific liar”, you could save your ad hominem breath and demonstrate he is a liar. Instead you jump to ” whah whah, not enough pointy headed academics have cited it, so I’m rejecting it on that basis”. This kind of sophistry isn’t fooling anyone.
[Response: Take a look at this.]
fred747,
You don’t appear to be familiar with the culture and practice of modern science. No trained, disciplined climate scientist would ask for what you’re asking. When the overwhelming preponderance of evidence shows that global sea level is rising, contrary claims must be considered extraordinary. Extraordinary claims, even if presented by highly-regarded scientists, require extraordinary evidence, and it’s sufficient to note that your link offers no such thing. As for your ‘ad hominem‘ complaint: Tamino has linked to his exposure of Albert Parker/Alberto Boretti’s dishonest science. Even if Parker/Boretti did not explicitly label his article a polemic, his claims are suspect at the outset. In any case, if Tamino tried to rebut every outlandish claim by a known denialist, he’d have no time for anything else.
Mal Adapted: Sea levels have been rising for 22000 years. That levels are rising, is not the argument. That you would frame the argument in terms of “do you believe sea levels are rising”, does not give me confidence that this is a serious discussion. The rate at which sea level has changed at various times in the last 22000 years is spectacularly faster than the rate now. So much faster that it boggles the mind. All this without any human interference.
Fred747, please take every cent you can get your hands on and buy coastal real estate because if you are right, you are going to make a mint cuz low-lying real estate values are in decline because of the degrading orbits of the satellites, or maybe it’s because folks think sea level rise is really happening. One or the other. Don’t just talk, invest, baby, invest.
Warm regards
Mike
It’s hard to invest because folks like the Obamas are pushing prices through the roof.
f747: I keep hearing that satellite data is wrong due to satellite orbit degrading, and that real observations on the ground show no increases since The 1800s.
1. I think you’re probably confused by the talk of “orbital decay” in the context of the radiometer satellites that are used to produce the atmospheric temperature data sets (e.g. UAH and RSS). The orbital management and calculations are completely different for the altimeter satellites and there is no “satellite orbit degrading” for them. Orbital decay is a genuine issue for the radiometer satellites.
2. Perhaps you should look at the graph at the top of this post.
The graph at the top is pretty flat from pre industrial times.
Uh…did you look at the residuals graph???
Neil, many locations have seen a little bit of acceleration “since the 1800s” — but not since the late 1920s.
The averaged data in your famous “Church & White 2006” paper and dataset showed no acceleration after the late 1920s.
The averaged data in your 2009 dataset showed no acceleration after 1900.
The averaged data in your 2011 paper and dataset showed only statistically insignificant data since the late 1920s.
See: DOI:10.1007/s11069-012-0159-8
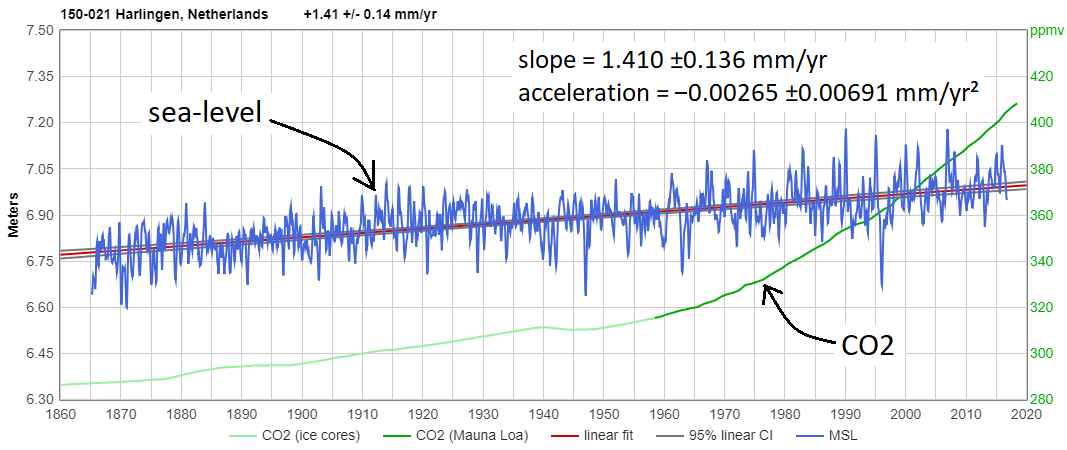
Here’s an especially high-quality measurement record, with >114 years of continuous data, at an ideally located, tectonically stable site, with little or no vertical land motion, and a very typical sea-level trend — showing +6 inches per century sea-level trend and no acceleration at all.
That rate is so slow that it is nearly insignificant for practical purposes, and in many places it is exceeded by local factors, like erosion, sedimentation, or vertical land motion.
Correction: “statistically insignificant data since the late 1920s”
should be: “statistically insignificant acceleration since the late 1920s”
You should never use a graph with a linear trendline to try to explain exponential rise or fall.
A linear trendline can never expose exponential rise because its intention is to show a linear trend . This mistake is made a lot by Tony Heller too.
Now if you would take the same data and put 10 or 5 year averages in it, then it might show something totaly different. Especially when you put the top level at the top of the graph and the lowest level at the bottom.
Patrick, the “acceleration” (with a statistically insignificant difference from zero) is calculated by quadratic regression, not linear.
Methinks I smell rats in fred747 and Dave Burton stuff.
The “paper” linked by Fred looks at only one station. It appeared in Sciendo, an online publication I had never heard of before. It lists Boretti 9 times and Parker 11 times in the reference section, most of which do not appear to be peer-reviewed papers. Multiple other references are to non peer-reviewed sources, including the “discussions” bad mouthing peer-review itself. The last reference is to a WUWT post, which says it all: the esteemed blog that gave us Antarctic carbonic snow and so many other entertaining features. Snopes has looked into Boretti/Parker stuff.
https://www.snopes.com/fact-check/scientists-caught-tampering-raw-data-exaggerate-sea-level-rise/
Dave Burton also shows a graph of only one location. The photos of Waikiki beach are telling for those who are willing to ignore that millions of dollars have been spent to rebuild that beach over the years, pretty much since it was developed. Photos are probably the most misleading piece of information one could use to illustrate the relation between that beach and sea level. Before a restoration effort will look bad, after will look good. It has more to do with the disparition of the wetlands and the natural barriers than any other factor.
Philippe, there are no “rats” in my stuff. I told you that Honolulu has “a very typical sea-level trend,” and that’s the truth.
The point of the photos is not the width of the beach, which is affected by storms, renourishment projects, etc. What you’re supposed to notice is the elevation above sea-level of the hotel building, which doesn’t appear to have changed much in nine decades.
Of course that’s affected by the tides, and we have no way of knowing the tide stages when those two photos were taken. But Oahu experiences only small tides:
http://www.hawaiitides.com/Waikiki/GetTide.asp
Honolulu is a nearly ideal place for sea-level measurement. Not only does it have small tides, It’s on an old, tectonically stable island, with little or no vertical land motion. Its low latitude is far from the gravitational effects of ice sheets, which can, at least theoretically, affect regional sea-levels. Its mid-Pacific location also minimizes ENSO influence, because as the Pacific ocean “sloshes” back and forth in response to ENSO-driven trade wind changes, Oahu is near the “teeter-totter pivot” point.
However, you can view graphs like that for many other locations on my web site. Unfortunately, most of them have shorter or less complete data, or else they’re at locations with substantial vertical land motion, which skews the linear trend (though generally not the [lack of] acceleration since the late 1920s).
Here’re two European sites with long, high-quality measurement records. The first (Wismar) is at a location with little or no vertical land motion, and a very typical trend, nearly identical to Honolulu’s. The second (Stockholm) is a location where vertical land motion is more than three times that fast, with the result that the local (“relative”) sea-level trend there is negative:
When analyzed by quadratic regression, some measurement records, like Honolulu’s, show an insignificant deceleration, and others show an insignificant acceleration. It really doesn’t matter: for all practical purposes, the coastal sea-level trend has been linear for nine decades. In most cases the slight changes in trend are statistically insignificant, and in all cases they are practically insignificant.
However, some locations did experience a small but detectable sea-level rise acceleration before that. As the Earth came out of the Little Ice Age, some tide gauges recorded a very slight change in sea-level trend, variously in the late 1800s or during the first three decades of the 20th century.
The clearest example is Brest, France. The sea-level trend there during the 19th century was zero, but the sea-level trend since 1900 has been +1.5 mm/year. Here’s a pair of graphs which show the difference:
Yet, even at Brest, which saw the largest acceleration of any long, high-quality, measurement record, the acceleration was nearly negligible from a practical standpoint, amounting to a difference of only six inches per century.
New York City’s tide gauge at Battery Park also saw a positive acceleration prior to the late 1920s, albeit with a much larger linear trend, because of the considerable subsidence there:
1/1925 to 3/2018:
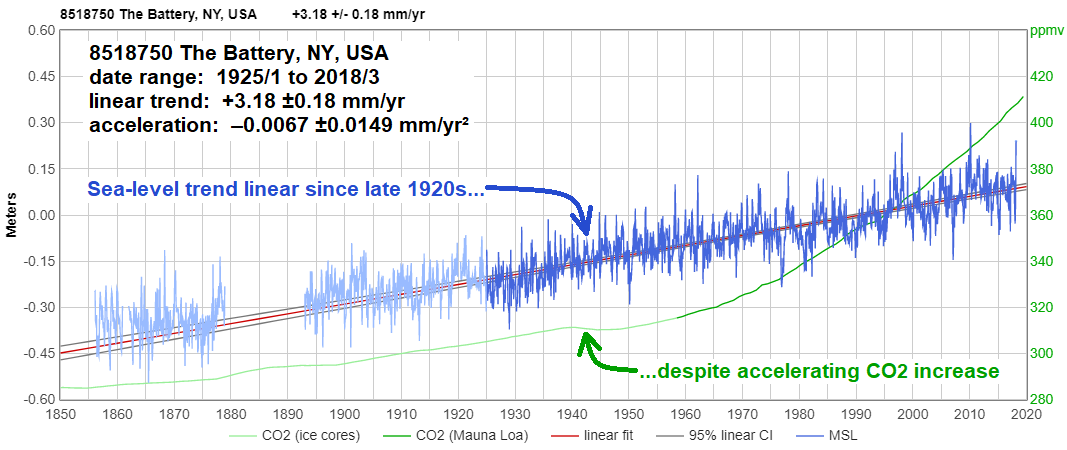
linear trend: +3.184 ±0.180 mm/yr
quadratic (acceleration): -0.00671 ±0.01492 mm/yr²
The rate of sea-level rise from 1856 to 1925 was not zero, like Brest, but it was less than the rate since 1925, indicating acceleration:
1/1856 to 1/1925:
linear trend: 2.458 ±0.297 mm/yr
quadratic (acceleration): 0.0265 ±0.0380 mm/yr²
Quadratic regression finds a negative value for the acceleration from 1925 to 2018, but the deceleration is not statistically significant. What’s more, it is so near to zero (perfectly linear) that if you regress starting in 1930, instead of 1925, you’ll find a positive acceleration (also insignificant):
1/1930 to 3/2018:
linear trend: +3.083 ±0.196 mm/yr mm/yr
quadratic (acceleration): +0.00367 ±0.01720 mm/yr²
There is at least one rat. What’s with the Waikiki pictures? Why in the World would one include such misleading item? What were you trying to accomplish with that?
DB: Honolulu is a nearly ideal place for sea-level measurement.
BPL: You may be under the impression that the sea-level is the same in all parts of the world, and changes at the same rate in all parts of the world. Neither statement is correct.
Philippe asked, “What’s with the Waikiki pictures? …such misleading item…”
Those Moana Surfrider Hotel pictures are real photographs, not faked, not manipulated in any way, and not at all misleading.
Here’s an example of a truly misleading photo, a Photoshop’d fake, used to hype sea-level rise. I imagine you’ve seen it before, or others like it. Have you ever complained about those actually misleading pictures?
Philippe asked, “What’s with the Waikiki pictures?… What were you trying to accomplish with that?”
I answered that question in paragraphs 2 & 3. Wasn’t it clear?
But, since you asked, I’ll go ahead and elaborate some more.
I’ve begun using pictures like that more often since discovering that a shocking number of apparently-educated people just don’t understand graphs. It doesn’t seem possible, but it is true.
What really drove the lesson home was a conversation with someone at the NCA4 SE Regional Engagement Workshop, March 16, 2017, in Raleigh. I think she was probably a member of the NCSU faculty, but I didn’t ask. Based on her age, I don’t think she was a student.
The fact that she was at the Workshop proves she was highly engaged and interested in climate issues. Yet when I showed her an obviously linear sea-level graph as evidence that sea-level rise is not accelerating, she said something like, “but it is accelerating, you can see that it’s going up!”
So, how can you convey the information in a graph to someone like that, who doesn’t understand graphs? It’s certainly challenging. Perhaps it is not possible to get across the concepts of sea-level acceleration and linearity to someone like that.
But using pictures like the Mauna Surfrider Hotel photos might at least help make or reinforce the point that rising CO2 emissions are not causing worrisome sea-level rise. That’s my hope, anyhow.
daveburton wrote: “Those Moana Surfrider Hotel pictures are real photographs, not faked, not manipulated in any way, and not at all misleading.”
But what point were you trying to make with the photos? You can’t say anything about sea level from those photos. So why put them in the post?
Martin Smith,
I think there is some cross-posting going-on here as the crayman daveburton does address why he uses photographs. According to him, he finds people do not understand his crazy message of ‘SLR from AGW isn’t a problem’ and blames this on their failure to grasp the concept ‘acceleration’ – that a straight-line graph of a quantity (eg SL) will not show any acceleration of that quantity.
Of course crazyman daveburton cannot be trusted to present a graph of noisy data properly so his straight-line graph which he describes as “an obviously linear sea-level graph” may indeed have been hiding acceleration that his audience could see but he could not.
But that said, rather than improve his explaining, crazyman daveburton decides that he can demonstrate this lack of acceleration better to any audience that doubts his message with just two photos of a beach hotel. This strongly suggests that crazyman daveburton does not himself understand the concept ‘acceleration’. And it also demonstrates that crazyman daveburton fails to understand the need for accurate SL measurements.
Now the reason for this cavlier attitude by crazyman daveburton is illustrated in the above post.
It is apparennt that crazyman daveburton couldn’t give a tinker’s cuss about ‘acceleration’ (which he apparently doesn’t entirely understand). What he does want to broadcast to any fertile audience is his crazy assertion “that rising CO2 emissions are not causing worrisome sea-level rise.” Pure and simple, crazyman daveburton is in denial over AGW and not only refutes the impact of today’s level of CO2 emissions, but sees no worry in emissions getting bigger & bigger (ie ‘accelerating’) off into the future.
Philippe’s not responsible for “misleading” photos by the National Geographic. Have you tried complaining to the NG yourself? Regardless, the NG’s actual claims are true. Your photos, OTOH, are misleading in support of a false claim, namely “that rising CO2 emissions are not causing worrisome sea-level rise.” Advantage Philippe.
Philippe & Mal, this is what a century of sea-level rise and +108 ppmv of atmospheric CO2 have done to Scapa Flow, in Scotland. The top photo is the German fleet, interred there in 1919, at the end of WWI. The bottom photo is recent. Both are viewed looking south from Houton on the Orkney Mainland:
https://sealevel.info/https://twitter.com/benny55au/status/1177167307371474949/photo/1
This is the closest I could get on Google Maps Street View. It is from a lower elevation and closer to the shoreline. The photos were apparently taken from the hilltop behind the camera:
https://www.google.com/maps/@58.9200126,-3.1827227,3a,75y,144.44h,69.8t/data=!3m6!1e1!3m4!1sKLutzjNKvFMqFZNQ7RuLpQ!2e0!7i13312!8i6656
Here’s the nearest PSMSL tide gauge, at Wick:
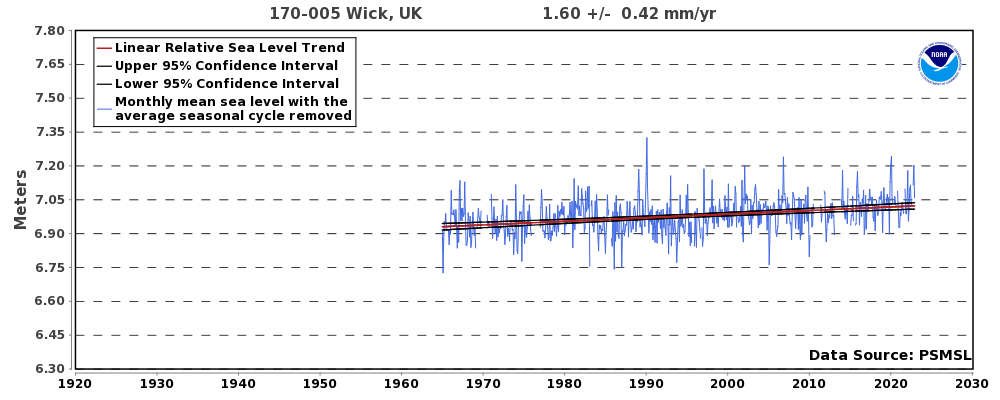
http://sealevel.info/MSL_graph.php?id=170-005
https://tidesandcurrents.noaa.gov/sltrends/sltrends_station.shtml?id=170-005
Note: There is a little bit of PGR uplift there. Peltier estimates 1.12 mm/yr (VM5) or 0.82 mm/yr (VM2) uplift at Wick, but both estimates are clearly too high.
Here’s an article with many other “then vs. now” photos of UK beaches:
https://www.dailymail.co.uk/news/article-4738820/Colourised-seaside-pictures-vivid-image-UK-resorts.html
You shouldn’t have to be a Republican to be able to see that rising CO2 emissions are not causing worrisome sea-level rise.
Oops, I botched the URL of the pair of Sapa Flow photos, a century apart. Sorry about that! It should have been:
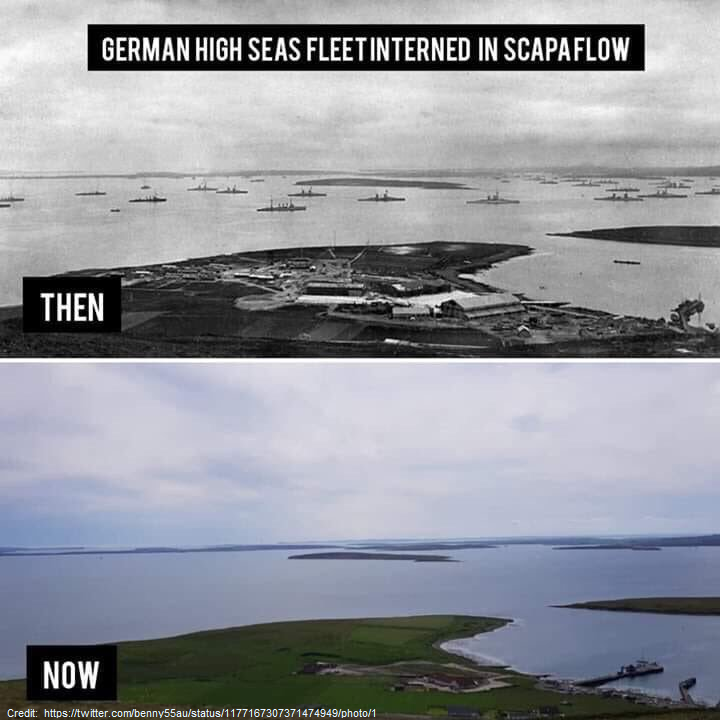
Re. The Scapa Flow pictures. Taking some measurements from GIMP we find: (Of course, since tides are around 2 meters or more in that area, your picture is meaningless as evidence for sea level at all but let’s pretend it actually IS “evidence”.)
1. The channel at the right measuring from the tip of the dogleg dock to degrees vertically to the opposite shore is significantly wider if you actually measure (62 px to 53 px)
2. The width of the opening into that channel is over twice as wide in the more modern picture (40 px to 20 px)
3. The beach at its innermost point on the right of the central point is thinner in the modern picture (22 px versus 11 px)
All of these are consistent with higher levels for whatever reason in the modern picture.
So, can you explain to us how this pair of pics “proves” there has been no sea level rise in the intervening century? (Of course no one with half a brain would argue that one can come up with rigorous SLR measurements this way in the first place, but your evidence–such as it is–actually argues the opposite of your “conclusion”.)
Crazyman daveburton tells us “You shouldn’t have to be a Republican to be able to see that rising CO2 emissions are not causing worrisome sea-level rise.” Of course not. But it does seem that right-wing fools, who shouldn’t be alone in their foolishness, do manage to score highly in seeing things for what they’re not. Do forgive my ignorance of US politics but I’m sure those good ol’ left-wing folk have themselves never put into the White House a purile liar as awful as that Donald Tr Gump.
In UK, mind, I am on safer ground. It is wholly correct that the right wing are the ones who suffer climate change denia, So while it shouldn’t be the case that it is mainly Tories who can only see reasons to ignore AGW, That is the situation. To support this assertion it was recently shown that Tory MPs (who are mostly not as right-wing as Tory voters) are five times more likely to vote against doing anything to address AGW.
Philippe Chantreau,
The Dave Burton graph is not the subject of his grand work that he references which was (it dates back to 2012) all about our old friend th NY Battery SL data. Its title suggests it is a comment on Shepard et al (2011) but assuming this version is what it consists of, it doesn’t seem to be directly addressing the findings of Shepard et al in any way.
The NY Battery data (available here but note the warning) has been in the past the subject of an OP by our host (Note there the reference to Burton as well as to Parker).
If today, with ‘extreme caution’ the NY Battery data is subjected to an OLS analysis, it shows not “the rate of rise has been nearly constant for over a century, at 2.77 ± 0.09 mm/year (95 % CI) “ as stated by Burton (2012) but averaging 2.87 ± 0.085 mm/year (95 % CI), this higher figure of course because there is an underlying acceleration. Indeed, a series of rolling 20-year OLRs through the data shows a lot of inter-decadal variation, wobbles with ampitude of up-to +/-3mm/yr with definite signs of acceleration from the 1850 through to the 1950, a deceleration through to 1980 and thence-on a more sustained level of SLR averaging 4.2mm/yr 1985-2018. The assertion set out in Burton (2012) that “the rate of sea level rise has not increased significantly in response to the last 3/4 century of CO2 emissions, so there is no reason to expect that it will do so in response to the next 3/4 century of CO2 emissions.” is pure nonsense.
Al Roger wrote, “it shows not ‘the rate of rise has been nearly constant for over a century, at 2.77 ± 0.09 mm/year (95 % CI)’ as stated by Burton (2012) but averaging 2.87 ± 0.085 mm/year (95 % CI), this higher figure of course because there is an underlying acceleration.”
In the first place, 2.87 ± 0.085 is not “higher” than 2.77 ± 0.09. You cannot just ignore the CIs. The CIs overlap, so you cannot say that one is larger than the other. The correct statement is that the two trends are not significantly different.
Nevertheless, it is true that the “full-record average” linear trend for The Battery is generally creeping up. But that’s not because sea-level rise is accelerating. It is because the trend prior to 1925 was less than the trend since then.
The linear trend prior to 1925 was +2.458 ±0.297 mm/yr. The linear trend since 1925 is +3.184 ±0.180 mm/yr (calculated using NOAA data through 3/2018). When you do a linear regression over then entire record (starting in 1856), it’s like calculating a weighted average of those two trends, but as the years accumulate, the weight given to the lower pre-1925 trend diminishes, which causes the full-record average to increase.
Of course, the oceans slosh, so the post-1925 trend also fluctuates a bit as the record lengthens. For example, I wrote my little paper in 2012. At that time the linear trend since 1/1925 (to 12/2011) was 3.191 ±0.202 mm/yr. So you might be tempted to say that the rate of sea-level rise is now “lower,” because 3.184 ±0.180 is less than 3.191 ±0.202. But that would be a mistake. The CIs overlap, so the correct statement is that the two trends are not significantly different.
daveburton,
You evidently see the world in a way that is beyond my comprehension.
You write a comment on Shepard et al (2012) yet manage not once to mention Shepard et al or their methods. In my eyes, that is crazy.
You tell me here that the linear SLR through the 1856-2018 NY Battery data show no acceleration because the CIs overlap, even though the means now sit outside the CI of the other (thus beyond 2 s.d.). In my eyes, that is crazy.
You tell me here that the reason the linear mean SLR has increased since 2012 is not because of post-2012 data sitting above the line of linear SLR 1856-2012 (an acceleration) but because the trend pre-1925 was less than the trend post-1925 and as data accumulates, the pre-1925 data becomes less significant to the total. In my eyes, that is crazy.
You dangle cherry-picked start-dates to suggest that an SLR calculated since 1925 could be wrongly seen as decelerating 2011-2018 by a whopping -0.007mm/yr (although your cherry-picks left the 1925 data hanging on the tree). The idea of raising such a thought in such a manner I see as crazy.
And a quick squint at some of your other comments recently arrived here.
You seem to collect SLR records like you would postage stamps. Yet those who address SLR as a global phenomenon and not a collection are ignored as an irrelevance. Instead it is “Look! Another straight line! Well it looks straight to me.” Or this phenomenon of “sloshing” you invoke to maintain a straight line with a straight face. To me, this is entirely crazy talk.
You assert that even if data were perfectly linear, by varying the mix of measurements used it would be possible to obtain the illusion of an acceleration. In my eyes, that is pain crazy.
So daveburton, your entire approach to analysing the rate of SLR is, in my eyes, utterly crazy. As you appear unable to explain why it is not crazy, I can but continue cataloguing your crazy-speak here in the hope that some demented logic will become evident.
DB: that’s not because sea-level rise is accelerating. It is because the trend prior to 1925 was less than the trend since then.
BPL: After you’ve said something like that, why do we have to pay attention to anything else you say at all? Do you not understand what “acceleration” means?
Barton Paul Levenson, “is” means the present tense. It refers to what IS happening NOW.
1925 was long ago. Acceleration WAS happening THEN.
Not the same thing.
Sea-level trends did accelerate, slightly, before about 1930. But sea-level trends since then have been very close to linear.
Barton Paul Levenson,
I think you will find that this climate-change-denying crazyman daveburton indeed does not understand the concept ‘acceleration’.
A little up-thread he has just explained that some people do not understand his graphs, providing an example of one saying “but it is accelerating, you can see that it’s going up!”
Whatever the reason for this misunderstanding (and I point out myself immediately up-thread that daveburton’s crazy assertions are beyond comprehension so there-already we have a likely reason), crazyman daveburton says he has addressed such difficulties in illustrating his assertion of zero-acceleration by using two photographs. So this mighty genius of the crazy-world believes that you can illustrate a lack of acceleration in a value with just two data points. Evidently then, daveburton indeed has no proper understanding of the concept ‘acceleration’
IMHO there’s a good chance that SLR acceleration is an artifact of spatially inhomogeneous sampling. From the calculations I’ve done, using a straight average of gauges will give a booming acceleration. But if interpolating to a grid is done within the predictive range of the gauges (~2000km), the acceleration is pretty well busted. Interpolating beyond the predictive range will give an acceleration that is an echo of the boom.
Also, altimetry data appears to have a rather large measurement error. Generating a variogram of monthly Aviso 0.25º gridded data, I get a semivariance nugget of about 2500mm. I think that translates into a standard error of +/-50mm.
Of course, I have no expertise in this area, so please feel free to disregard.
AJ wrote, “But if interpolating to a grid is done within the predictive range of the gauges (~2000km), the acceleration is pretty well busted.”
A long time ago I tried to determine “the predictive range of the gauges,” by plotting the differences between sea-level trends at every pair of GLOSS-LTT tide stations (159 of them at that time, so 159×158 = 25,122 points), and then fitting curves to them:
Zooming in on the left end gives:
From the graph we can see that only at distances less than about 800 km is there any increase in correlation at all, and only at distances less than about 400 km is there a substantial increase in correlation between LMSL trends measured at pairs of tide stations.
I think your approach is a good one, AJ, but I think 2000 km is too large, by a factor of about five.
My approach was to use the R gstat package to generate a variogram for both tide guage and altimetry data:
The black lines are the spherical fit and the red exponential.
Both show a ‘range’ of greater than 2000km. The reason for the difference between your range and mine could be because I used annual data, applied a GPS vertical land motion adjustment, took the annual differences, and filtered outliers. Getting a ‘nugget’ of zero demonstrated that neighboring stations are highly correlated.
For the altimetry data I only looked at the Pacific, averaged the 0.25º grid to a 1º, calculated the annual average, and then took the annual differences. The nugget for the altimetry data is 1000mm which I believe means a standard error of about +/-30mm. Without the averaging, the nugget on the raw monthly data is about 2500mm.
That’s very interesting, AJ!
Is this a good description?
http://www.kgs.ku.edu/Tis/surf3/s3krig2.html
It looks like you “binned” the tide gauge pairs at 300 km intervals. Is that right?
But you said you used “annual data” — so what were you actually comparing? I compared NOAA-calculated long-term trends. (It would have been better to use trend since 1925 or 1930, but I didn’t have the tools for that, at the time.) But there’s no “annual” aspect to long term trends.
Did you use year-to-year sea-level changes? If so, that might account for some of the difference between our results. Year-to-year changes would be dominated by things like the “range” of ENSO-effects. Long term trends are dominated by things like vertical land motion, which is what I was interested in.
In other words, it appears that we were looking for different things.
My guess is that ocean “sloshes” (driven by things like ENSO) are spatially larger than vertical land motion differences.
In other words, if sea level is being driven up by El Nino “here,” then it’s probably also being driven up by El Nino, to at least some extent, at another location 1000 km away. But vertical land motion (VLM) “here” is probably not predictive at all of VLM 1000 km away.
(But looking at your plots, I would say there’s not much predictive value beyond about 1000 km, rather than 2000 km.)
What GPS data did you use? Most tide gauges don’t have co-located GPS data. Did you just exclude those sites?
Peltier has model-derived GIA estimates for every tide gauge, but, of course, those estimates often differ from reality. However, I’m not convinced that the GPS data is better.
That wasn’t an issue for me, because I didn’t want to adjust for VLM, because VLM is the largest part of the variation between sites that I was trying to characterize.
Well that makes more sense. I thought this seemed vaguely familiar Boretti, Parker, Fred and Dave are as full of it as deniers get. Working hard to give themselves the appearance of respectability, and falling short because it simply isn’t there. The Boretti garbage is especially telling. Listing a bunch of opinion pieces from dubious origins in what looks like the reference section of what looks like a peer-reviewed paper in what looks like a science publication and it’s all hot air. How ironic that a good part of these are opinions about how bad peer-review is. What a pathetic joke. Buffoons, lies and the lying liars who tell them…
I’m no fan of any kind of climate catastrophism.
But I’m wondering why so many people like Dave Burton and others deliberately either ignore or discredit information available everywhere.
1. To understand why it is so useless to claim about little sea level rise (and no acceleration) when solely based on trivial examples like Honolulu or Fort Denison, it is useful to start with a chart published by NOAA, which perfectly shows how strong sea level changes can vary from one Globe region to another:
https://tidesandcurrents.noaa.gov/sltrends/sltrends.html
Click on ‘Global’ and you get the whole story.
2. If by accident you have some little software engineering experience, you may access lots of tide gauge data, managed by the PMSL project:
https://www.psmsl.org/data/obtaining/rlr.monthly.data/rlr_monthly.zip
and compare that with satellite data, e.g.
– from NASA
https://podaac-tools.jpl.nasa.gov/drive/files/allData/merged_alt/L2/TP_J1_OSTM/global_mean_sea_level/GMSL_TPJAOS_4.2_199209_201907.txt (actual link, subject to change)
– or from NOAA
http://www.star.nesdis.noaa.gov/sod/lsa/SeaLevelRise/slr/slr_sla_gbl_free_txj1j2_90.csv
You see that indeed, the sea level change since 1880 is about 1.5 MM/year on average. And when looking at the result of your PMSL processing, you think that at a first glance, the sea levels seem to keep constant:
https://drive.google.com/file/d/188SYA1fiQyAri1ZPfWZYyBd546MBvkJg/view
But you see also that for the common gauge/satellite period since 1993, the gauges and the satellite readings show the same trend, what means that the gauge trend really, really increases up to 3 mm/year:
https://drive.google.com/file/d/1rzU5uoo-JFQoFOvKFQfDQliS5P0-VeCC/view
Most skeptics of any sea level rise argue that this ‘sudden’ increase in rising shown by gauge data is due to a disingenuous mix of satellite data into gauge data. What a strange, nonsensical idea!
You just need to analyse the gauge data and to compute the trends for consecutive periods, starting with e.g. 1883-2018, moving the start by five years each time, and ending with 2003-2018 (to keep the period long enough).
You obtain something like this (in mm/year):
1883: 1.40 ± 0.02
1888: 1.45 ± 0.02
1893: 1.49 ± 0.02
1898: 1.54 ± 0.02
1903: 1.59 ± 0.02
1908: 1.60 ± 0.02
1913: 1.68 ± 0.02
1918: 1.75 ± 0.02
1923: 1.78 ± 0.02
1928: 1.79 ± 0.02
1933: 1.78 ± 0.02
1938: 1.74 ± 0.02
1943: 1.69 ± 0.03
1948: 1.67 ± 0.03
1953: 1.76 ± 0.03
1958: 1.88 ± 0.03
1963: 2.05 ± 0.04
1968: 2.15 ± 0.04
1973: 2.33 ± 0.05
1978: 2.55 ± 0.05
1983: 2.78 ± 0.06
1988: 3.03 ± 0.07
1993: 3.07 ± 0.09
1998: 2.96 ± 0.12
2003: 3.63 ± 0.15
You see of course that there has never and never been any abrupt change from some 1.5 mm/year in the gauge era up to 3 mm/year in the satellite era! That is pure nonsense.
I’m no statistician like Tamino, and suppose that if I compute the linear estimate for these trends, I obtain the acceleration. If this is correct, this means that the average acceleration since 1883 then is about 0.07 mm/year².
Regards
J.-P. D.
bindidon, the problem with that approach is that for each of your intervals the mix of measurement sites is different.
As that NOAA chart shows, measured sea-level trends vary from one location to another. That’s mainly due to varying local vertical land motion, but also due to several other factors. So varying the mix of measurement sites, by itself, would be sufficient to change the “average” trend, creating the illusion of either acceleration or deceleration, even if every site’s measurement record were perfectly linear.
I suggest that you redo your analysis, but with the set of tide gauges restricted to just those which have data for the entire period of interest. In other words, do not change the mix of measurement sites. (Note: you’ll need to do some sort of interpolation if you want to use sites which have gaps in their measurement records, to avoid inadvertently creating different weightings for different time periods.)
It is tempting to think that you could get away with using varying mixes of measurement sites and sites with shorter records by first correcting each record for vertical land motion at that site. But the reality is that we simply don’t have good enough VLM data for that (the model-derived data is very inaccurate for many sites, and the GPS data is sparse and unreliable), and even if we did have good VLM data that wouldn’t solve the problem of distinguishing between temporary “sloshes” and long term trends. Some researchers have attempted, instead, to decompose short measurement records with EOFs, to extract useful information from them, but that really doesn’t work, either. There’s no way to tell the difference between a transient “slosh” and a long term trend, in a short measurement record. If you want to usefully compare trends for different time periods, you must use measurements from consistent sets of measurement sites. There is no good alternative.
As for the 1993 & later coastal data, I would agree that it is consistent with the satellite data, in the sense that their confidence intervals overlap. But that’s mostly because for such a short time period the confidence intervals are huge. Let’s look at a couple of especially high-quality sites, with typical (approx. 1.5 mm/yr) trends since 1930.
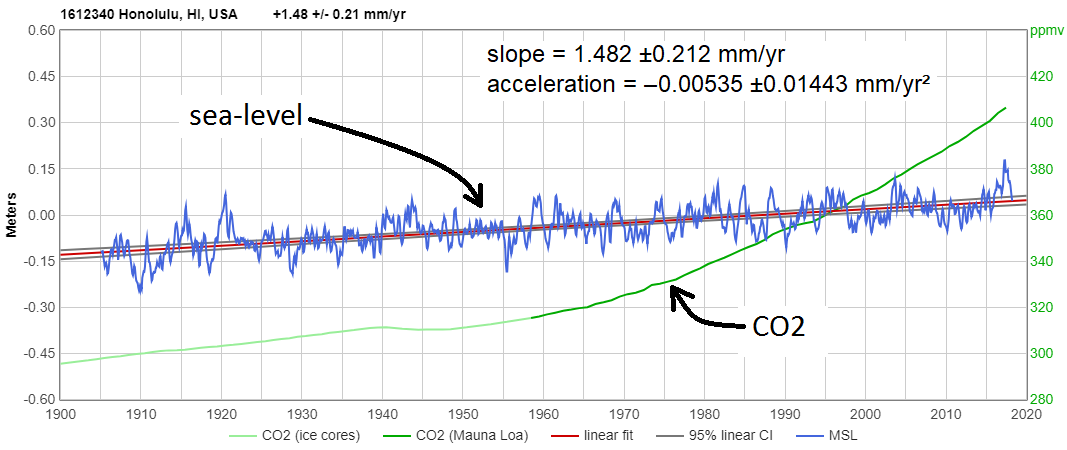
Here’s Honolulu (1/1993 – 6/2019):
http://sealevel.info/MSL_graph.php?id=Honolulu&c_date=1993/1-2019/6
Trend = 1.939 ±1.594 mm/yr
Here’s Wismar (1/1993 – 12/2016):
http://www.sealevel.info/MSL_graph.php?id=Wismar&c_date=1993/1-2016/12
Trend = 2.535 ±1.497 mm/yr
Both appear at first glance to show a slight increase, compared to their long-term trends. But in neither case is the change statistically significant.
That brings me to a particularly instructive case: Sydney, Australia. It is one of the few locations in the world which seem to show evidence of a significant recent acceleration in sea-level rise.
The trend there since 1930 is 1.203 ±0.170 mm/yr.
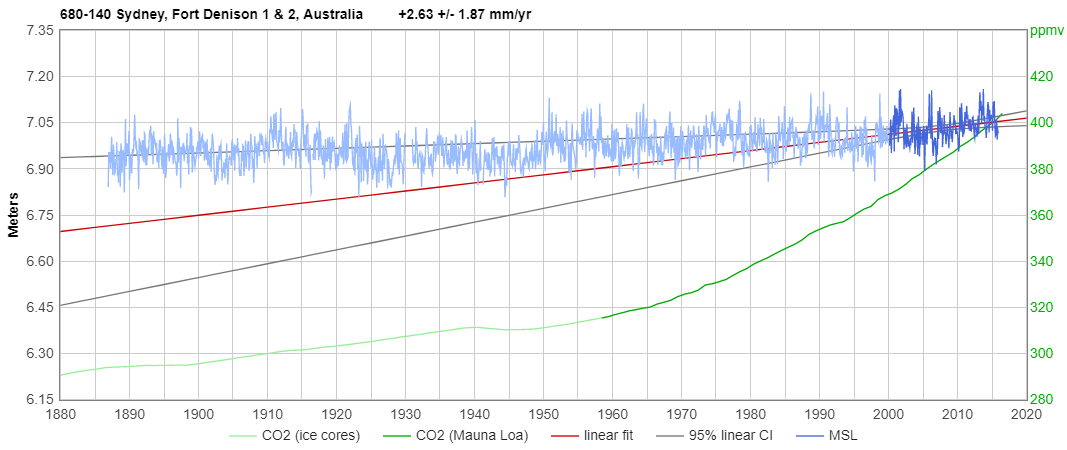
The acceleration since 1930 is 0.00309 ±0.01530 mm/yr² (i.e., approximately zero).
To the eye, the trend looks very linear:
https://sealevel.info/MSL_graph.php?id=680-140&c_date=1930/1-2019/12
But look what happens when you compute the trend since 1993 (i.e., over the satellite era):
Trend = 3.948 ±0.986 mm/yr.
The CIs don’t overlap! Voila, acceleration!!!
Or not. If you look at the graph you can see what really happened:
What happened is that sea-level sloshed down sharply at Sydney in the 1990s. Over the period 1988-1997 the trend was sharply negative. That biases the left end of our analysis period. It does not represent a true increase of that magnitude in the sea-level trend, because the apparently-accelerated rate is really mostly an artifact of the particular starting point.
The same thing happens at Trieste, Italy. The long term trend is very linear, but can you guess what will happen to it for the (1993+) satellite era?
Cool. So just a continuing increase in the rate at which the oceans are rising. That is, an acceleration. Funny how some people don’t want to see that.
John Brookes wrote, “So just a continuing increase in the rate…”
No. Just a continuation of the approximate longstanding trend over the last ninety years or so. So no significant acceleration.
The confusion might be because I posted the wrong Sydney graph under “To the eye, the trend looks very linear.” Sorry about that! It should have been this one:
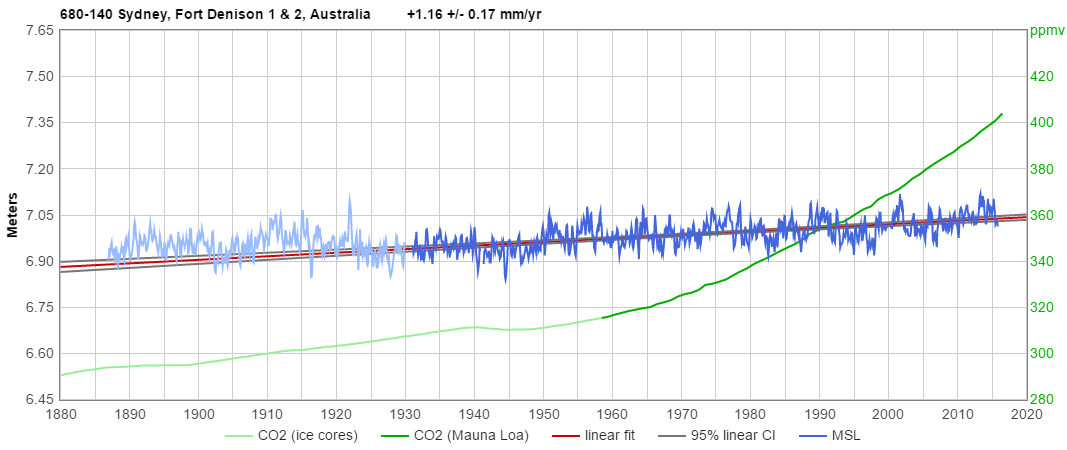
https://sealevel.info/MSL_graph.php?id=680-140&c_date=1930/1-2019/12
dave burton: “No. Just a continuation of the approximate longstanding trend over the last ninety years or so. So no significant acceleration.”
But if we assume that is true, do you mean we should say, “If there has been no significant acceleration for ninety years or so, despite the facts that (1) ice melts at a specific temperature and (2) the global average temperature is rising steeply due to burning fossil fuels, we should expect no significant acceleration in the future?
If we just throw up our hands and assume your model is correct because we want to move one, what changes? Doesn’t it just mean the rapid acceleration has yet to begin? Surely you don’t doubt that we are on course for meters of sea level rise and the only uncertainties are How many meters and In how many years?
Martin wrote, ” …Doesn’t it just mean the rapid acceleration has yet to begin?”
It sounds as though you think that meltwater is is the only important factor affecting global sea-level trends. It’s not. In fact, it’s not even the most important factor.
The most important factor is snowfall.
Snow which accumulates on ice sheets and glaciers ultimately represents water removed from the oceans and sequestered on land, lowering sea-level. What do you think happens to snowfall rates in a warming climate?
The answer is that they increase, for two reasons:
1. Warmer air carries more moisture. Below freezing, it’s 8-12% more moisture per each 1°C of warming! (That’s why heaviest blizzards occur when temperatures are only moderately below freezing.)
Click to access water%20vapor%20capacity%20of%20air.pdf
https://www.google.com/search?q=%22too+cold+to+snow%22
You’ve heard of “water vapor amplification,” right? It’s the most important positive (amplifying) climate feedback, and it occurs for the same reason.
2. Reduced sea ice coverage = more open water, increasing ocean evaporation and thus “lake/ocean-effect snowfall” (LOES) on downwind land.
http://archive.is/vp9eP#selection-1257.0-1257.450
https://google.com/search?q=%22lake%2Focean-effect+snowfall%22
The importance of LOES is illustrated by the story of Glacier Girl, a P-38 which made a forced landing on the Greenland Ice Sheet during WWII. It was recovered 50 years later from beneath about 268 feet of ice & snow (mostly ice). It had been buried by snowfall which averaged an astonishing approx. 70 feet per year!
All that ice and snow was water, evaporated from the North Atlantic and Arctic Oceans.
The story of Glacier Girl is very interesting history:
http://www.airspacemag.com/history-of-flight/glacier-girl-the-back-story-19218360/?all
http://p38assn.org/glacier-girl-recovery.htm

So, we know that the consequences of a warming climate include factors which both increase and decrease sea-level. There’s no fundamental reason to suppose that either must dominate the other, so there’s sound basis for some people’s certainty that sea-level trends will greatly accelerate in a warming climate.
Rather, the fact that sea-level trends have remained close to linear as CO2 levels have risen by 96 ppmv (over the seven decade Mauna Loa measurement period) strongly suggests that the opposing effects of global warming on sea-level are roughly balanced.
That’s a very long buildup to the answer to your question: No, it does not “just mean the rapid acceleration has yet to begin?”
(I also disagree with your characterization of recent warming trend as “rising steeply,” but I guess that’s a nit.)
daveburton wrote: “The most important factor is snowfall.”
Actually, I thought it was still thermal expansion, but if we again just assume your claim that snow is the most important factor is correct, my same question still applies: ” …Doesn’t it just mean the rapid acceleration has yet to begin?”
In your point (1) you alluded to the problem you still haven’t addressed: “(That’s why heaviest blizzards occur when temperatures are only moderately below freezing.)” Air temperature over the ice sheets has RISEN into that range, not dropped. There is more snowfall on the ice sheets because the air above them is warming, not cooling, and as you explain, warm air carries more water that, for now, falls as snow, increasing the snow depth on the ice sheets (assumed).
But eventually, the air temperature over the ice sheets will rise above the range where snow will form. In Antarctica, that will not happen for a long time, if it ever happens, but in the rest of the world it is already happening. There is increased snowfall in some regions sometimes, but increasingly there is not enough snow for ski resorts and for watersheds.
daveburton writes: “the fact that sea-level trends have remained close to linear as CO2 levels have risen by 96 ppmv (over the seven decade Mauna Loa measurement period) strongly suggests that the opposing effects of global warming on sea-level are roughly balanced.”
We assumed that is correct. Then you argued that as the global average temperature rises, there will be no collapse of the ice sheets, despite the melting point of ice being reached and exceeded, because there will be increased snowfall as the air temperature over the ices sheets increases into the heavy snow range. But the temperature at which snow no longer forms will also be reached and exceeded, especially over the land masses in the northern hemisphere, and that is already happening, although not in Antarctica. So now you must argue that SLR will remain linear because… why? Will evaporation increase to the point where half the oceans are on the surface and the other half is in the air, and this balance is maintained indefinitely?
daveburton writes: “(I also disagree with your characterization of recent warming trend as “rising steeply,” but I guess that’s a nit.)”
No, it’s the blade of the hockey stick. 1C in 100+ years is steep.
daveburton,
You are not quite up to the standard of the Sunday Sport but you are not far off.
It is of course true that “Snow which accumulates on ice sheets and glaciers … represents water removed from the oceans and sequestered on land, lowering sea-level” but not “ultimately” so, and is because of a number of physical mechanism that appear to have escaped you deluded mind.
The melt of snowfall on ice sheets (recorded by Surface Mass Balance) greatly reduces that ‘accumulation’. Added to that, the ice beneath flows and discharges icebergs into the sea. Thus all the evidence demonstrates that, while “the consequences of a warming climate include factors which both increase and decrease sea-level,” there is no serious evidence that “the opposing effects of global warming on sea-level are roughly balanced.”. They are greatly out-of-balance. In the case of Greenland the evidence is presented by Mouginot et al (2019).
You, daveburton, may find it strange that this scientific study fails to harness the comic-book evidence provided by crashed WW2 aircraft but that is because you are a crazyman living in a crazyman world.
And it may not be true in your crazy world that “the global average temperature is rising steeply,” but, beyond the walls of the nut-house you inhabit, it is surely otherwise.
AJ | October 7, 2019 at 3:51 pm
“IMHO there’s a good chance that SLR acceleration is an artifact of spatially inhomogeneous sampling. From the calculations I’ve done, using a straight average of gauges will give a booming acceleration. But if interpolating to a grid is done within the predictive range of the gauges (~2000km), the acceleration is pretty well busted.”
*
I would like to know how you manage to establish this ‘predictive range of the gauges (~2000km)’. It does not make much sense to me.
What makes sense to me when gridding data is to perform a preliminary averaging in order to avoid predominance of data sources located within the same grid cell.
A typical example is that of temperature stations, where distribution of stations over a grid gives you in the US many cells with over 300 stations. Thus, a global averaging without preliminary grid averages lets the Globe appear like US’s backyard.
Here is a chart showing a spatiotemporal distribution of PMSL tide gauges:
https://drive.google.com/file/d/1iCIoZqp0ImvktVLUkJ0yNet1DVVafhzG/view
and here is a comparison of a simple tide gauge data averaging with one including a preliminary grid averaging (2.5 ° grid cells):
https://drive.google.com/file/d/16edDBhxkpuzykl8Ie3CchmjQLw9nVr-q/view
Please draw the conclusions… you are the stat expert, at least in comparison to me.
bindidon | October 7, 2019 at 11:40 pm
When you look at tidal gauges or altimetry grid points, the correlation between observations becomes relatively unpredictive somewhere around 2000km and a bit. If you are kriging a grid point with no observations within the range, then you will simply get a straight average of all observations. This is a problem if there is a bias due to spatially inhomogeneous data. One solution is to limit the maximum distance of the interpolation to within a suitable range. No sense using a Tokyo station to interpolate grid points off the California coast.
BTW… I don’t claim any expertise, but Kriging is a standard method of handling inhomogeneous datasets.
AJ | October 8, 2019 at 2:48 pm
“No sense using a Tokyo station to interpolate grid points off the California coast.”
Of course not.
In my first reply to you I was speaking about grid averaging, and not about interpolating missing data on a grid through e.g. kriging.
Dave Burton
It does not matter much wether or not you presented the wrong graph for the PMSL station SYDNEY, FORT DENISON 2.
The problem is elsewhere, namely that you spend your time in looking at trees instead of considering the forest:
– (1) you permanently look at single stations instead of considering their ensemble
– (2) you look at different periods showing completely different trends instead of looking how trends behave over a longer period.
For Sydney, the trends calculated over consecutive periods from 1888-2018 till 2003-2018 looks like this:
1888-2018: 0.77
1893-2018: 0.81
1898-2018: 0.87
1903-2018: 0.91
1908-2018: 0.93
1913-2018: 1.07
1918-2018: 1.20
1923-2018: 1.31
1928-2018: 1.30
1933-2018: 1.27
1938-2018: 1.31
1943-2018: 1.25
1948-2018: 1.10
1953-2018: 1.13
1958-2018: 1.27
1963-2018: 1.35
1968-2018: 1.46
1973-2018: 1.54
1978-2018: 2.00
1983-2018: 2.32
1988-2018: 2.88
1993-2018: 4.03
1998-2018: 3.87
2003-2018: 4.88
Selecting 1993-2013 (positive trend) or 1987-1998 (negative trend) is, in comparison to this sequence, of no interest at all.
P.S. I don’t know how a blog machine llike WordPress manages to allow you to send me a mail. But I, Burton, do not allow you to do that.
Congratulations, bindidon, you’ve discovered two things that we already knew:
1. Sydney, like many other locations, experienced less sea-level rise before about 1930 than after.
BEFORE 1930:
linear trend = -0.067 ±0.512 mm/yr (by linear regression)
acceleration = -0.1624 ±0.0898 mm/yr² (by quadratic regression)
http://sealevel.info/MSL_graph.php?id=Sydney&c_date=1880/1-1930/1
(To see precise values, hover your mouse cursor over the graph traces, or touch the graph on a touch-screen device.)
AFTER 1930:
linear trend = 1.203 ±0.170 mm/yr
acceleration = 0.00309 ±0.01530 mm/yr²
http://sealevel.info/MSL_graph.php?id=Sydney&c_date=1930/1-2019/12
2. There’s a spike at the end of the Sydney measurement record, so the closer you get to the spike the steeper the trend.
If you pick a different location, which happens to have a negative spike through 2018, or if you use Sydney, but pick an end-date coinciding with a negative spike (e.g., 1997), your approach will produce the opposite result.
That’s why scientists don’t measure acceleration that way.
Here’s a completely synthetic “sea-level record” which obviously has no acceleration term at all, but which which I think will result in a similar pattern from 1923 to 2018 to what you found for Sydney (though I haven’t checked it):
(((x-1923)×1.5)) + 14×sin(2π×(x-1917)/9.8) + 6×sin(2π×(x-1920)/5.06) + 4×sin(2π×(x-1918)/1.97895) + 4×sin((2.02π×((x-1918))))
Of course you know that Fourier himself proved that ANY continuous line of ANY shape can be decomposed into sine functions. In point of fact, any series of numbers can be generated in multiple ways.
In science, however, one generally tries to have an idea of what the important underlying physical factors are and model using them.
Care to explain what underlying factors your above equation captures?
BTW, elsewhere you mention that models are UNTESTABLE as they predict the future. This is not true. One can simply wait and see. That said, that particular argument is right out of the old tobacco denial handbook which over and over stressed that since it was impossible for science to predict exactly which person would get exactly which cancer exactly when “therefore” smoking did not cause cancer. Wrong.
Here’s what I actually said elsewhere, bindidon:
The key word is “constantly.”
Have you ever done any computer programming? How many tests per thousand lines of code (kLOCs) does it take you to get your programs working correctly?
If you’re very good, maybe twenty. Fifty or 100 is probably more typical, and that’s for fresh code, which you’re intimately familiar with, because you wrote it yourself, and when the difference between working correctly and incorrectly is intrinsically clear. For longer programs the number of tests kLOC increases. For code someone else wrote, or code for which correct and incorrect operation is not always clear, the number of tests per kLOC increases.
GISS ModelE is about a half-million lines of moldy Fortran code, which it is safe to say nobody really understands. Do you really think one test every 30 years or so is sufficient to refine it?
I asked Dr. Emanuel how skillful he thought the weather models would be if they weren’t being constantly compared against measured reality, and refined accordingly. When your predictions go out a week or ten days, you can do a lot of tests. When your predictions go out 30-50 years, you can’t.
The early GCMs are now thirty years old, and, despite some people’s attempts to put lipstick on a pig, they did pretty awful. Of course, you could object that today’s GCMs are vastly more sophisticated than the early GCMs were, 30 years ago. That’s certainly true, at least if you equate complexity with sophistication. But that doesn’t mean their predictions are any better than coin tosses.
The pitfalls of modeling things that are poorly understood, with models that cannot be continually tested and refined, are illustrated by a different sort of NASA model. Here’s NASA in Dec. 2006, trying to predict solar activity just four years out. They predicted, on the basis of “a sophisticated computer model of the sun’s inner dynamo,” a very intense Solar Cycle 24, peaking in 2010 or 2011:
https://science.nasa.gov/science-news/science-at-nasa/2006/21dec_cycle24/
Their article began:
They were, of course, spectacularly wrong, about everything. Instead of “one of the most intense cycles since record-keeping began” we got an extraordinarily weak Solar Cycle 24. Instead of peaking in about four years, in 2010 or 2011, more than seven years elapsed before the peak finally came, in 2014. Impressively, their “sophisticated computer model” did much worse than simple coin tosses would have done.
NASA’s sophisticated computer model of the Sun was as wrong in 2006 as their sophisticated computer model of the Earth’s climate was in 1988.
I have no confidence that today’s sophisticated computer models of the Earth’s climate will look any better, in thirty years.
This crazyman daveburton seems to have taken up residence here. Presumably his own sad little website doesn’t afford the level of audence he considers he is due. But then as a second-rate ultra-denialist, this is perhaps to be expected.
I’m sure he misrepresents to conversation he had with Kerry Emanuel, and as well, seems to dwell on it to a level that most would consider unhealthy. Did I tell you he once spoke to the famous Kerry Emanuel?
It is interesting that the crazyman daveburton has no confidence in GCMs. I would suggest that the least reliable agent here is the crazyman himself. I note he cannot accept (that’s because he is in denial) that Hansen et al (1988) projected temperature increases above the 1951-80 mean by 2020 of +1.6ºC (scenario A), +1.1ºC (Scenario B) and +0.6ºC (Scenario C). This has pretty-much been been realised with GISTEMP LOTI slightly short of Scenario B. But for the crazyman daveburton such accounts of this situation (eg here at SkS) is but ” some people’s attempts to put lipstick on a pig”. Oink. Oink.
The crazyman’s own version of the outcome of Hansen et al’s projections is certainly no silk purse. He screen-shots a graph of HadCRUT4 1988-to-date from WoodForTrees ignoring the different anomaly base period for HadCRUT4, and then draws on a +1,5ºC increase 1988-2018 to represent Scenario A when Scenaio A was not representative of the post-1988 climate forcing outcome and even then only projected +1.0ºC temperature rise for the period 1988-2018. As I say,, this piece of work by the crazyman daveburton is certainly no silk purse. Oink. Oink. Well done him!!!
And did I tell you he once spoke to the famous Kerry Emanuel?
Al Rodger “This crazyman daveburton seems to have taken up residence here.”
Only because y’all are so friendly and welcoming.
jgnfld wrote, “Of course you know that Fourier himself proved that ANY continuous line of ANY shape can be decomposed into sine functions.”
That’s only true if there is no long term trend.
That actually does hold true for many things. But not for everything.
“I have no confidence that today’s sophisticated computer models of the Earth’s climate will look any better, in thirty years.”
Who cares about your confidence levels in the least? NO one is running the same models as decades ago in FORTRAN or any other language. It is the numerical methods in the libraries which have been carried through. This is not a bad thing. Actually, it’s often a quite good thing as “old” computer libraries have had time to reveal bugs and to provide many opportunities for further optimizations and bug squashing.
” It is the numerical methods in the libraries which have been carried through.”
I doubt climate prediction can be boiled down to a few “numerical methods”. If it could, then all the models, even the old FORTRAN ones, wouldn’t be continually failing so spectacularly.
I’m reminded of a relative of mine in the early days of computing, turned his mind with some of his colleagues to predicting horse racing. They fed years of data into their computer model, and came up with predictions that if bet upon, would have yielded vast sums of money. But then they did something smart, they fed a different period of data into their model, and the model failed and would have lost them a lot of money. I suspect if there were a betting pool on climate prediction, these modellers would be losing their shirts.
That’s not what I said but of course you choose to make up something I never said. I said the “musty old code” is neither musty nor out of date in any way as the FORTRAN libraries are where the old code resides. Long tested, long optimized code is a good thing not a bad thing.
The coding of the models is updated anew at regular intervals.
I should add, your notions of model validation are primitive and wrong. They are not “spectacularly wrong”. Making stuff up is a lie, you know.
It’s pretty naive to think that the only way to test climate models is to 1) make a prediction now, and 2) wait decades. After all, we now have decades of perfectly good past data–which a successful climate model should be able to characterize successfully. Oddly enough, professionals in the field actually *have* thought of that…
Kevin Donald McKinney wrote, “It’s pretty naive to think that the only way to test climate models is to 1) make a prediction now, and 2) wait decades. After all, we now have decades of perfectly good past data–which a successful climate model should be able to characterize successfully. Oddly enough, professionals in the field actually *have* thought of that…”
“Any damn fool can predict the past.”
-Larry Niven
All the models are “tuned” to reproduce historical data reasonably well. That tells you nothing about the accuracy with which they model reality, or their skillfulness at predicting the future.
If you believe the GCMs accurately model reality, then how do you explain the huge variation between them, for even the most basic climate parameters, like sensitivity to a doubling of CO2?
Here’s a table of such results, from the IPCC’s AR5 report (or as a .pdf):
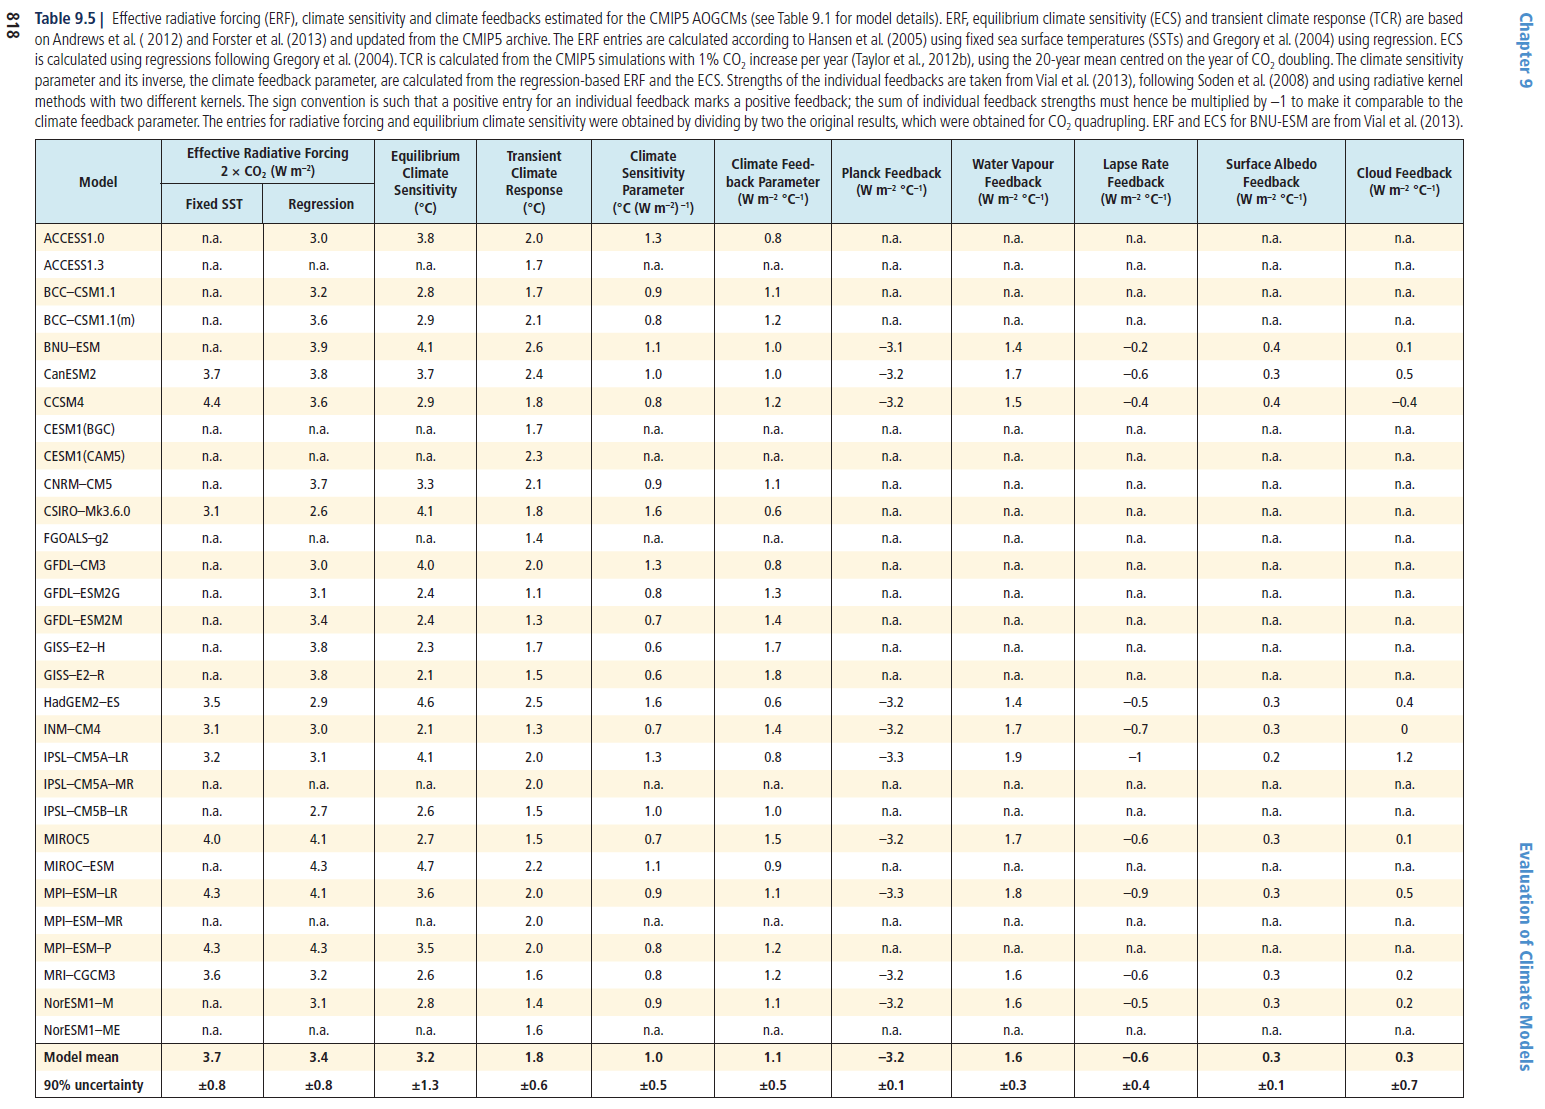
Note the enormous variation in the climate sensitivity values which those GCMs calculated! ECS 2.1 to 4.7, and TCR 1.1 to 2.6 °C / doubling of CO2.
bears repeating that all the models are wrong, but some/many are useful. You don’t need models to figure out that adding greenhouse gases to the atmosphere will increase global temperature. You don’t need a weatherman to know which way the wind blows. Trolls getting fed big time these days. Thank goodness for killfile so that I don’t have to even scan the worst of the trolls.
What makes you say that the various estimates vary “enormously”? They vary by the values stated. What are your standards for judging small versus expected versus large versus great versus really large versus enormous? What is your reasoning behind your definition of each level? Be specific and cite the expertise which allows you to make these judgements.
Persistent acceleration in global sea-level rise since the 1960s
Click to access s41558-019-0531-8.pdf
Dangendorf , Carling Hay, Calafat , Marcos, Piecuch, Berk and Jensen (2019)
“Previous studies reconstructed twentieth-century global mean sea level (GMSL) from sparse tide-gauge records to understand whether the recent high rates obtained from satellite altimetry are part of a longer-term acceleration. However, these analyses used techniques that can only accurately capture either the trend or the variability in GMSL, but not both. Here we present an improved hybrid sea-level reconstruction during 1900 2015 that combines previous techniques at time scales where they perform best. We find a persistent acceleration in GMSL since the 1960s and demonstrate that this is largely (~76%) associated with sea-level changes in the Indo-Pacific and South Atlantic. We show that the initiation of the acceleration in the 1960s is tightly linked to an intensification and a basin-scale equatorward shift of Southern Hemispheric westerlies, leading to increased ocean heat uptake, and hence greater rates of GMSL rise, through changes in the circulation of the Southern Ocean.”
Anything in the well respected peer review literature, with Dr. Carling Hay’s name on it, for the win.
Satellite altimetry sea-level data is fundamentally unreliable, and endlessly malleable. Aviso has a list of some of the things that can go wrong, here:
https://www.aviso.altimetry.fr/en/data/products/ocean-indicators-products/mean-sea-level/processing-corrections.html
One of the major problems is precise determination of the satellites’ location. Tide gauges are referenced to fixed geodetic markers, but there are no geodetic markers in space. NASA is aware of that problem, and to address it in 2011 they proposed (and re-proposed in 2014 / 2015) a new satellite mission called the Geodetic Reference Antenna in SPace (GRASP). The Europeans are apparently considering a similar mission (E-GRASP). But those missions have not flown.
The most dramatic revisions to satellite altimetry measurements of sea-level were to ENVISAT’s measurements. Here’s ENVISAT’s ten-year measurement record, before and after applying a correction:

Another example illustrating the malleability of the satellite altimetry data is a widely-publicized 2018 paper by U. Colorado’s Dr. Steve Nerem et al, which claimed to have finally discovered “acceleration” in the satellite altimetry measurement record of sea-level. What the press releases and news reports failed to mention was how they did it. They didn’t find an increase in the rate of sea-level rise. Instead, they created the acceleration by reducing the rate of measured sea-level rise in 20 year-old Topex-Poseidon data, thereby making more recent measurements appear to have accelerated, by comparison, as you can see here. The red concave-upward quadratic fit indicates acceleration; the nearly-straight previous version, in blue, indicates linearity (a lack of acceleration):

Here’s another well-known paper, by Cazenave et al, which illustrates the malleability of satellite altimetry measurements:
https://www.nature.com/articles/nclimate2159
They sought to explain away an apparent declining trend (deceleration) in the rate of sea-level rise measured by satellite altimetry. They managed to massage the data until that embarrassing decline had almost entirely disappeared. Here are two pairs of graphs from the paper, each with “before” and “after” versions, showing how they “corrected” the work of 5 (five!) different satellite altimetry analysis groups, to almost completely eliminate the decline, which all five groups had reported:


The bottom line is that “acceleration” which requires satellite altimetry sea-level data to detect it, and is not detectable in the best long coastal measurement records, is certainly insignificant, and probably not real.
Burton, you are only about five years behind the times, which does not surprise me at all.
You might at least try to understand what the most recent group of papers are trying to saying. That includes the linked to paper above.
“by reducing the rate of measured sea-level rise in 20 year-old Topex-Poseidon data”
That particular correction was first proposed by Watson, et. al. (2015). Just about everyone today accounts for that specific correction in the TP time series. Note to self: Dangendorf , et. al. (2019) has an incorrect reference in their SOM/SI, reference 60 should be reference 46 (the Watson paper).
You really should publish something in the peer reviewed literature if you want to get anything you say online noticed by the sea level rise experts. Otherwise, noone will give you the time of day. I would suggest submitting a paper to Scientific Reports, as they would appear to take any nonsense from anybodies and nobodies like you. Oh and change your name to Galileo Too.
daveburton,
So what are you babbling about now?
Your message seems to be that SLR acceleration has to be detectable using tide gauges because any
And of course, here “the best long coastal measurement records” are the ones which you choose to be “best” because they show no obvious acceleration.
Of course, your inability to test for acceleration, even significant acceleration, is quite evident. So your grand pronouncements on SLR derived from tide gauge data is not worth very much.
But that does leave your latest blather which is on the subject of satellite SLR records. How does you assessment run on that data? You tell us:-
You then link to a webpage which describes how “numerous perturbations have to be taken into account.” But in your crazy wolrd that becomes “some of the things that can go wrong” so suggesting there is no fix because your mission is to trash the satellite data. It shows obvious accelerating SLR and, hey, the “best” SLR data shows no obvious acceleration, by definition.
Running through your squealing objections to satellite SLR data.
(i) Satellites have to locate themselves in space relative to the planet surface, rather than being nailed to a rock in a cliff face like the good-old reliable tide gauges. The 10-page NASA reference you make does spend a paragrah describing the extra calculations needed within SLR records but these are not the primary problems within the examples you then go on to describe.
(ii) ENVISAT was an error now corrected.
(iii) Nerem et al (2018) lists satellite drift as the fourth and last of their considerations when looking for acceleration in the SLR data and note they do check their result against those ever-faithful tide gauges. You further link to the garbage-strewn planetoid Wattsupia which, no surprise, adds nothing other than garbage on the issue.
(iv) Cazenave et al (2014) is doing no more than quantifying the impact of non-AGW wobbles and showing how they overwhelm the underlying rate of SLR within the then-17-year-long satellite record. The work points the way to Nerem et al (2018).
Of course, my branding you, daveburton, as a crazyman doesn’t have to be the last word on this. If you feel you have a proper message that is worth saying, then say it.
But be advised, so far down this thread, from start to finsh, I see that “you evidently see the world in a way that is beyond my comprehension.” From your performance down this thread, it is likely your message will need a heck of a lot of adaption to gain acceptance within the real world.
Now I really know how full of it DB is. The Nat Geo cover is so obvious that it is evident that its purpose can not be to deceive, only to make a point in the same way that you would with a cartoon.There is no comparison possible. It is to attract attention to a very real problem. Your answer about the Waikiki pictures is not convincing at all. These pictures do not convey any information of value pertaining to see level, none. So why include them in the same post where you make an argument about that very subject? I’m not impressed.
Philippe Chantreau wrote, “The Nat Geo cover[‘s]… purpose can not be to deceive… [but rather] to attract attention to a very real problem.”
You (and they) assume that which is not in evidence; in fact, that which is at issue. That’s a circular argument: It’s not misleading for NatGeo to fake a picture of >200 feet of sea-level rise, to convince people that sea-level rise is a problem, because sea-level rise is a problem.
That’s a fallacious argument, no better than saying, “It’s not misleading to show fake pictures of rampaging zombies, to convince people that the zombie apocalypse is a problem, because the zombie apocalypse is a problem.”
Here’s the reality:
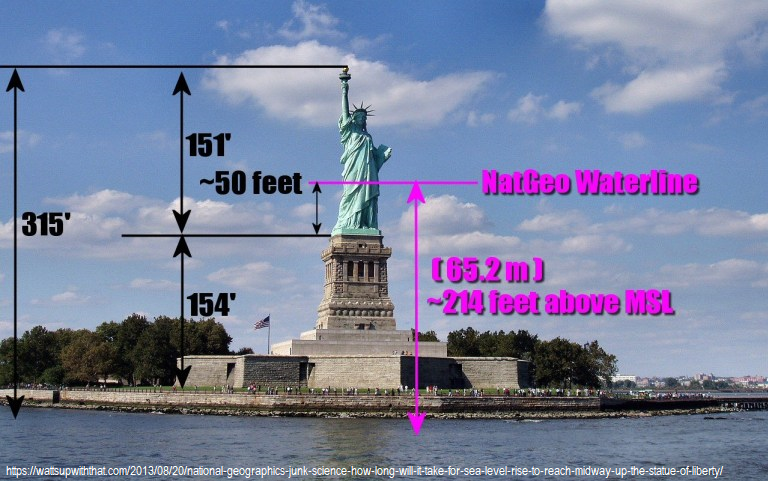
The issue is whether anthropogenically-caused sea-level rise really is a problem, let alone a problem that big.
The fake picture on the NatGeo cover depicted about 8½ times as much sea-level rise as we would get from melting the entire Greenland Ice Sheet, most of which did not melt even during the very warm Eemian interglacial.
https://www.sciencedaily.com/releases/2013/01/130123133612.htm
Click to access cp-14-1463-2018.pdf
But you don’t think that’s misleading?
The claim made by those who contend that sea-level rise driven by AGW is “a very real problem” is that it’s a problem because it threatens coastal communities. So, is it true?
Does sea-level rise driven by AGW really threaten coastal communities?
Photos of a 118½-year-old hotel built right on the beach, on an island with a very typical sea-level trend, seem pertinent to that question. If sea-level rise is really a problem, then why is the Moana Surfrider Hotel still there, after 118½ years and several hurricanes? Hurricanes Dot (1959), Fico (1978), and Iniki (1992) all failed to destroy it.
https://www.historichotels.org/hotels-resorts/moana-surfrider-a-westin-resort-and-spa/history.php
The answer is that the Moana Surfrider is still there after 118½ years and a 115 ppmv increase in CO2 level because Oahu’s very typical sea-level trend has totaled just seven inches of sea-level rise, which is too little to even notice in photos of the hotel.
The sea-level trend there continues to be almost perfectly linear, at 1½ mm/year, suggesting that the Moana Surfrider Hotel will see only about seven more inches of sea-level rise over the next 118½ years.
“If sea-level rise is really a problem, then why is the Moana Surfrider Hotel still there, after 118½ years and several hurricanes? Hurricanes Dot (1959), Fico (1978), and Iniki (1992) all failed to destroy it.”
Now you are really showing your ignorance!
None of those hurricanes (storm tracks) you mentioned came within even 100 NM of Honolulu. Plus Diamond Head provides a natural breakwater/jetty to the dominant direction of historical storm tracks.
Our people have done several dozen studies of the Hawaiian Islands. Our people wrote the book on coastal processes (sans SLR) called the CEM.
My rather meager contribution to said efforts …
Click to access a199879.pdf
Ha Ha Ha …

“Despite being one of Hawaii’s most iconic beaches, many visitors don’t know Waikiki Beach is actually an engineered beach that has been filled with imported sand for decades.
Waikiki has been facing erosion problems for years, and Hawaii lawmakers are pushing a bill to restore it.
The earliest beach replenishment projects date back to the 1920s, but the first major recorded project was in 1939. The state estimates that approximately 300,000 cubic yards of sand have been imported to Waikiki beaches over the past 75 years, often mined from other beaches in the state.”
That place is just littered with very old concrete jetty structures …

(Google Earth for a top (or plan) view to see old concrete jetty structures on BOTH sides of that hotel)
The waves, such as they are, are depth limited!
Nuisance flooding anyone?
NUISANCE FLOODING IN HONOLULU, HI: A CASE STUDY OF SUMMER 2017
Click to access Sanchez,%20Ashley%20SU18.pdf
Now the question becomes … wait for it ,,, as to why would anyone be so stupid and ignorant as to use Waikiki Beach WITHOUT doing their own proper homework first?
Burton? … Burton? … Burton? … Anyone? Anyone?
Forgot the 1st link …
http://coastalcare.org/2016/03/hawaii-bill-to-restore-waikiki-beach/
“A section of Hawaii’s famed Waikiki Beach is starting to erode, less than a year after the completion of a $2.2 million project to replenish the sand on about 1,730 feet of shoreline that had been suffering from chronic erosion.”
“Over the past several months severe erosion has caused a concrete slab near the water’s edge at Kuhio Beach to become exposed. Beach erosion in Waikiki has been a problem for decades and has resulted in at least 10 sand replenishment projects since 1939. 300,000 cubic yards of sand has been placed onto Waikiki Beach over the past 77 years.”
“Sea-level rise is a significant factor in the major shoreline change underway in Hawaii, where 52 to 72 percent of beaches on the chain of islands have eroded over the past century.”
In the case of Waikiki Beach, it is also likely that their beaches are now starved due to onshore and inland anthropogenic structures blocking the natural runoff of water and sediments (one would need to know the lay of the land (as it were) PRIOR to significant anthropogenic developments, say sometime before 1900, at least).
That hotel is still there because of the enormous efforts expanded over time to rebuild that beach, and only because of them. Sea level rise is a problem, regardless of your play on words. A circular argument is one in which causality forms a loop, which is not what you wrote. It is indeed ok to show even a doctored picture of sea level rise, because it is real, whether you like it or not. I am pretty sure also that tis particular picture corresponds to a given Antarctic loss scenario, as estimated by the best available science, although I haven’t looked at the NG issue to verify that. So, the cover would not be misleading if it was qualified accordingly. Nobody is setting up real life zombie response teams , while communities around the world are experiencing sea level rise, abandoning villages and loosing arable land. Zombies have not forced anyone out of their home, and are not real. You are still full of it. Funnily, every time you write you manage to give yourself some appearance of legitimacy (except the zombie argument, which is stupid) and then again you throw ridiculous BS around, like the hurricane argument. Sorry, I can’t take you seriously
Yup, according to teh wiki …
https://en.wikipedia.org/wiki/Waikiki
https://en.wikipedia.org/wiki/Moana_Hotel
“The area was a retreat for Hawaiian royalty in the 1800s who enjoyed surfing there on early forms of longboards.[2]
A few small hotels opened in the 1880s. In 1893, Greek-American George Lycurgus leased the guest house of Allen Herbert and renamed it the “Sans Souci” (French for “without worries”) creating one of the first beach resorts. Later that year Robert Louis Stevenson stayed at the resort; subsequently it became a popular destination for mainland tourists.[3] The area at coordinates 21°15′49″N 157°49′17″W is still called “Sans Souci Beach”.[4]
Waikiki has had erosion problems since the late-1800s, because hotels and homes were built too close to the natural shoreline, while seawalls and other structures blocked the natural ebb and flow of sand along the beach. By 1950, more than 80 structures, including seawalls, groins, piers and storm drains, occupied the Waikiki shoreline.[5]
The area became filled with large resort hotels, such as the Hilton Hawaiian Village, Halekulani, the Hyatt Regency Waikiki, Marriott Waikiki, Sheraton Waikiki, and historic hotels dating back to the early 20th century (such as the Moana Surfrider Hotel and the Royal Hawaiian Hotel). The beach hosts many events, including surf competitions, outdoor performances, hula dancing and outrigger canoe races. The many amenities, shops, and hotels enable Waikiki to generate approximately 42 percent of Hawaiʻi’s visitor revenue.”
“The Moana Hotel is a historic hotel building on the island of Oahu, at 2365 Kalākaua Avenue in Honolulu, Hawaii. Built in the late 19th century as the first hotel in Waikiki, the Moana opened in 1901.”
So now I would need historical records (maps, elevations, bathymetry, runoff sources/sinks, sedement supply, longshore transport, onshore/offshore transport, wave climatology, water levels, currents, etceteras) dating from at least the 18th century. But I seriously doubt that the necessary historical records exist that a modern coastal planner would need to see Waikiki in its natural or baseline conditions. Kind of like saying, well there was a beach there at one time, that level of prior knowledge, if you know what I mean.
My bad.
Jetties is a little bit of a misnomer, it should be shore perpendicular groins and shore parallel breakwater-like groin structures. Their intention is to stop shoreline erosion, but they almost always don’t work, so you get dump trucks full of sand every decade or so to maintain their erosive nature.
The beach will try to maintain a stable profile, meaning most of that dump trucked sand ends up offshore, then goes alongshore never to be seen again, sea level rises a millimeter the whole bathymetry goes up a millimeter. Rinse and repeat until you end up building seawalls.
Everett wrote, “Now the question becomes … wait for it ,,, as to why would anyone be so stupid and ignorant as to use Waikiki Beach WITHOUT doing their own proper homework first?
Burton? … Burton? … Burton? … Anyone? Anyone?”
You know, sometimes if feels like I’m talking (er, typing) to a wall.
I’ve twice written:
How can that be unclear??
But thanks for the excellent links, anyhow.
Everett wrote, “…shore perpendicular groins and shore parallel breakwater-like groin structures. Their intention is to stop shoreline erosion, but they almost always don’t work,”
There is one case where perpendicular jetties or groins do work well. That’s what is called a “terminal groin.” (That sounds like an especially gruesome sports injury, doesn’t it?)
If there’s a prevailing current along the beach, A perpendicular jetty or groin will cause sand buildup on one side, and sand loss on the other. So a jetty may protect your house on the up-current side, but cause your neighbor’s house on the down-current side to wash away.
But in some cases the sand loss on the down-current side may actually be desirable, such as when on the down-current side there is a channel or navigable inlet. In such cases, a jetty on the up-current side both protects the beach there from washing away, and protects the channel from filling in. Those jetties are called “terminal groins.”
There are other options, which are designed to address such issues. Holmberg undercurrent stabilizers are sort of like jetties, but shorter. They stay below the surface, and reduce but don’t completely eliminate sand migration.
Unfortunately, some people reflexively oppose any and all engineered solutions to beach erosion, including Holmberg devices, and even terminal groins. So, unfortunately, in many places regulatory constraints mean the only thing you can do about an eroding beach is retreat.
This is a classic 1965 educational film from Encyclopedia Britannica Films and the American Geological Institute, courtesy of the LSU Center for GeoInformatics:
Beach: A River of Sand
It explains how sand beaches are affected by manmade structures and the forces of nature. (Note: It is 20 minutes long at normal speed, but it is very watchable when sped up to at least 1.5× normal.)
Everett F Sargent,
The state of the beach in front of some Hawaiian hotel is not actually germaine to SLR. (Of course, the crazyman daveburton is entirely fluent in beach-speak as it allows him to make Captain Sensible pronouncements while entirely dodging the actual subject at hand which is SLR.)
And it is rather strange that this crazyman daveburton is still here on this thread when our host has presented him with a whole thread of his own which debunks his daveburton collection of apparently-zero-acceleration Tide Gauge graphs by showing how apparently linear SLR can hide acceleration. It even includes the subject of this particular discussion – the Honolulu SLR.
There are a number of arguments that crazyman daveburton could legitimately raise in SLR discussion (on either OP’s thread) but instead he his happier here moaning about some apparent politicisation of science and swapping note with the troll fred747.
..
Concerning the issue at hand, the SLR at Honolulu has yet to exceed the variations caused by the El Niño. This global map of satellite SLR 1992-2014 actually shows Hawaii with zero SLR through that period. And a check on the tide gauge data shows the same. Since 2014, the tide gauges have captured a big wobble that is discussed by our host on that other thread.
It is by selectively using long tide gauge data that crazyman daveburton hides what is evident – an acceleration in SLR. This bogus use of data is coupled with such nonsense as his collection of papers “which have reported the lack of acceleration in rate of sea level rise.”
A quick peek at his list shows contradiction piled high. Starting at the end of the list (being the most recent) we see:-
♥ A denialist paper Parker & Ollier (2018) which uses just two tide gauges to assert that “Since the start of the 1900s, the sea levels of the Pacific Ocean have been remarkably stable.” On other words SLR in the Pacific is zero. (Wasn’t there some comment down this thread saying you shouldn’t use tide gauges to infer SLR across an entire ocean?)
♥ Then there’s Mörner (2017) where another swivel-eyed denialist concludes “The global perspective is general stability to a minor rise with variations between ±0.0 and +1.0 mm/yr” which is actually the finding of Mörner (2016), the next reference in the crazyman’s little list. (Doesn’t this “between ±0.0 and +1.0 mm/yr” contradict the arguments of our crazyman? His grand work (Burton 2012) turns to the findings of Houston & Dean (2011) who put global SLR at a constant 1.7mm/yr.)
♥ Then there is Fasullo et al (2016) which is a proper paer. (It actually sets the scene for Nerem et al (2018) which our crazyman tries to rubbish up-thread.)
Al Rodger wrote, “And it is rather strange that this crazyman daveburton is still here on this thread when our host has presented him with a whole thread of his own …”
Really?? First I’ve heard of it. I’ll take a look.
Labelling an argument as “outlandish” and the author as a “known denialist”, is about as weak as saying “I only time to have a mutual wank fest with my fellow pointy headed academics with our snouts in the government trough”.
Nor do I see any links here “exposing dishonest science”. What I do see are a bunch of graphs that look pretty linear from the last century. You can squint and argue about the finer statistical details, but there’s very little to see.
fred747, science is clearly an alien, inimical culture to you. Your description of climate scientists betrays a profound distrust of a class of people you clearly know little about. Like many anglophone deniers of anthropogenic climate change, you appear convinced that only political ‘liberals’ or ‘environmentalists’ accept the overwhelming consensus of climate specialists (that is, experts), which means the experts themselves, all ‘pointy-headed’ liberal parasites who couldn’t succeed at anything else, must be wielding science in the service of culture war. Ironically, you don’t hesitate to wield a speciously ‘sciency’ article, an explicit polemic by a proven climate-science denier, against the lopsided consensus of his ostensible peers. Does that sound about right?
You have it backwards. Global climate change is already affecting literally everyone on earth, regardless of political ideology. And science isn’t a useful weapon of culture war, because it’s a way of not fooling ourselves. Some climate scientists are, or at least used to be, Republicans! Science may not work for everybody all the time, but it’s still the only method we’ve invented to explain and predict the universe (i.e. ‘reality’) that’s more successful (look around you) than divination with a sheep’s liver. That’s because, as Feynman said, “the first principle is you must not fool yourself”. Scientific research requires rigorous training and self-discipline. Mastery of measurement and statistics is essential, to sort what’s real from what merely looks that way to your Mark I eyeball. And because “you are the easiest person to fool” (think about it), science relies on intersubjective verifiability: “peer review” in its broadest definition. It’s fundamentally a collective enterprise, conducted by trained, disciplined, competitively skeptical individuals who recognize their peers by the quality of their work, and won’t let them get away with fooling themselves.
If you trained for a scientific research career you’d understand: professional scientists are, by and large, motivated by peer recognition far more than by money. “Pure” research, with no expectation of immediate positive ROI, is government-funded as a public good. Consequently, few academic investigators enjoy more than a modest income. I, for one, pursued a life-long, geeky fascination with “natural history” as far as enrolling in a PhD program in Ecology and Evolutionary Biology, but dropped out and changed careers because I didn’t want to work that hard for a living! It isn’t any easier for climate scientists, whatever anyone tells you. Any serious money to be made is in showing that the globe isn’t warming, or it is but it’s not due to our fossil carbon emissions, or it is but it will be more ‘good’ than ‘bad’, or it will be bad but doing something about it would cost (somebody) ‘too much’. Although the current political climate of the US favors it, the failure of that money to produce verifiable scientific results is telling.
Unlike science, politics is a way of trying to fool us, often for ulterior yet readily inferred motives. Follow the serious money. Anyone who thinks the consensus of thousands of trained experts around the world is “a mutual wankfest of pointy-headed academics with their snouts in the government trough” has been fooled. And please, fred747: try to understand that your inadequate scientific preparation is plainly evident to the rest of us. No, of course it isn’t to you, because you are the easiest person to fool. Ever hear of the Dunning-Kruger effect?
BTW, does your browser not highlight links?
MANY scientists were republican back in the pre-Reagan era of Main St. republicanism. Since Reagan, the corporate/Wall St. takeover of the right has driven most every scientist out of the republican party. It’s not that the scientists’ values changed, it’s that the republican party values changed.
The scientists never left the republicans, the republican party left anything that scientists could support.
jgnfld wrote,
“MANY scientists were republican back in the pre-Reagan era of Main St. republicanism. Since Reagan, the corporate/Wall St. takeover of the right has driven most every scientist out of the republican party.”Let me help you with that:
MANY Christian and Republican scientists were in academia even as late as the 1970s. But since the Left’s takeover of the academy, most Christians and Republicans have been driven out, and now make their careers in private industry.
There, I fixed it for you. You’re welcome, jgnfld.
Most of today’s universities are overtly hostile to conservatism, and often hostile even to simple rationality. Ref. exhibits A, B, C, D & E:
Exhibit A:

Exhibit B:
Exhibit C:

Exhibit D:
Exhibit E (follow-up to Exhibit D):
https://www.thecollegefix.com/portland-state-bans-professor-from-research-for-getting-grievance-studies-hoaxes-published/
I hope it is obvious why few Republican scientists will put up with what leftist leadership has done to the universities. Who wants to live his career in an ideological straitjacket tailored by people who hate him? That’s why some people, who are cloistered in an academic bubble, think that “most every scientist out of the republican party.”
It’s not that most scientists have left the Republican party. Many excellent scientists are Republicans. It’s simply that the scientists who those people know are all academics, and none of them are Republicans. That’s because the Republican scientists have left academia, rather than leaving the GOP.
Just take your exhibit A, dave. You claim to know what the lecture is about. What is the subject of the lecture? How do you know that the statements on that slide support your belief that academia has been taken over by “the Left,” and if you manage to explain what the lecturer’s statements mean, then explain what “the Left” is in climate science.
“support your belief that academia has been taken over by “the Left,”
Martin Smith: Must one really prove to you that the scientific establishment is corrupted by leftism?
As for what is leftism, one could write a lot on that, but we can see that leftism is against free speech, which is fundamental to science. It is also intolerant, in that it will form rage mobs to stop people speaking on campus who believe differently to the consensus. They are collectivists, who value consensus over individual belief. They value emotion over reason, such that they will deny or suppress any fact, if it hurts somebody’s feelings. In short, leftism emcompasses all the things that damage science. Which would be fine if it was like 50% of academia. However it has become like 95% academia, who is wielding their collectivist, rage-mob, feeling based ideology as a weapon against anybody who they perceive as a heretic against their orthodoxy.
fred747 writes: “Must one really prove to you that the scientific establishment is corrupted by leftism?”
fred, I didn’t ask for your opinion;I asked daveburton to explain and justify just his use of his Exhibit A. He either would not or could not do it, and now neither have you. Instead, you tried to change the subject, by asking the irrelevant question above. So both you and daveburton can’t explain and justify his Exhibit A. daveburton used it, and all his other Exhibits, to obfuscate and, like you, direct the discussion away from the argument, which he lost (or continues to lose)
Now to your question above. Yes, you must really prove that “the scientific establishment is corrupted by leftism.” But please confine your proof to only the scientific establishment of climate science. The blog you linked links to what might be a published paper, but that paper does not prove your claim. It says:
“We suggest that conservatives’ diminishing trust in scientists reflects the fact that scientists in certain fields, particularly social science, have increasingly adopted a liberal-activist stance, seeking to influence public policy in a liberal direction.”
It “suggests” something, fred. It doesn’t prove it. And what it suggests says nothing about corruption. Nor does it say anything about “leftism,” which you have not defined. The paper SUGGESTS that SOME scientists in SOME fields seek to influence public policy in a liberal direction. Having a political point of view is not corruption. Nor does having a political point of view mean the science done by these scientists is corrupted.
So, yes, you must really prove to us that the scientific establishment in climate science is corrupted by leftism. You haven’t even provided any evidence of it yet. Just prove it with the scientists listed here: http://www.realclimate.org/index.php/archives/2004/12/contributors/
I think we can agree they are all in the scientific establishment in climate science. Prove to us they are corrupted by leftism.
jgnfld,
Yep. Highly cited MIT tropical cyclone expert Kerry Emanuel, for example, as quoted in 2014:
daveburton:
Heh. As daveburton and I agree, at least some excellent scientists are Republicans, although most are academics, and I doubt we agree on which of them are excellent. Tamino’s regulars, if not daveburton, are aware of the Evangelical Declaration on Global Warming, which states:
IOW, “To Hell with the evidence, we can’t believe our God would let His children damage His Creation.” The declaration is promulgated by the Cornwall Alliance, which makes much of the few prominent pseudo-skeptics with scientific credentials among the signers, e.g. Roy Spencer. Spencer’s close academic colleague John Christy, though not a signer, is public about both his evangelical religion and his support for the Alliance. Some of Christy’s scientific colleagues feel both he and Spencer are capable of good work; others, including Barry Bickmore, academic geochemistry professor, active Mormon and Republican, have been less respectful.
Ironically, the Cornwall Alliance (or “cornball alliance”, h/t Russell Seitz) and its scientific supporters have serious doubts about another professed evangelical Christian and Republican academic climate scientist, Katherine Hayhoe. Her participation in the consensus of her scientific peers, and her outreach to co-religionists on its behalf, are dangerously heretical in their view.
Mal, Dr. Emanuel came to Raleigh in 2015, at the invitation of my friend, meteorologist Greg Fishel, and we chatted briefly.
I told him that I didn’t trust the GCMs (climate models) because, like weather models, they try to model systems of immense complexity, which are poorly understood, but, unlike weather models, they make predictions for decades into the future, which means they’re untestable. I asked him how skillful he thought the weather models would be if they weren’t being constantly compared against measured reality, and refined accordingly?
He acknowledged that concern, and said something to the effect of, “that’s why we use five different GCMs, and average them.”
Now, I ask you, what kind of an answer is that??
Everyone knows that if you average good data with garbage, you get garbage. But he thinks that if you average garbage with 4× more garbage you get good data??
IF you had five different modeling groups who all worked independently from one another, never talking to one another, never reading one another’s papers nor running one another’s code, and calibrating their models against five different sets of historical measurements, then there could be value in Dr. Emanuel’s approach, because you could have some reasonable hope that the errors in the models were independent. But, of course, none of those prerequisites are true, so there’s no basis for hoping that the errors in the models are independent. The approach is based on wishful thinking.
“Everyone knows”
Now THERE’s a bit of solid scientific “reasoning”!
Mal Adapted: I haven’t seen convincing and properly researched evidence that there is an “overwhelming consensus” of climate scientists that global warming is real and man made. Every time one looks into such a claim it looks bodged up. But let’s say for the sake of argument this evidence is out there. When we live in an academic environment when you are fired for questioning orthodoxy, how can anybody take this supposed consensus seriously? It Is Difficult to Get a Man to Understand Something When His Salary Depends Upon His Not Understanding It. We live in an age, much like Galileo did, where to come out and deny the orthodoxy is career suicide. We live in an age when universities teach that biological sex is not a real thing, and to say so makes you a bigot and anti-science. And when the academy becomes packed with weak minds, and purged of contrarians, you get a fake agreement among people who fabricate a consensus by banning dissent
And who is responsible for this state of affairs? People like you who wield the term “proven climate-science denier” as if it was a term synonomous with racist or paedophile, rather than saying here is someone with an alternative hypothesis.
As for climate change affecting everyone on earth, yes it has for hundreds of millions of years, but that’s not the argument.
My question for you is, why do you corrupt the scientific discussion by turning it into a political/religious discussion, thus making regular bystanders like myself who are looking on, think that the system is corrupted.
fred747:
I think I see your problem: you might be the least self-aware ‘conservative’ culture warrior ever to troll Tamino’s blog. Look, science is a way of trying really hard not to fool yourself, but first you have to acknowledge that you might fool yourself, and then you have to try really hard not to! Consensus claims look “bodged up” to you because you’re content to fool yourself. For as much as 97% of the members of the international peer community of climate specialists and all self-aware non-experts, OTOH, they’re long settled, within quantified uncertainty limits, by iterative debate in specialist venues of record. Nearly 200 years after Fourier, the evidence for anthropogenic global warming is voluminous, and consiliently wide-ranging. To a trained and disciplined competitive skeptic, it’s redundantly probative. If you possessed a minimum of what Texas State Climatologist John Nielsen-Gammon calls scientific meta-literacy (https://blog.chron.com/climateabyss/2013/02/scientific-meta-literacy, in case your browser can’t detect marked-up hyperlinks), you’d have some hope of freeing yourself from the Dunning-Kruger effect (https://en.wikipedia.org/wiki/Dunning-Kruger_effect) enough to make progress. You clearly don’t, so you’ll never be able to tell genuine from fake climate expertise or properly researched evidence from pernicious nonsense; nor ever suspect how foolish you appear to more meta-literate interlocutors. Good grief, man! Keep it coming, I’ve got time.
fred747:
That’s some of the most flagrant tu quoque projection I’ve yet seen on this blog, even from a climate-science denier. You just got done truculently taunting:
fred747:
Well, ignoring the tired old hate on anyone with earned expertise (https://www.chronicle.com/article/From-Snobs-to-Pointy-Headed/130960), that’s how science works. It’s up to Parker/Boretti’s academic peers to collectively judge his work by professional standards of rigor. It’s fair to say Tamino is a member of that community, while you and I are not. Remember, science is a collective enterprise by trained, disciplined, competitively skeptical individuals, or ‘peers’. Many but by no means all climate scientists have academic faculty posts; others are employed by field-based agencies like the USGS or NOAA; still others work for fossil fuel producers. Have you ever attended the fall meeting of the American Geophysical Union? Tamino and his peers, individually and collectively yet more so, know things about climate we don’t, from looking at all verifiable evidence in context and talking about it whilst standing before an audience of wickedly smiling, professionally skeptical colleagues who don’t want him to be right because they didn’t think of it first – hoo, boy (https://www.rifters.com/crawl/?p=886)! They’re made of sterner stuff than I am. An unwary soi disant ‘regular bystander’ can be misled by reflexive resentment of people who know things he doesn’t. Next, you complain:
fred747:
Huh. Maybe you can’t afford a beach house, but why single out the Obamas? Is it because you don’t like their politics, or some other reason? Lastly, you dodge other people’s efforts to ascertain the factual foundation of your assertions:
fred747:
Uh, yes. Or are you asking us simply to believe you? Unless, that is, you want us to believe you’re here solely to wage war on your strawman cultural enemy ‘the scientific establishment’, by any means necessary. Otherwise, bring a bill of particulars specifically against climate science. You’ve got a lot to learn, but I’m obviously not going to teach you. You’re much better off conversing, politely to be sure, with Katherine Hayhoe, Kerry Emanuel and other current or former Republican climate specialists who support the consensus. With the links you were previously provided with, they shouldn’t be hard to find. Be aware, however, that your prejudice might be challenged, politely or not.
O wad some Power the giftie gie us
To see oursels as ithers see us!
It wad frae mony a blunder free us,
An’ foolish notion:
What airs in dress an’ gait wad lea’e us,
An’ ev’n devotion!
-Robert Burns (http://www.robertburns.org/works/97.shtml)
fred747:
I think I see your problem: you might be the least self-aware ‘conservative’ culture warrior ever to troll Tamino’s blog, and there have been some swivel-eyed loons here. Look, science is a way of trying really hard not to fool yourself, but first you have to acknowledge that you might fool yourself, and then you have to try really hard not to! Consensus claims look “bodged up” to you because you’re content to fool yourself. For as much as 97% of the members of the international peer community of climate specialists and all self-aware non-experts, OTOH, they’re long settled, within quantified uncertainty limits, by iterative debate in specialist venues of record. Nearly 200 years after Fourier, the evidence for anthropogenic global warming is voluminous, and consiliently wide-ranging. To a trained and disciplined competitive skeptic, it’s redundantly probative. If you possessed a minimum of what Texas State Climatologist John Nielsen-Gammon calls scientific meta-literacy (https://blog.chron.com/climateabyss/2013/02/scientific-meta-literacy, in case your browser can’t detect marked-up hyperlinks), you’d have some hope of freeing yourself from the Dunning-Kruger effect (https://en.wikipedia.org/wiki/Dunning-Kruger_effect) enough to make progress. You clearly don’t, so you’ll never be able to tell genuine from fake climate expertise or properly researched evidence from pernicious nonsense; nor ever suspect how foolish you appear to more meta-literate interlocutors. Good grief, man! Bring it, I’ve got time.
fred747:
That’s surely some of the most flagrant tu quoque projection I’ve yet seen on this blog, and there have been some pieces of work here. You just got done truculently taunting:
fred747:
Well, ignoring the tired old hate on anyone with earned expertise (https://www.chronicle.com/article/From-Snobs-to-Pointy-Headed/130960), that’s how science works. It’s up to Parker/Boretti’s academic peers to collectively judge his work by professional standards of rigor. It’s fair to say Tamino is a member of that community, while you and I are not. Remember, science is a collective enterprise by trained, disciplined, competitively skeptical individuals, or ‘peers’. Many but by no means all climate scientists have academic faculty posts; others are employed by field-based agencies like the USGS or NOAA; still others work for fossil fuel producers. Have you ever attended the fall meeting of the American Geophysical Union? Tamino and his peers, individually and collectively yet more so, know things about climate we don’t, from looking at all verifiable evidence in context and talking about it whilst standing before an audience of wickedly smiling, professionally skeptical colleagues who don’t want him to be right because they didn’t think of it first – hoo, boy (https://www.rifters.com/crawl/?p=886)! They’re made of sterner stuff than I am. An unwary soi disant ‘regular bystander’ can be misled by reflexive resentment of people who know things he doesn’t.
Apologies for duplicate posts. I was up too late.
fred747 noticed, ” What I do see are a bunch of graphs that look pretty linear from the last century.”
True. In fact, not only are they pretty linear from the last century, in some cases they’re linear even from the century before that. Here’s an example from the Dutch, who’ve done an especially good job of monitoring sea-level, in this case for over 150 years:
https://sealevel.info/MSL_graph.php?id=Harlingen&boxcar=1&boxwidth=4

There’s not a single month missing in that measurement record, since January, 1865! Hats off to the Dutch!
(Note: Peltier estimates that Harlingen experiences 0.56 mm/yr of subsidence, but I don’t believe that can be correct.)
fred747 continued, “You can squint and argue about the finer statistical details, but there’s very little to see.”
The finer statistical details are that there’s been no detectable acceleration in the rate of sea-level rise at Harlingen in 1½ centuries. However, some other locations did see a little bit of acceleration sometime between about 1850 and 1930. The location with the greatest acceleration was Brest, France, but even there the rate of sea-level rise only increased by about 1.5 mm/year.
fred747 wrote: “Nor do I see any links here “exposing dishonest science”.”
The link was directly above your comment. Here is the link again:
Hmm… that article tries to make the case that the paper was “making things up”.
But it looks like that article is fairly clearly “making things up”. Take this comment:
” They got caught, which is why one of the authors (M. Lawson) has disavowed the paper ”
There is no evidence that Lawson was motivated to do anything because some formula in the paper was “made up”. There is no admission of that. This factoid is “made up”. And actually, there is no evidence that Lawson “disavowed” it, which is a word meaning “to deny any support for”, especially since he is quoted at the bottom supporting aspects of it.
This may all seem like nitpicking a blog article that has gone over the top in polemics that this is “the biggest embarrassments in modern science.”. But the point is, anybody can do a one sided forensic look at something, point out some lies, and leave it at that. The data in that paper in large part speaks for itself.
fred747 wrote: “Hmm… that article tries to make the case that the paper was “making things up”.”
The article DOES make that case, fred. It proves it.
fred747 wrote: “Nor do I see any links here “exposing dishonest science”.”
The link that exposes the dishonest science is STILL directly above your comment. Here is the link again:
You have two choices: Either Either refute the case made by the article, or admit you are wrong. The honorable way to admit you are wrong is to say it in print here. The normal way for deniers is to change the subject like you just tried to do.
“What I do see are a bunch of graphs that look pretty linear from the last century.”
You might want to have your eyes checked.
Heh. I would, if that was all I saw.
if you stare at the earth horizon, it looks pretty flat, yet there are a lot of people who are convinced the earth is round. What are your thoughts on this question, Fred?
Just as in your sea level drivel, lots of nice cherrypicking and many factoids hand picked to mislead any proper inference-making. And a goodly amount of poor little conservatives suffering at the hands of those nasty mean liberals added in. But there is a problem: You aren’t addressing practicing natural science researchers or the profession of science. And certainly not the breadth of academia.
To wit: Your “exhibits” are uniformly about non natural science research. Your “survey” of “many good scientists” (should you read it even cursorily which you obviously did not) doesn’t actually measure practicing scientists but rather the public in general. Yet you then want to infer this relates to “many good scientists”. This is just as properly logical as your other cherrypicked factoids. BTW, many cranks are very well informed about science in general. That doesn’t stop them from being cranks in a particular area. In fact it tends to reinforce their crankery more deeply. And it is pretty obvious you’ve never been to a school of engineering or business or some political science departments where confirmed conservatives may even outnumber confirmed liberals in many universities by a goodly margin. Hell, physics departments used to have lots of conservatives until the “conservative” lockstep thinking since Reagan became rampant.
I was in academia and research from the time I consistently voted republican pre-Reagan (did return once for Poppy Bush, never again) till a couple of years ago. I certainly observed no “takeover” of any natural science at all by nasty liberals who then ran off the poor innocent conservatives. The process, as alluded to in the previous paragraph, was much more not being able to handle toeing the required party line when it flew in the face of observable facts and so simply giving up on that party since it was worthless to continue.
As another example, evolution isn’t “liberal” either. It’s a very widely-encompassing scientific explanation for clearly observed facts. And it’s quite true that conservative creationists tend not to get many grants in biology nor advance professionally in biology departments. So I guess you would argue they were somehow “driven out” by the nasty Godless liberal secularists. But that is hardly some sort of liberal conspiracy. It’s the way the scientific profession works…something you clearly have no idea whatsoever of except from reading political tracts.
Anyway, that’s all I have to say re. your points and I won’t post further off topic.
jgnfld wrote, “I was in academia and research from the time I consistently voted republican pre-Reagan… till a couple of years ago.”
It shows. Pretty much only people living in the academic bubble have the impression that “most every scientist” has left the Republican Party.
jgnfld wrote, “Your “survey” of “many good scientists”…”
Please don’t put words in my mouth. I did not say that link was to a survey of good scientists.
It’s to evidence that science education (and to a lesser extent science literacy) are positively correlated with skepticism of climate alarmism, as is political conservatism. I hope it is obvious to you that that could not be the case if “most every scientist” had left the only significant conservative political party in the USA.
jgnfld wrote, “Your “exhibits” are uniformly about non natural science research.”
No they aren’t. Do you see “non natural” in Exhibit A, B or C? Exhibits A & C are about science in general, and B uses climatology as its primary example.
Exhibits D & E are, indeed, both about an example in the non-natural sciences, but for Exhibit E (about the persecution of Peter Boghossian) I could just as easily have used a link about the persecution of a someone in the natural sciences.
If you think the problem of academic leadership fiercely hostile to conservatives and conservative ideas doesn’t exist in the natural sciences, it’s just proof of how disconnected you are from conservatism.
For example, Princeton Physics Prof. Will Happer is an extraordinary scientist, who has personally revolutionized two scientific fields, one of which you’ve certainly heard of. (His innovation been called “…perhaps the most spectacular, revolutionary advance in ground-based astronomy since the invention of photography.”) I first met him in 2014, when he came to UNC to teach a colloquium in the Physics & Astronomy Department:
But some people tried to prevent that colloquium from ever happening. There was a campaign among the tenured faculty to have his invitation rescinded, to stop him from teaching that colloquium at his undergraduate alma mater.
To his credit, the Department Chairman refused to do so, but can you imagine such a thing being attempted to suppress a liberal professor? Of course not.
The division is not between natural sciences and social sciences, it is between politicized fields and non-politicized fields. To the extent that a conservative remnant survives in the academy it is in non-politicized fields, like most engineering disciplines, and in a handful of stubbornly conservative institutions, like Hillsdale College.
The more heavily politicized a field is, the more overtly hostile the academic leadership in that field is to conservatives, the more thoroughly locked out conservatives are from faculty positions — and the more likely the field is to be dominated by crackpottery.
Speaking of 30 year old GCMs and their accuracy:
Exxons (yep, the oil company) GCM from 1982 must have been pretty good, though, as its predictions pretty much nailed the actual development of the CO2 concentration in the atmosphere for the next 37 years.
Their estimates for the corresponding GMT increase turned out to be rather impressive as well.
They issued warnings about increasing sea level too. Naturally.
Click to access 1982%20Exxon%20Primer%20on%20CO2%20Greenhouse%20Effect.pdf
We have to wonder why they kept these predictions from the public, but
they seriously deserve a Nobel price for that 1982 report.
Now, that would cause a stir.
Dave Burton, My we have a rightwing nutjob culture warrior as well as a climate denialist. Why am I not surprised?
WRT your various examples:
Exhibit A: Is it seriously your contention that science is not a social construct? If so, where did it come from? Divine intervention? Humans have developed science as a way of divining truth despite our perceptional, cognitive and social biases. It works amazingly well. You should try it. That doesn’t change the fact that it is a cultural construct.
As to race, there is more genetic diversity between tribes in Africa than between “races” in the US. Certainly, there are differences between different cultural groups–that is one reason why medicine generates less positive outcomes for black people in the US than for white people–black people tend to be under-represented in the trials. The same is true for sex. The social construct part comes when we exaggerate the importance of those differences far beyond their actual significance.
As to your other examples, I don’t see anything that is at all a compelling defense of your contention of “leftist bias” in science. If this is the quality of logic you embrace, I think we can safely dismiss anything you have to say without even examining it–and that, long before you cite climate crank, Will Happer as an authority.
snarkrates wrote, ” Is it seriously your contention that science is not a social construct?”
Wrong. Science most certainly is not a social construct. Science is the application of an algorithm called the Scientific Method, to discover things about the physical world.
Would someone here like to tell snarkrates about the Scientific Method? I would do it, but I fear that he wouldn’t take the word of a “rightwing nutjob culture warrior as well as a climate denialist.”
Re. “Science is an algorithm”
This is just plain silly and shows a complete ignrance of how science works. First off if it were 100% an algorithm then computers could replace scientific research as no judgement would be required…algorithms being mechanical after all.
Second it sounds as if you must have memorized the steps of the hypothtico-deductive model and think that you understand scientific inference (hint: the steps are fine for high schoolers but not much beyond that). Lecturing professionals about their profession takes a lot of Dunning-Kruger. Kinda like fans who think they know more about football than a professional coach or player. I have run across a lot of Philosophy 101 students who do this after reading a Popper paper. They are eqially ignorant about how science actually works. They would do well to at least read Pepper first. And a few more sources.
Third what science is and has been since the Enlightenment involves a consensus of the qualified–that is a social construct not an algorithm. If knowledgeable peers cannot be convinced then the findings don’t constitute much of anything. Certainly not accepted science. If you are not a knowledgeable peer your opinion is worthless and properly ignored. The old Einstein and Galileo arguments so beloved by deniers founder here. If either had been unable to convince qualified peers their work would have been ignored in place of others mining the same area sooner or later (or an equivalent mapping of it).
For example it is unlikely that showing pictures of Scapa Flow from a high altitude and acute angle will make a professional do more than label you a crank. Correctly so when there is measurably more water in the modern picture you call “evidence” of no rise (which it isn’t in the first place BTW).
Anyway keep the blinders on.
daveburton:
What puzzles me is why daveburton thinks he knows what ‘the Scientific Method’ is, and supposes himself its keeper. His view seems ahistoric. Does he think nothing has changed in 500 years? Are analyses, e.g. by Kuhn or Oreskes, of how diverse scientists actually do their work and establish their disciplinary sub-cultures, too post-modern for him?
Clearly, neither daveburton nor fred747 gets the ‘intersubjective verification’ part of any successful scientific method. What about “the first rule is you must not fool yourself, and you are the easiest person to fool” do they not understand? The methods of empirical observation and intersubjective verification are nothing but social constructs. They are agreements between members of a scholarly community (initially, European literati of the 16th and 17th centuries CE): that an ‘objective’, lawful universe exists; that causes and effects of objective phenomena may be complex and non-obvious, yet are nonetheless explicable without reference to supernatural causes; that there are appropriate methods of observation and analysis that aren’t always mathematically provable, but are verified by repeated empirical testing to mutually agreed standards of evidence; and that aggressive skepticism of each others’ work was the best way to maintain those standards.
Without the social constructs of science, there’d be no way for empirical procedures or findings to spread to other investigators, no body of shared, justified knowledge accumulating over centuries; no “standing on the shoulders of giants”. There could be no training in domain-appropriate methods, no apprenticeship in disciplinary subcultures. Every solitary scientist would have to recapitulate all prior work since Copernicus: plainly not scalable, making progress impossible. Above all, there’d be no way for a lone empiricist to be sure he hasn’t overlooked a serious error in his work. IOW, no hope of apprehending the world as it is, rather than as he merely wishes it were. It seems neither fred747 nor daveburton are able to grasp that, perhaps because they simply can’t imagine they could fool themselves. The more fools they.
Sorry to burst your bubble, Davey, but I am a PhD physicist with over 30 years of experience and a whole passel of peer reviewed publications. So, I am acquainted with the scientific method. I have done science. I have thought extensively about what science is, what it means and how it is done across a range of disciplines. You? Not so much.
I am genuinely curious, though, Davey. If the scientific method is not a social construct, developed over several generations of scientists, then how in your mind (such as it is) did it come to be? Would you have us believe it was divinely revealed? And the scientific method is part and parcel of science. Indeed, you cannot properly understand scientific facts or theories without interpreting them in the light of the scientific method.
Dave, what you are doing is NOT science. What you are doing is cherry-picking datasets that support the Just-So story you’ve told yourself because you don’t have the courage to face the truth.
snarkrates, who thinks science is a social construct, also thinks Prof. Will Happer is a “crank.” That’s what psychologists call “projection.”
Prof. Happer is one of the world’s top atmospheric physicists. He revolutionized two different scientific fields. Many people doubtless owe their lives to the application of his work in medical imaging. He has published over 200 peer-reviewed scientific papers. He’s a fellow of the American Physical Society, and the American Association for the Advancement of Science, and he is a member of the American Academy of Arts and Sciences, the National Academy of Sciences, and the American Philosophical Society. He was awarded the Alfred P. Sloan fellowship, an Alexander von Humboldt award, the Broida Prize, and the 1999 Davisson-Germer Prize of the American Physical Society.
What has snarkrates done? Won a ribbon for his prize lima beans at the County Fair, perhaps?
Crazyman,
Professor William Happer may have been all those things you say. He was also a member of the GWPF’s Academic Advisory Council and his inputs into the realms of AGW are those of an utter crank, for instance his telling work ‘The Truth About Greenhouse Gases’ who’s laughable content is examined here and here. It is evident the man now does speak out of his arse.
Yeah, keep dancing on the ledge, Davey boy. Yes, Happer had an impressive career studying atomic physics–not climate science. And William Shockley was a Nobel Laureate for research in semiconductors. He was an utter imbecile–and a crank–when it came to issues of race, intelligence, economics, and most other subjects to which he devoted his later life.
Happer’s schtick on climate is so bad it’s not even wrong. It’s not even original–he mainly regurgitates the talking points of his few fellow denialist scientists (I don’t include you in this number, you aren’t smart enough to be a scientist).
Dave, if you really understood science, you’d know that what Happer is doing doesn’t qualify. Real science leaves you with a deeper understanding of the subject after you read it–whether it agrees with your point of view or not. Can you actually say you’ve ever learned anything about climate science from a lecture by Happer?
Dave Burton laments that faculty and students lobbied to rescind the invitation of Will Happer to speak at UNC-CH. Given that the title of the talk was, “Why Has There Been No Global Warming For The Past Decade?,” it looks as if they would have saved the department some embarrassment had they succeeded. Given how hot the past 5 years have been, those arguments look pretty fricking silly, even if you don’ understand how silly they were in the first place.
The problem is that Happer adds nothing to the discussion. He merely regurgitates the same long-dead arguments that denialists have been making for 30 years. He doesn’t even bother to make his own arguments self-consistent–anything goes as long as it attacks the consensus of actual climate scientists. The shallowness of his understanding of Earth’s climate is obvious.
The thing about truly scientific discussions is that even when the participants disagree, they can often come away with a more nuanced understanding than they went into the discussion with. Not so in climate science, because there is no truly scientific disagreement.
Not wanting to waste the time of students and faculty with the ravings of a crank is not censorship. Nor is it political. It’s simple respect for the audience. Burton, Fred and Happer all seem to be voicing the common conservative complaint that reality has a liberal bias.
Why don’t you see what you can learn from Profl Happer’s 2014 UNC Physics Colloquium, instead of making up silly nonsense about something you obviously haven’t even seen?
snarkrates nails it. Perhaps the reason Happer’s invitation was not welcome was not that he disagreed but that he was talking out of his ass. Deniers are always whining that they are being ostracized for presenting a different take, dissenting, whatever. The problem is, their dissent is a bunch of crap, cherry picked, unsupported, you name it. They are the first to denounce argument from authority as a way to dismiss true expertise, then use that same argument from authority (“look at my Nobel Prize winner saying what I like to hear!!”) when some scientist with non relevant expertise makes an argument that doesn’t hold water, like “no warming for x years”, which always was total bunk. Dave Burton still has not commented on the next thread, that shows plenty of acceleration, and still does nothing more than cherry-pick stations here and there showing what he likes and trying to suggest that the entire planet is doing what he’d like. The brazen suggestion that coastal communities are not threatened because some hotel in Hawaii still looks kind of the same from an aerial view is downright grotesque. The Marshall Islands just declared an emergency. Alaskan communities tipping over in the sea, Bangla-Desh, Seychelles, Kiribati. Burton should go to these places to do his sales pitch…
Philippe, do you even recognize the irony of you accusing Prof. Happer of “talking out of his ass” in a colloquium which you haven’t even bothered to view? {SMH}
As for sea-level, I’m sure you must know that Bangladesh’s problem is subsidence, which has nothing at all to do with climate change. So why bring up that red herring?
Since you also mentioned Kiribati, here’s the longest sea-level measurement record from Kiribati:
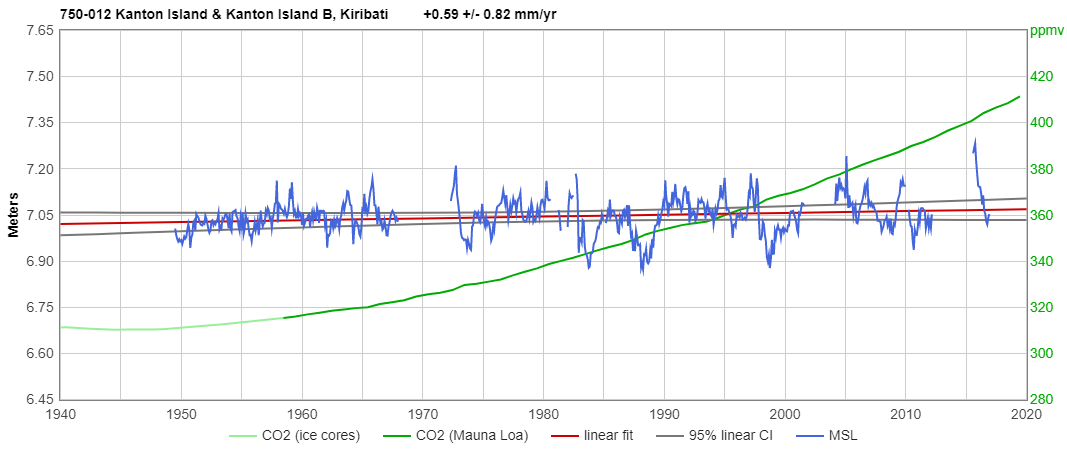
https://sealevel.info/MSL_graph.php?id=750-012
From 1949/7 to 2016/12:
Linear trend = 0.594 ±0.816 mm/yr.
Acceleration = 0.0217 ±0.0945 mm/yr².
It’s obviously not worrisome, and there’s been no detectable acceleration.
There are no good sea-level measurement records from The Seychelles. The best is from Point La Rue, but the data there doesn’t begin until 1993. From what little data we have, it appears to see an anomalously high rate of sea-level rise, suggesting subsidence, but there’s been no statistically significant acceleration:
http://sealevel.info/MSL_graph.php?id=442-007&g_date=1940/1-2019/12
I think Kwajalein has the best sea-level measurement record in the Marshall Islands: Here’s the latest measurement data:

http://sealevel.info/MSL_graph.php?id=1820000
From 1946/6 to 2018/11:
Linear trend = 1.929 ±0.708 mm/yr.
Acceleration = 0.0583 ±0.0743 mm/yr².
It’s obviously not worrisome, and there’s been no detectable acceleration.
The most striking feature of the sea-level record at Kwajalein is the very strong influence of ENSO. I wrote about it a few years ago, here:
https://wattsupwiththat.wordpress.com/2016/03/28/ooops-alarm-over-sinking-islands-premature-as-sea-level-falls-at-kwajalein-atoll/
I have some familiarity with Happer’s arguments in the colloquium bunkum. The way you describe him, one could construe him as one those “academic pointy heads.” Why describe Happer as an atmospheric scientist, when his area was optics? You continue to mix what appears like serious arguments with what is blatantly dishonest, like the zombie crap and the misleading beach pictures. Happer is not an atmospheric physicist, except for his mesospheric sodium find, which really was about optics. His petition proposal to the APS was overwhelmingly rejected. You insist elsewhere that it takes 60 years a data to be able to extract any significant trend in sea level, but you would give a pass to Happer for saying “no warming for 10 years” when you know 10 years is not enough for any significant trend in surface temps, why the double standard? How does that claim look now with 5 more years of data? Happer tries to argue that CO2 is not a pollutant, but it is nonetheless causing ocean acidification. Happer has stepped out of the scientist role when it comes to climate and is just doing politics, like he was with CFCs. Your enumeration of credentials amounts to an argument from authority, except that he does not have authority in the field he is criticizing. Ironically, fake skeptics (you wouldn’t be on of these would you?) complain all the time about authority attributed to those who do have expertise in the field. Happer has axes to grind, his opinion is an outlier. Your contention that sea level rise is too slow to be a concern is wrong in light of island nations and many coastal communities declaring their dire situations. It is not unreasonable for Nat Geo to show what would happen with Antarctic ice loss. Nobody is declaring a national emergency because of zombies. I still don’t see that you are arguing in good faith.
jgnfld misquoted me as saying, “Science is an algorithm”
No, science is not an algorithm. Science is the application of an algorithm called the Scientific Method.
The Scientific Method is what distinguishes “science” from other types of study. It is an algorithm or process for investigating the physical world. Here’s how it works, in seven steps:
1. The scientist observes the available data.
2. He formulates an hypothesis (or perhaps several plausible tentative hypotheses) to explain the observations.
3. He derives testable predictions from the hypothesis (or hypotheses).
4. He devises experiments or observations to test the predictions.
5. He does the experiments or makes the observations.
6. If the test results match the predictions, he cries “eureka!” and publishes. He can now properly call the hypothesis a scientific theory or theoretical model. He publishes it along with his data and calculations, so that other scientists can reproduce and verify his work.
7. If the test results fail to match the predictions, the theory is said to be “falsified,” so he discards or revises it and starts over at step 2, with the new observations or experimental results added to the body of available data.
Step 7 is the test of a scientist’s integrity. If, instead of discarding or revising falsified theories or models, a disappointed researcher revises the data, to make it fit his predictions, he’s a fraudster, and no scientist worthy of the name.
jgnfld also misparaphrased me, saying, “…you call “evidence” of no rise…”
Please stop misrepresenting what I have written. I did not call the photos of the Moana Surfrider Hotel and Scapa Flow “evidence of no rise.” Rather, they are proof that rising CO2 emissions are not causing worrisome sea-level rise.
At Honolulu, the long term sea-level trend is +1.5 ±0.2 mm/year.
At Wick, near Scapa Flow, the long term sea-level trend is about the same: +1.3 ±0.5 mm/year.
Neither trend is zero, but neither is large enough to be worrisome, nor even noticeable without careful measurements, and neither site has measured detectable acceleration in the rate of sea-level rise.
Re. not producing “worrisome” sea level rise, your pictures provide precisely no evidence of that. They lead YOU to not worry in YOUR opinion, but your opinion on the matter is as worthless as the pictoral “evidence” you provide.
I did not misquote you. If there were an algorithm to science it could be performed by nonexperts. That is the whole point of an algorithm. It can be performed without intelligence or judgement. Scientists often _develop_ algorithms for use by others who may be less qualified, but that is a different matter.
As for:
+++++++++++++++++++++++++++++++++++++
“Here’s how it works, in seven steps:
1. The scientist observes…
2. formulates an hypothesis…
3. derives testable predictions…
4. devises experiments…
5. does the experiments…
6. and publishes (or not).
7. If the test results fail to match the predictions, the theory is said to be “falsified,” …”
++++++++++++++++++++++++++++++++++++++++++
That is the hypothetico-deductive method straight out of my high school textbook from the 60s with a dash of Popper added in. As was my suspicion above. Classic freshman philosophy “reasoning” based on a little knowledge and a lot of Dunning-Kruger.
First off, the H-D method is, and always has been, ONE model of science. It is very idealized and doesn’t represent daily work within most research institutions all that well. You have turned it into THE model of science which is totally wrong.
Second, the H-D method while older than Logical Positivism is pretty straight neopositivism which was popular up until the 30s or so but heavily debated and criticized as the only model by scientists and philosophers of science from WW2 on. (Actually this fight/debate goes back into the 1700s including Berkeley, Hume etc. and later in the 1800s Mill, but that would require that you know significantly more than you’ve demonstrated. If you have access to an OED there is some interesting history there.)
I could direct you to Popper, Pepper, Kuhn, Hempel, Quine and others, but you are so sure in your Dunning Kruger-filled mind that I fear you probably wouldn’t bother. A good primer on the scientific method as a whole field can be found in the Stanford Encyclopedia of Philosophy here https://plato.stanford.edu/entries/scientific-method/#SciMetSciEduSeeSci . But I warn you, it is written beyond the high school level. I would also recommend the article on “Induction” to those actually interested in the scientific method.
As I said before, science is most basically a consensus of the qualified where the qualified are defined by knowledge of the area, demonstrated skilled work within the area, creative work, and production of findings that others equally qualified vet, make further use of, and respect.
Even trained scientists operating outside their areas routinely make egregious errors which is why they often don’t get published or respected in areas where they are not qualified. Happer is a very good example. As was Mueller till he sat down for a few years and wrestled with learning the area issues while doing BEST.
Muller didn’t make himself popular with climate scientists when he launched BEST with aggressive skepticism. IMHO, he did us all a favor, by seeming to challenge the specialist consensus on behalf of all self-described climate ‘skeptics’, then educating himself into publicly acknowledging that the global temperature record was sufficiently accurate (https://www.nytimes.com/2012/07/30/opinion/the-conversion-of-a-climate-change-skeptic.html). IOW, he demonstrated how a genuine skeptic resolves honest doubts. As a bonus, his physicist’s arrogance (https://xkcd.com/793/) was moderated by appropriate humility toward the most complex of Earth sciences.
“At Honolulu, the long term sea-level trend is +1.5 ±0.2 mm/year.”


Moana Surfrider Hotel (east side)
http://www.pacioos.hawaii.edu/king-tides/map.html