Over at the website of the “Global Warming Policy Forum” (GWPF), David Whitehouse has decided to join the club.
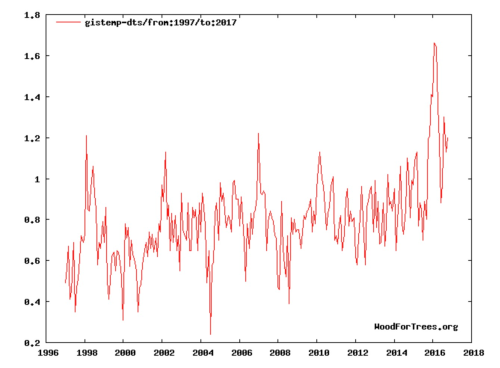
In defense of David Rose, he insists that “Despite Denial, Global Temperatures Are Dropping Fast.” He shows several data sets other than the one used by David Rose, to establish that “dropping fast” isn’t just about Rose’s choice, and the very first he displays is from NASA:
Does that look like it’s “dropping fast” to you? Or does it look like it’s fluctuating a lot while the overall trend is going up? What if we showed you some of what it did before 1997?
Does that look like it’s “dropping fast” to you? Or does it look like it’s fluctuating a lot while the overall trend is going up?
David Whitehouse doesn’t seem to like my mentioning that there’s data before 1997, when David Rose started his graph (and Whitehouse starts his).
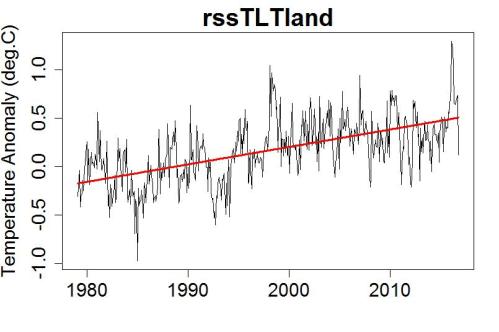
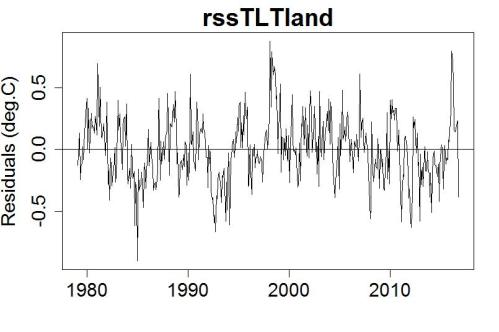
The blogger shows the lower tropospheric data back to the start of the data set in 1979 and says showing the post-1997 “hiatus” data on its own is misleading as there is a clear trend from 1979 upwards. Except that there isn’t.There is no way to reproduce the trend observed either during the period 1979 – 1997 or 1979 – 2016 in the post 1997-data (ie half the data set) because a straight line does not represent the data over its entirety. It is obvious that a straight line doesn’t work when one examines the residuals (the difference between observed and predicted data) which are not randomly distributed.
Let’s find out, shall we?
We’ll start with the NASA data he so kindly showed. Let’s see how the 1979-1997 trend estimate compares to the post-1997 trend estimate:
Golly gee. From that, it looks like from 1979-1997 to post-1997 global warming actually got faster!
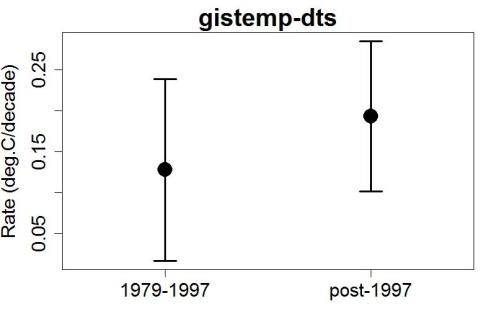
But did it really? I’ve often emphasized that “looks like” isn’t proper statistical procedure. After all, those trend estimates are only estimates; we should actually compute the uncertainty associated with them. Of course that involves using some statistics, which may not be David Whitehouse’s forte.
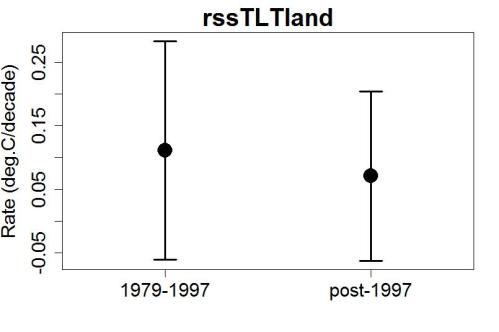
Here are the estimated trends for the two time spans, together with their 95% confidence intervals (the range in which the actual trend is likely to be):
The fact that the confidence intervals overlap so much is telling evidence that statistically speaking, there’s no real evidence that the trend rate is any different after 1997 than it was before.
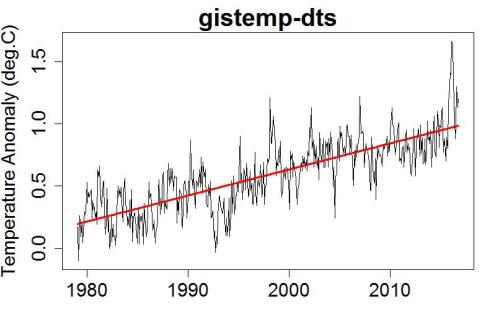
How do those trend estimates, for the two time spans, compare to the trend estimate for the entire span from 1979 to the present? Let’s add the after-1979 trend, as a dashed line, to see for ourselves:
Both of the confidence intervals we computed before include the estimated rate for the entire time span 1979-present. To put it succinctly, statistically speaking there’s no real evidence that the trend rate 1979-1997 or post-1997 is any different than it was for the whole span post-1979. The statistically best estimate is just this:
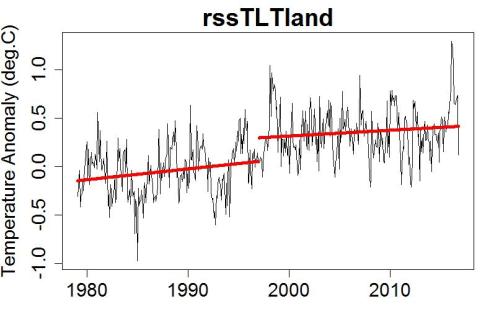
That of course is for the NASA data, which is a whole-earth (not land-only) data set but based on meteorological stations only, not using sea-surface temperatures. What about David Rose’s original choice, the lower-atmosphere data over land areas only from RSS? Comparing pre- and post-1997 trend estimates we get this:
For these data it does “look like” the trend rate went down. But as I said before (and have often emphasized), “looks like” is an invitation to error. Let’s once again compute uncertainty levels and compare confidence intervals:
For this data set, as well as for David Whitehouse’s chosen NASA data, there’s no real evidence that the trend rate is any different after 1997 than it was before. Spoiler alert: there’s also no real evidence that the trend rate 1979-1997 or post-1997 is any different than it was for the whole span post-1979.
But David Whitehouse insists that the whole-span linear trend can’t be right:
It’s obvious, he says, because the residuals are not randomly distributed.
With that, David Whitehouse decided to get mathematical. At this point I apologize to first-time readers who don’t like math, because I’m about to get mathematical myself.
This is where David Whitehouse reveals that statistics is definitely not his forte, because he really doesn’t know what he’s talking about. To the untrained eye, the residuals don’t look random:
But those who know what they’re talking about, know that not all random noise looks the same. In particular, we’ve known for decades that global temperature time series have a kind of randomness that isn’t the simplest kind (what’s called “white noise”), instead it’s called autocorrelated noise. In fact the autocorrelation can be quite strong, especially for satellite data for the lower atmosphere over land areas only.
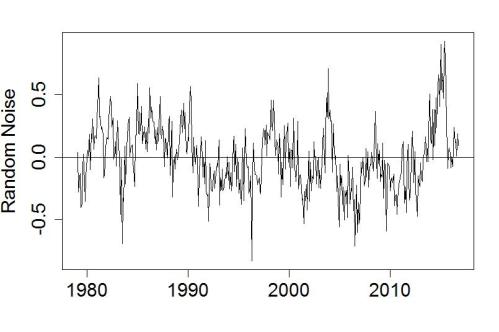
I generated random noise with the same autocorrelation structure, to show you what it looks like. I didn’t generate hundreds and hundreds of samples until I got one that looked the way I wanted. I was going to make 10 of them, but the very first one — right out of the box — illustrates the point so well that I’ll show you that one:
That, my friends, is what autocorrelated noise looks like when it emulates satellite data for lower-atmosphere temperature over land areas only. Yes, it’s random. But it’s not the simplest kind of random.
David Whitehouse thinks it’s “obvious” that it’s not “randomly distributed.” That’s because he doesn’t know what he’s talking about.
By the way — David Rose indulged in cherry-picking in more ways than one. It was cherry-picking to conceal what happened before 1997, because that way he hides the part that makes the rising trend obvious. But it was also cherry-picking to choose the satellite lower-atmosphere data over land areas only from RSS. Remember how that NASA data didn’t even “look like” anything but fluctuation on top of a rising trend? David Rose picked his data set because at least it didn’t look like a rising trend if you leave out the stuff before 1997. But as I’ve said many times, “looks like” is a bad guide and when we do the math, the rising trend is still there — even in David Rose’s chosen data set, even leaving out what came before 1997.
David Rose’s original article has been a major embarrassment to him, and to the many climate deniers who have insisted on supporting his argument. In fact, maybe the best thing about David Rose’s original blunder is that this gift just keeps on giving. It spurred Ross Clark to embarrass himself, then inspired James Delingpole to embarrass himself, then (probably best of all) got Lamar Smith and the U.S. House of Representatives committee on science, space, and technology to embarrass themselves. And it didn’t quit then, Jaime Jessop joined the club, and now David Whitehouse and the GWPF have joined in.
If they were smart they’d quit talking about this, just “lay low until the heat’s off,” because every time they do another “defense” of Rose’s nonsense, I get to do another post showing how lame their defense is. More people read it. More and more people see just how ridiculous their claims really are. I feel like Christmas arrived early this year.
This blog is made possible by readers like you; join others by donating at Peaseblossom’s Closet.






Maybe the denialists think the election of Donald Trump means that stupidity will be rewarded?
Worse, they imagine that their beliefs have been vindicated. I have seen people saying, “Trump won, therefore you’re wrong!” in climate discussions.
Why does that seem a smart comment to you?
I’m pretty sure Whitehouse was the instigator of this meme and Rose’s article, with this post a couple of weeks ago.
paulskio,
Indeed Whitehouse was the first out of the blocks with this particular pack of denialist lies. But note that back in early November he was still without the November satellite data. (UAH had been posted but the RSS data which Rose relies on – UAH does not provide what he needed – was posted three days later than Whitehouse’s article)
In that early November article, Whitehouse slight-of-hand is immensely childish. He sets out (with numbers) why 2016 will be a record-breaker and why this is only due to El Nino. So far this is legitimate if non-interesting. ” In other words, without the El Nino recent years would not have been record-breaking.”
Now look into my eyes, look into my eyes, “If the record years are due to non-climatic variations one wonders why they are so often used to support climate models.” The lying fool is saying (with UK government support, as the GWPF is a registered charity, an educational charity no less) that as all the record years are El Nino years, the records and the warming that causes those records are both due solely to El Nino.Of course, we can tell Whitehouse is lying in bare-faced mode because he is posting on the GWPF Forum which is the non-charity bit of the GWPF website, where most of their overt lies are allowed
Whitehouse’s early-November blather about “real, emerging climate science” and that “some scientists fear global temperatures may drop back in years to come,” shows echoes in his recent nonsense but in failing to name these fellow scientific travellers of his shows he is no scientist. This is probably why he is so far away off with the fairies.
paulskio,
Sorry, I was off somewhere myself with that last comment of mine. I mistakenly thought your link was to this earlier nonsense from Whitehouse so didn’t bother looking down the link. I have just now stumbled across the item you linked to.
And I then I had meant to say “…..he was still without the October satellite data.” However, had Whitehouse hung on that extra week for the November satellite data he may have been a little less eager with his bold statements in late November. The November RSS TLT(land) anomaly has of course risen but perhaps more telling is the UAH TLT anomalies courtesy of Whitehouse’s fellow traveller Woy Spencer. The UAH TLTv6(land) anomaly has also risen and it is the hottest November on the record. How embarrasing. It’s lucky Whitehouse is so well protected from embarrasment by his deep denial mechanisms.
Seeing the size of the confidence intervals and the overlap reminds me of that time Phil Jones was asked if there was any statistical difference in warming between 1910-1940 and 1975-2005. How much of a difference in the rate would there need to be to be able to say that? Seems it would have to be quite substantial.
Yes, it was the GWPF that started the meme…
There is so little “good news” for denialists that when one of them manufactures some they all have to repeat it. Sad really.
More bad news, Australia’s BOM has officially called off the16-17 La Niña.
With their luck, maybe 2017 will be visited by another “it’s just the El Niño” El Niño.
I don’t think they are embarrassed. This isn’t an isolated blunder by Rose or Whitehouse. Their columns/blogs are consistently wrong. Their claims have been proved wrong by scientists so many times, they must be doing it on purpose. It is the only winning strategy for them: Repeatedly make the same nonsense claims, as if the truth, which has been hidden by scientists and Al Gore, is now starting to come out, and Rose and Whitehouse are whistleblowers who can’t be silenced.
the problem is they are simply to stupid to see it as a nonsense claim
they are both blinded and incredibly exited in equal measure by the fact that they get to use a NASA dataset that shows unequivocally temps dropping – nothing else is important,
context – pah, who needs it when they have a bona fide “NASA fact” and like dogs with a bone, they wiggle excitedly it about, looking for a pat on the back
when you debate 911 twoofers they point to the fact that the WTC building fell “straight down” – that’s their “NASA fact”
and they are quite right, they have just observed “gravity” in action, a bit like the deniers getting all exited by temps falling from a peak
bless!!
I saw yesterday on Twitter that Rose continues to insist that he is not a denialist, and that he was saying something different to what people are saying he was saying. The most obvious response is, pull the other one it has bells on.
It gives them something to say and, unfortunately, journalists don’t have the mathematical confidence to just laugh in their faces and tell them that they aren’t simply wrong, they’re pathetically wrong to such a ridiculous extent that they are embarrassing themselves.
Instead journalists swallow this nonsense on the basis of providing balance in a debate they don’t have the confidence to adjudicate.
My guess, and it is only a guess (obviously), is that this isn’t (primarily) about the data, or (mis)informing the public. It’s a disguised attempt to throw mud at Gavin Schmidt, who is mis-quoted in the Daily Fail article. And the reason for throwing mud at Schmidt – Bob Walkers’ (of the incoming Trump administration) war on “politicized” science
In other words, Rose and Whitehouse are trying to add to the “mood music” about earth sciences at NASA
Since you’ve bumped this thread Phil, I’m happy to inform you that I subscribe to your theory. I am also currently in earnest conversation with David Rose’s managing editor and I’m at least mildly surprised to discover that:
We have had no other complaint
Hence said editor has only just become au fait with the learned commentary available at:
http://climatefeedback.org/evaluation/stunning-new-data-indicates-el-nino-drove-record-highs-global-temperatures-david-rose-daily-mail/
I have foolishly promised:
I’ll endeavour to come up with a definitive (and even longer!) list for you.
Suggestions on a postcard please to yours truly by Boxing Day. For additional background on how the IPSO game is played see for example:
http://GreatWhiteCon.info/2015/02/a-letter-to-the-editor-of-the-sunday-telegraph/#Feb20
Hi Jim,
Nice to hear you’re still battling the Daily Fail.
Given my opinion above, I have frequently used this article by Gavin Schmidt to highlight the difference between what Schmidt really thinks and the impression given by the original article in the Fail. Specifically, since Schmidt (in the first figure) graphs the residuals from a linear trend against a measure of the ENSO strength in order to make predictions for the 2016 and 2017 GMST global anomaly, that shows that (back in September 2016) he understands that GMST’s are temporarily influenced by the ENSO state. The fact that he predicts a higher anomaly for 2016 than 2017 proves that he understands that the 2016 anomaly has an ENSO component to it.
The contrary impression in the Fail is provided in two sections of the article. Firstly, the juxtaposition of the sentence “Some experts will be forced to eat their words” with a reference to Schmidt in the next sentence, allows the reader to conclude that it is Schmidt who is one of those experts. But the article doesn’t explicitly state this; it just encourages the reader to erroneously make that connection. Indeed, Ed Hawkins, in his response on Climate Feedback essentially falls into this trap. But, of course, the Fail can claim, that the article never states that it is Schmidt who will have to “eat his words”
The second section is the quote from Judith Curry, which includes the words “I disagree with Gavin”. Curry appears to have fallen for the false dichotomy that Rose sets up at the beginning of the article; namely that record highs in GMST must be caused by one singular thing – the idea that the highs are inevitably caused when two phenomena (one permanent and one fluctuating) re-inforce each other, seems to be lost on both Rose and Curry. Given this (far too) simplistic view, it’s difficult to know exactly what Curry claims to disagree with Schmidt about.
I’m not really sure if you can use any of the above in your conversations with the Fail – It might be worth emphasizing that the 538 article is authored by Schmidt, so represents his true views on the subject, and contradicts the impression given by article. It also might be worth asking, that since the 538 article actually excludes Schmidt from those scientists who will “have to eat their words”, which scientists Rose actually had in mind.