
These days, blogs and news reports about global warming often include the optimistic report that emissions worldwide, and in the U.S., are on the decline. Yes, that’s a good thing. It’s important, it’s crucial.
But one wonders, how well are we doing? I’m not speaking in terms of emissions, but of the buildup of atmospheric CO2. For that, we should not look at emissions data but at concentration data, which (if I’m not mistaken) are more accurate and more reliable than emissions data.
Here’s the concentration (in “ppmv,” parts per million by volume) since 1958 measured at the atmospheric observatory at Mauna Loa in Hawaii:

It’s still increasing, which is no suprise because emissions haven’t dropped to zero. But according to reports they have dropped, so we might hope CO2 concentration isn’t rising as fast as it was (i.e., that CO2 is decelerating). Let’s find out.
The first thing I’ll do is remove the annual cycle. CO2 peaks in May because land plants (mostly in the northern hemisphere) have decayed over the winter, returning to the air the CO2 they captured while growing. It bottoms out in October after a summer season of growth by extracting CO2 from the atmosphere for the carbon.

When we subtract the annual cycle (I did so by a 4th-order Fourier fit) we’re left with this:

Now we’re ready to estimate the rate at which CO2 is increasing.
There are many ways to do so. One is to compute annual averages and take the differences from year to year (I computed annual averages April-through-March so as to include the most recent data, and compensated for those few months with missing data). Another is to fit a smooth curve which can also estimate the rate of increase. I did both, and here are the results (year-on-year in black, by smooth fit in red):

Back in 1960, CO2 was only increasing at about 0.77 ppmv/yr. Now it’s rising about 2.4 ppmv/yr.
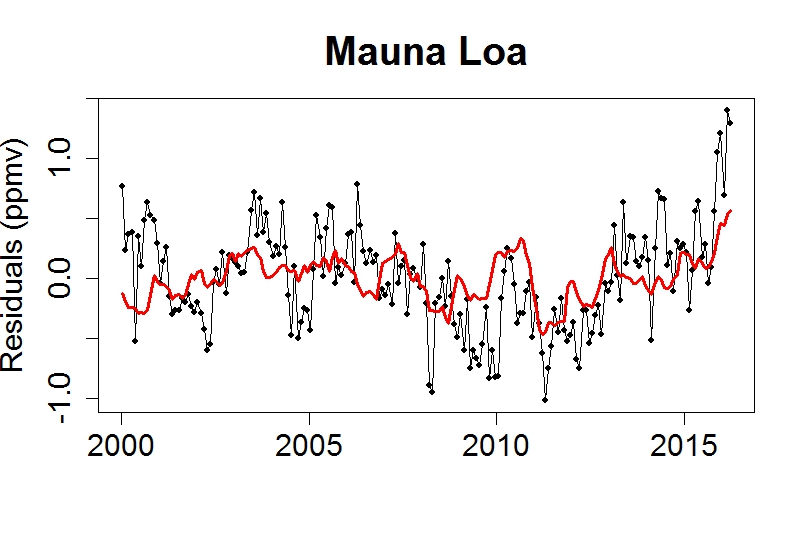
More to the point, there’s no sign of any decrease in the rate (deceleration of CO2). In fact the rate seems to be increasing still (acceleration of CO2). We can look more closely at the data since the year 2000, fitting a 4th-order Fourier series and a rising trend line simultaneously, then examining the residuals; a flat line would indicate a constant growth rate:

There’s a distinct visual impression that recently (since about 2012) it’s been rising faster than before 2012, and it’s been considerably higher for the last 5 months.
Part of that is almost surely due to the recent el Niño, which is known to influence CO2 concentration, probably (if I’m not mistaken, but I’m not sufficiently expert to know for sure) through its influence on plant growth and decay rates. Comparing since-2000 CO2 to MEI (the Multivariate El Niño Index), I find the strongest influence when the el Niño effect is lagged by 6 months; it models the residuals shown above thus:
What’s left over after removing the estimated el Niño influence is this:

There’s still the possibility of faster rise since about 2010, but I don’t have a lot of confidence in that conclusion. I do, however, have a lot of confidence in the conclusion that the rate of CO2 growth has not decreased. There’s been no deceleration. Whatever emissions reductions have happened, haven’t yet slowed down the rise of CO2.
I’m certainly not an expert in the carbon cycle, but there are some troubling aspects to watch out for. One is the melting of permafrost, which can release massive amounts of CO2 into the air even if we bring our emissions to a halt. Another is the possible saturation of the land-plant carbon sink. And, I have no idea how deforestation has trended, or the impact of increased wildfire on the carbon load in the atmosphere. All these factors — about which I know next to nothing — may impact CO2 in ways which make it much harder to keep the atmospheric load down.
All of which emphasizes the importance of reducing our own emissions, quickly and as much as possible. It’s past time to tell our elected officials that we won’t put up with more delays, or more catering to the fossil fuel industry. We really need to let politicians know that if they don’t act quickly, they’ll be out of a job.
This blog is made possible by readers like you; join others by donating at Peaseblossom’s Closet.


Some of the US’s ‘supposed’ decrease in CO2 is from a switch to CH4. Invariably we have fugitive emisisons, which have led to CH4 levels in the atmosphere increasing. Double down with it’s multiplier effect and tip in a lot more N2O, which has also been on the increase and has a huge multiplier.
Cape Grim here in Australia is one of the three worldwide baseline stations used by the WMO has good records here for all three gases; CO2, CH4 and N20. They’re all going the wrong way.
http://www.csiro.au/greenhouse-gases/
And our climate science denialist government is proposing to shut it down. If you don’t know about something it can’t hurt you!
I’m no expert either, but I always thought the larger atmospheric carbon dioxide increases in El Niño years was due to less absorption from the hotter equatorial waters. Maybe someone can clear this up.
Great summary. It’s so important to track data and trends forward. And it may be appropriate to track backwards from a state of unsustainability – we do this with sea level projections, heat increases, etc. And recent NASA studies on CO2 levels within the International Space Station found that 1000ppm of CO2 was slowly toxic – but lesser levels of 800 – 900 conferred persistent headaches and confusion. The tracking site of CO2Now has moved to a new location https://www.co2.earth/2100-projections — it shows projected levels at 800ppm by 2100. More and sooner with methane factored in??
Yikes!
You can’t really “factor” methane into CO2 for physiological effects, only radiative forcing. Methane does result in some CO2 when is breaks down in the atmosphere, but the amount is relatively small as total atmospheric methane concentrations are below 2 ppm (and a rough rule of thumb is 1.5 tons CO2 produced when 1 ton of methane breaks down).
My guess: many countries are subsidizing emissions reductions, perhaps these subsidy regimes are poorly enforced, and perhaps lax enforcement is a feature and not a bug, allowing countries in climate agreements to exaggerate progress. See the VA scandal in the USA: incentive pay for short wait times inevitably led to fraud without oversight, with basically all stakeholders inclined to look the other way.
But maybe political corruption is just a lot easier to stomach than the idea that we’ve already triggered positive feedback loops in climate change
Positive feedbacks can occur almost as soon as the initial effect of increased atmospheric CO2 occurs, e.g. as soon as temperature is increased by the radiation forcing of CO2, atmospheric water vapour starts increasing and it only takes several days to a week for water vapour to reach the new equilibrium level.
So feedback is virtually as old as the increase in CO2. A lot of people don’t seem to realise this.
I suppose that another variable is the rate at which oceans take CO2 out of the atmosphere. Which is I expect partly accounted for by El Nino, which you take into account.
But basically, I trust the concentration of CO2 in the atmosphere as a measure of how our emissions are tracking far more than I trust us to correctly estimate our emissions.
Trouble is, judging by the people who get elected in the USA and Australia, most of the voters don’t seem to have much problem with more delays.
That would require a sudden change of attitude by the majority of voters in the USA and Australia. Up till now, at least, most voters have preferred politicians who won’t act. This is the situation in Australia: http://www.abc.net.au/news/2016-04-15/steketee-climate-change-has-dropped-off-the-political-radar/7328538
Politicians are just a convenient scapegoat. The real problem is the people who vote for them.
[Response: I’m not trying to use politicians as a scapegoat, I’m trying to inform voters what we need to do. It’s fine to be energy efficient, drive a car with excellent gas mileage, use rooftop solar, etc., but what we as voters really need to do most is make this a top priority at the voting booth. We need the power of government to meet the problem, and we won’t get that with the politicians we have now.]
Some people blame the political process for lack of progress which includes using politicians as a scapegoat. e.g. http://www.smh.com.au/environment/climate-change/rudds-ets-flipflop-sparks-climate-chaos-20100428-tsgu.html
Problem is, you can’t tell most voters what they need to do. Wonderful analyser that you are, most people wouldn’t care much about what you say as is clear from this article: http://www.abc.net.au/news/2016-04-15/steketee-climate-change-has-dropped-off-the-political-radar/7328538
Chris, blaming voters (like blaming the poor) ignores the environment in which they are placed and by whom and for what purpose. This isn’t serious analysis, even if it allows one to think oneself a “better sort of voter”.
I’m simply making the point that, regardless of why they vote how they do, you’re not going to get politicians who care unless you have voters who care. Unless most voters care, there’s not much point in telling some people to tell their elected officials that we won’t put up with more delays. If these voters care then they will have already voted for politicians who care.
That’s a high-handed attitude. Just say what you don’t agree with and leave out the attitude.
I totally agree with John Brookes that the Keeling Curve is surely a better measure of the true state of affairs than reporting data from the International Energy Agency and the like. (e.g. https://www.iea.org/newsroomandevents/pressreleases/2016/march/decoupling-of-global-emissions-and-economic-growth-confirmed.html) . That said, I believe there is a lag between current emissions and the atmospheric contribution and I don’t think we would expect to see the recently reported plateau in energy-related emissions reflected in the Mauna Loa data for a few years. Additionally, the simple reduced ability of warmer waters to dissolve CO2 accounts for a significant portion of El Nino-induced spikes in atmospheric CO2.
There’s also the difficulty of keeping track of land clearance and forestry destruction/mismanagement in various places. (And I’m still not convinced we’re properly on top of calculating CO2 released from warmer &or drought affected soils in hot conditions like el Nino years.)
«We can look more closely at the data since the year 2000, fitting a 4th-order polynomial and a rising trend line simultaneously, »
I think you should have stopped at a second order polynomial if you want to isolate the acceleration. Also, I forth order polynomial over 16 years is unlikely to be orthogonal with the ENSO.
[Response: Indeed. But it’s not a 4th-order polynomial, that was a typo; it’s actually a 4th-order Fourier series for the annual cycle. Thanks, I fixed the post.]
Makes much more sense. Do you detect any increase in the amplitude of the yearly cycle? This is observed in the northern sites, but may be not detectable in Mauna Loa.
You should put a second order polynomial fit on the residual. Eyeballing, it look like a significant acceleration, but this may be not true.
[Response: I looked for changes in the annual cycle here: https://tamino.wordpress.com/2012/06/01/annual-cycle-of-co2/
]
If these pesky researchers and people who know things would just go away and leave us to our delusions, then the problem will magically go away.
Now I urge everyone to bow their heads and pray to their creator to clean up the mess that we have made, because that’s how reality works…right?
*The following was brought to you (mostly) by the GOP.
Skepticmac, as a Christian myself, I find myself both agreeing and disagreeing with your comment
– agreement, because it is certainly a common human failing to want to ignore inconvenient information. And hope the problem will go away by itself
– disagreement, because you have focused on ONE reason to justify inaction (the one that I personally identify most with). Without disagreeing with that justification as used by some people, I would say that there is good evidence for people using a range of justifications: “the free market will solve it”, “saving $$ now is the important thing”, “it would cost jobs”, “it would stop us helping the poor in country X” etc.
On Tamino’s comment about trying to get our politicians on board for action, I would hope that there is scope for us trying to encourage action by using the justification against itself
– “God will save us” answered by “God made us stewards of the Earth, we need to be good stewards”
– “the free market will solve it” answered by a free market mechanism
– “saving SS now” answered by “so you recommend being ‘Penny wise, Pound foolish?'”
Andrew- As long as a person is willing to both accept the science about AGW, and are willing to take both personal and civic action to help curb what is clearly an imminent threat to our future survival, then I don’t care how they arrived at that position.
Too many deniers use their faith as a get out of jail free card when it comes to their rejection of the dangerous consequences of climate change, but I stand with the faithful such as Katharine Hayhoe who do see it as a duty to be “good stewards” of the earth. I reject the notion that a deity will save us from our own actions however. That is just wishful thinking.
Its worth remembering that while we have had some good news of late from the U.S., Europe, and (if you trust official numbers) China, global CO2 emissions are still at a record high level, though the rate of increase in emissions has slowed. There isn’t a particularly monotonic relationship between emissions and atmospheric CO2 on a short-term basis due to large year-to-year variations in the land and (to a much lesser extent) ocean sinks.
@Zeke,
The US and Europe have reduced emissions primarily by exporting their heavy (and lately, also light) industry to Asia. Then they give themselves a pat on the back for reduced emissions while continuing to buy the same products, made in the same way. It’s all a shell game. Only global emissions matter, and the Keeling curve (after ENSO correction) is the most reliable way to determine that.
I think this factor is often overstated–the dollar value of US manufacturing continues to rise, according to the Fed:
https://research.stlouisfed.org/fred2/series/OUTMS
People get the impression that manufacturing in the US and many other developed countries has largely been hollowed out, but the data doesn’t support that notion.
Not sure I buy that explanation, particularly with emissions in China decreasing.
“We really need to let politicians know that if they don’t act quickly, they’ll be out of a job.”
This certainly is a necessary step but even if that happens, I am afraid that we are entering an era of existential struggle. If that is true, how will people like Ted Cruz be viewed decades from now when his rhetoric about “War on coal” and his attacks on climate scientists are part of his ‘permanent record’? And shame on us for allowing this to happen. Americans like to tout how great we are, but is that really borne out by the evidence?
The 0.2% rise in CO2 emissions 2014 to 2015 proclaimed by the IEA as part of CO2 emissions that “stayed flat for the second year in a row” is reported as +0.5% by CDIAC Global Carbon Project. This accounts only for FF emissions. CDIAC also put cement emissions rising by 2.4% and LUC emissions rising by 18%. Accounting for all these sources yields a 2.2% increase for 2014-2015. )How much circularity there is in this analysis, I know not.)
We have some wait for the 2015 numbers from CDIAC (the 2014 numbers arrived Dec 2015). The rising atmospheric CO2 through 2015 & at the start of this year may reflect in some way this particular El Nino’s impact but could still result from increased LUC emissions or wonky FF emission accounting.
Yes, the headline numbers are only from energy and they are just estimates, though one might think that, for some countries, such estimates would be reasonably accurate (not so for some others). Overall, I have little confidence in estimates of emissions. In the end, it doesn’t matter as much as the concentrations of GHGs in the atmosphere.
In the end, we have to get to zero emissions. I seriously doubt that can be achieved with so-called renewable energy (unless that infrastructure can be built and operated without emissions and air/sea travel can be powered by it). Still, a slowing of warming would be preferable to the speed we’re going at now.
I’m going to go ahead and call BS on this statistic. 87% of all anthropogenic co2 emissions come from fossil fuel burning: http://whatsyourimpact.org/greenhouse-gases/carbon-dioxide-sources.
(MIGHT NOT HAVE UPLOADED FIRST TIME)
bobcobbblog,
Why would you “call BS on this statistic. 87% of all anthropogenic co2 emissions come from fossil fuel burning”?
This is a brave call to make as the source of the stat you brand BS is Le Quéré et al (2013) which is no fly-by-night paper. The work continues today as Quéré et al (2015) ‘Global Carbon Budget 2015’ (PDF here) which stands as the basis for the CDIAC Global Carbon Project which I cited above, and boasts over 70 contributing authors.
That latest work puts the ratio (2004-2013) you find so hard at 91% (86% to 96%) FF+cement of which 4% is the cement contribution, thus unchanged from the graphic you cite and “call BS”. (From the paper E(FF) = 9.0Gt(C)/yr±0.5, E(LUC) = 0.9Gt(C)/yr±0.5 with E(cement) provided in the CDIAC data as comprising 0.41Gt(C)/yr).
No Al,
I’m calling BS on your assumption that emissions went up 2.2% from 2014-2015. How you get an increase 4x the rate reported by the paper you cited from increases in sources that make up a small fraction of co2 emissions puzzles me. Considering Tamino is a statistician and more or less agrees with the
stalling tells me math is not your strong suit
bobcobbblob,
First to clear up a mistake of mine (although it is quite obvious to observant folk).. Both the 2.2% rise in total emissions reported by CDIAC and the 0.2% rise in FF emissions reported by EIA were for the period 2013-to-2014.
(Perhaps I should also make plain that I do not consider misunderstanding somebody’s overly-vague and deceptive use of pronouns a mistake on my part.)
So how do I ” get an increase 4x the rate reported by the paper you cited from increases in sources that make up a small fraction of co2 emissions”? I could have achieved it by noting that “the small fraction” isn’t insignificant being greater than 10% of the total and that the rise the bulk of that fraction is subjected to (at 18%) is quite large. What follows would be the application of a mathematical technique known as “arithmetic”. The values that would be employed can be determined roughly from those presented in my two comments immediately above or alternatively can be accurately obtained by accessing the CDIAC Global Carbon Project data.
If you are still sceptical of what I say through being perhaps less familiar with the operations of “arithmetic”, the following record of operation for the rough calculation will be confirmed by those that are familiar with “arithmetic”,:- 87%*1.005 + 4%*1.024 + 9%*1.18 = 1.02151 ≈ 1 + 2.2%.
You got your own arithmetic wrong lol. The number I get is closer to 1.3, not 2.2. Again, some fuzzy math on your partp
bobcobbblog.
“Closer to 1.3” you say? I did wonder to suggest that it might help if you read off the answer prior to pressing the cube-root key. But instead I’ll put you down as a lost cause.
No, you’re more of a doomerism lost cause who can’t do basic math.
Gotta say, Al’s arithmetic looks spot on to me.
Perhaps bobcobbblog could show his workings? The arithmetic Al shows as the bottom of his comment is absolutely correct; maybe bobcobbblog is using different numbers?
With pleasure, Michael: – 87%*1.005 + 4%*1.024 + 9%*1.18 = 1.02151 ≈ 1 + 2.2%
Step 1: .87*1.005=.87435
Step 2: .04*1.024=.04096
Step 3: .09*1.18=.1062
Step 4: (Step 1) + (Step 2) + (Step 3)= 1.02151
Step 5: 1.02151+.02=1.04151
It does not equal 2.2
It simply does not follow that you can get a 400% increase in total emissions from sources that make up a small fraction of the total.
That clears it up, then: it’s Step 5. Al’s calculation is:
1.02151 (updated forcing–2014?) – 1 (original forcing–2013?)
= 0.02151
Multiplying by 100 then gives us the percentage by which the 2014 forcing exceeds 2013, 2.15%–or, rounded up, 2.2%, for a “2.2% rise in total emissions reported…” Or, more accurately (and presuming I’m following all this correctly), a 2.2% increase in the consequent effective forcing.
Doc, I still think it’s improbable that you can get a 400 percent increase in rate of emissions from sources that make up a small percentage of the total. There’s no way that’s accurate.
bob, how do you get the 400% figure from a 2.2% rise in emissions? I’m afraid I don’t understand that, either.
The report Al cites says about a .5% emissions growth rate, and he claims that it should be 2.2%, 4x the reported rate. That seems too high to me.
Doc Snow,
CDIAC Global Carbon Project do not quote any 0.5% figure for the rise in fossil fuel CO2 emissions. Le Quéré et al (2015) which reports the work actually reports a 0.6% figure (2013 – 9.735Gt(C), 2014 – 9.795Gt(C)) but this is for FF+cement emissions. Subtracting cement (2013 – 0.549GT(C), 2014 – 0.562Gt(C)) yields a 0.512% increase for FF emissions which now shed of cement is comparable with the EIA FF figure of 0.2% increase 2013-14. The CDIAC figures also provide those for LUC emissions: 2013 – 0.92Gt(C) and 2014 – 1.09Gt(C).
So we can now be exceedingly clever here and employ some seriously advanced mathematics and add up all these components of the 2013 emissions and also all the components of the 2014 emissions yielding 10.655Gt(C) for 2013 and, hold on a bead has fallen off my abacus, 10.885Gt(C) for 2014. So that shows a total annual increase in CO2 emissions of 0.230Gt(C) or (230/10655)/100 = 2.159%.
Of course we could employ other mathematical approaches. bobcobblog appears to employ some statistical method as he tells us “it’s improbable that you can get a 400 percent increase in rate of emissions from sources that make up a small percentage of the total.” He thus concludes that my approach has to be smoke and mirrors, some mathematical slight of hand. As bobcobbblog rightly claims, there is an error, some dreadful mistake being made. If we divide the 2013-14 FF %increase by this 2013-14 total %increase 0.512/2.159, we arrive at that whopping 418% increase in the size of the annual increase. Can that be right?
There must indeed be a mistake. And all we await now is for bobcobbblog to admit to making it.
Wait a minute Al, you say the .6% figure includes fossil fuels and cements. That point undermines your whole argument. How can you subtract from that and get to 2.2%. The 2.2 figure is averaged a year from 2005-14, but the growth rate for 2014 alone is .6%. You’re extrapolating an average for a decade to one year. I didn’t make the mistake, you did.
For those curious about this latest twist in the ramblings of Uncle bobcobbbling&all, the fool has managed to spot another quantity equal to 2.2%, this from within the abstract of Quéré et al (2015) and presumably he finds this too much to be simple coincidence so he cannot resist to weave it into his nonsensical arguments – “For the year 2014 alone, E(FF*) grew to 9.8±0.5 GtC /yr, 0.6% above 2013, continuing the growth trend in these emissions, albeit at a slower rate compared to the average growth of 2.2%/yr that took place during 2005–2014. Also, for 2014, E(LUC) was 1.1±0.5 GtC/yr, G(ATM) was 3.9±0.2 GtC/yr, S(OCEAN) was 2.9±0.5 GtC/yr, and S(LAND) was 4.1±0.9 GtC/yr. G(ATM) was lower in 2014 compared to the past decade (2005–2014), reflecting a larger S(LAND) for that year. The global atmospheric CO2 concentration reached 397.15±0.10 ppm averaged over 2014.” (*inc cement.)
For those interested in the messed-up math of one Dumb Al, he has used fuzzy math to extrapolate an average of 2.2 percent over the course of a decade to a single year. The dummy has taken cement totals that make up a tiny fraction of anthropogenic greenhouse gas emission and projected a more than 400% increase in the emissions growth rate of .6% for 2014.
I have an idea. Why don’t we ask an actual statistician in Tamino? What does he think?
[Response: I think the tone of this conversation makes me not want to get involved.]
Tamino – thanks for this. I’d wanted to see the rate of increase without El Nino’s influence for a long time. I’m puzzled by there being no mention of the reported 3.1ppmv rise of CO2 last year – perhaps the reports are not yet validated ?
Some further aspects of the ecosphere response worth noting include the report by Brienen et al on a 30yr Amazon study : “Long-term decline of the Amazon carbon sink” at: http://www.nature.com/nature/journal/v519/n7543/full/nature14283.html which found that the CO2-fertilization effect has been tailing off for many years, that it causes trees’ faster growth but younger deaths, and that it has generated a 30% increase in necromass on the forest floor over the last 30yrs. Brienen put a good article discussing the report onto “The Conversation,” which can be seen at: https://theconversation.com/amazon-carbon-sink-is-in-decline-as-trees-die-off-faster-38946 – I’m told by a forest ecologist friend that from this evidence these effects should be viewed as global, and should be seen in the context of pest-, ozone- and drought-driven forest dieback alongside intensifying drought-events raising the global incidence of wildfire.
There are also two other major feedback CO2 sources reported in the literature, one being the outputs from the huge global soil carbon reservoir due to desiccation by droughts’ rising area, intensity and duration, and the other being a rather bizarre CO2-fertilization effect on peat-bogs. A 6%/yr rise in the dissolved organic carbon [DOC] content of peatbogs’ outflow streams (from where it quite rapidly outgases) was observed globally in the early 1960s. While it continued on that exponent in following decades no mechanism linking it to the rise of airborne CO2 could be found. Then around 2000 Dr Foreman of Aberystwyth Uni identified the causal microbial sequence and reported it in “Nature,” with Fred Pearce then doing an article on it in “New Scientist.” The study found that due to raised CO2 one peat-microbe has a population boom, and that its predator-microbe has a consequent population boom and that the enzyme it uses to ‘digest’ its prey just happens to break down peat, releasing its carbon. The scale of this global effect was described by Foreman in a projection that, if the current rate of increase of CO2ppmv were maintained, by about 2064 the CO2 output from the fertilized peatbog decay feedback would exceed the current anthro-CO2 output.
I’m sorry to say that I didn’t record the study’s details, and as I’m not in a position to subscribe to the major journals I’m unable to provide a link to it – but perhaps those with access might trace it and post a link?
One further step in the analysis that would be very informative would be stripping the annual anthro-CO2 outputs from the Keeling curve and running the sequence of graphs to see how the ecosphere response is changing. The use of ‘best estimate’ LUC outputs alongside ‘recorded’ fossil fuel + concrete outputs would mean the result was indicative rather than accurate, but it could still be of real value.
Regards,
Lewis
Nice post, very informative and well done. Meanwhile, in the US, coal is getting the crap kicked out it by natural gas as a result of fracking advances. Not Obama policies but pure economics. Coal is mostly used for electricity production. Coal produced 57% of electricity in US in late 80’s, now it is 32% and dropping fast. Natural gas up from 10% to 33% and rising. Non-hydro renewables up from 0 to 8% and rising. Coal companies are going bankrupt one after another not because of regulations, but because it is uncompetitive with alternatives. This will repeat itself across the world. Next, electric cars are the future, and inevitably will eventually replace gasoline powered vehicles. Strike two against fossil fuels. Have faith in humanity, we are a clever lot.
Natural gas from fracking is a fossil fuel. I’d say half a strike maybe against fossil fuels in the US so far.
With a lot of respect, I have to take issue with your concluding remarks’ assertion of govts’ lack of serious action on climate being caused by their serving fossil lobby interests – for which I’ve yet to see cogent evidence. There are a series of independent lines of evidence against this assessment that support the hypothesis of a covert policy of US official inaction which depends on massive denialism for political cover. They include:
– The fossil lobby providing a mere ~8% of US GDP, with most of the rest coming from other corporations who are predictably equally well informed of the climate predicament,
– and who, were the govt merely serving the fossil lobby against their commercial interests, should long since have massively countered the supposedly fossil-funded denialism and demanded commensurate govt action.
– The disparity between US conditions and those in the EU, where only the most pro-US-dependence right-wing politicians try to dispute climate science (notably in the UK, Denmark, Poland and Chechia)
– and where the relatively far more powerful fossil majors, including Shell and BP, will have nothing to do with promoting climate denial,
– and instead in Paris lobbied hard for a global carbon price,
– while EU non-energy corporations pressed for a global goal of “net-zero emissions by 2050.”
For the ‘received wisdom’ on denialism to be correct and the idea that since its surge in 2009 its role has been to provide political cover for US govt inaction to be mistaken, not only would the US fossil lobby and US conservative politicians have to be grossly unethical and corrupt in comparison with their EU counterparts (which is very disputable), but also the great majority of US corporations would have had to accept being silenced by the lame-duck minority fossil lobby, while in the EU they are not so silenced. Moreover the US govt would have had to be similarly subservient to its minority fossil lobby against the interests of the great majority of its industrial and financial corporations (let alone its people).
Add in the fact of a new Democrat President being persuaded to adopt his Neo-Con predecessor’s climate policy of blocking any global deal but one that is purely voluntary in the scale of nations’ emissions cuts – i.e. is of the minimum possible constraint on global GHG output – and there is a clear indication of a covert objective driving the lack of commensurate action. If there are arguments to counter this view, I’d be glad to read them. Equally, I’d welcome interest in the idea that the climate movement has long been conned into barking up the wrong tree, and urgently needs to review its priorities.
Whether that covert objective is the maintenance of US global economic dominance (that serves all US corporations’ interests) by the climatic destabilization of its Chinese rival, is another question – but I’ve yet to find any other motivation for inaction on which both Neo-Con and Democrat politicians could be expected to concur.
Regards,
Lewis
Lewis, what is your alternative hypothesis?
I’d add that I interpret President Obama’s course on climate change wrt to the Paris Accord to be a work-around for the Republican-held Senate, which would have had to ratify a conventional treaty, not a matter of “being persuaded to adopt his Neo-Con predecessor’s climate policy.” That prior policy, after all, failed to include new energy efficiency measures (including mileage requirements), support for alternate energy, and the contentious Clean Air Plan.
The hypothesis is that Cheney recognized in the 1990s, and later set policy to reflect the fact, that the USA has no preferable means of maintaining its long-cherished global economic dominance (on which the profitability of its energy, industry and financial corporations largely depends) against the inexorable and entirely predictable rise of China’s economic power,
other than delaying the commensurate international mitigation of ‘Anthropogenic Global Over-Heating’
in order for it to impose a climatic destabilization of agriculture causing crop failures and food shortages in China, leading civil unrest and chaotic regime change.
All other means of pressure short of war (against a nuclear power) will predictably be applied, but such is the strength of Chinese nationalism that some are probably counter-productive (e.g. the South China Sea circus) and none can be seen as reliably productive of the regime’s overthrow – For that to occur it has to be massively and fundamentally discredited by a critical failure within China – and a failure to keep its people fed would be a classic cause of the desired rebellion.
WRT the timing of the objective’s achievement a study led by the IPCC lead-author, Prof. Peirs Forster, is worth considering: “Food Security: Near future projections of the impact of drought in Asia” see: http://www.lowcarbonfutures.org/sites/default/files/Food%20Security%20-%20Near%20future%20projections%20of%20the%20impact%20of%20drought%20in%20Asia.pdf
In the press release for it in 2012 he wrote: “Research released today shows that within the next 10 years large parts of Asia can expect increased risk of more severe droughts, which will impact regional and possibly even global food security. On average, across Asia, droughts lasting longer than three months will be more than twice as severe in terms of their soil moisture deficit compared to the 1990-2005 period. This is cause for concern as China and India have the world’s largest populations and are Asia’s largest food producers.
Dr Lawrence Jackson, a co-author of the report, said: “Our work surprised us when we saw that the threat to food security was so imminent; the increased risk of severe droughts is only 10 years away for China and India. These are the world’s largest populations and food producers; and, as such, this poses a real threat to food security.”
Given the similarly rising incidence of severe droughts in various other regions, including S. Europe and the Mediterranean Basin, S.Russia, South Africa, Brazil, Australia, and W.& C. USA, we are liable to see the onset of serial global crop failures during the 2020s as regional crop failures coincide in two or more major food-producing regions. Prof Forster’s study implies a strong probability of China being one of those regions, and with internationally traded food-stocks being witheld from the market it would be reliant on its own failed production.
From this perspective the latest pledge by the USA of a 12% emissions cut off 1990 by 2025 may act as a well-hyped face-saver, but it is plainly neither effective in encouraging the scale of other countries’ ambition nor is it at all relevant in terms of disrupting the covert policy of inaction. What few token efforts have been made since 2009 including the CAFÉ standards and the proposed coal-power efficiency regs would not be fully achieved before 2025, and are probably not enough to fulfil even the derisory pledge of 12% off 1990 in ten years time. The EU, for comparison, will cut between 30% and 40% by 2025.
For a heavily abridged outline of the evidence for the hypothesis, you may find the 4th section of the post I put into the “Tell Me” thread to be of interest.
Regards,
Lewis
So Lewis, are you a government insider or something? Do you have access to CIA files? I thought not. More BS
You thought wrong, so your uncouth reply was uncalled for. I’m no kind of insider, though in the past I’ve spent time amongst upper echelons of the UK hierarchy.
What I’ve done is to observe the global diplomacy, acquiring mostly public domain information, quite carefully for over three decades, collecting a documented body of evidence along the way.
Pity you’re not interested in fresh perspectives.
You like the tree you’re barking up that much ?
The only uncouth thing is your wild conspiracy theories surrounding President Obama. And some of your so-called facts are way off-base. It doesn’t take a genius to figure that out. In fact, I can think of one scientist who thought your idea on temperature ranges over at ecoshock was a load of crap.
Once again Lewis, your “facts” are misleading. Obama’$ emissions pledge is actually 26-28% below 2005 levels. How you missed that part is beyond me, unless you intentionally did so. And the idea that Obama is secretly trying to undercut his own emissions policy is patent ridiculous. Why would he put moratorium on coal gathering from federal lands, ban drilling off the Atlantic coast, and regulate methane emissions from new and existing infrastructure? Your conclusions on US policy are clearly wrong, which leads me to think you’re doing it on purpose. Sad that you feel you have to resort to outright lying…
Your three gratuitously abusive replies make clear that your interest is in bullying egotistical games rather than rational discussion of the evidence. You also make plain your ignorance of the subject, not having bothered to make even a cursory study of the geopolitics of climate.
Had you done so, you would be well aware that all of Obama’s much-hyped deficient actions in combination are not likely to meet his Paris ‘Pledge’, submitted as “At least 26% off 2005 by 2025”.
You would also know that this ‘Pledge’ was the result of his reneging on his own, higher, “Cancun Pledge”.
You would also know that 26% off 2005 by 2025 is in fact 12% off 1990 US emissions in ten years time, with 1990 being the legal UNFCCC baseline for all emissions negotiations to which the US signed up.
Similarly, you would know that far from banning “drilling off the Atlantic coast” he has just been forced to back down on his own proposal of opening the Atlantic coast to drilling, under his “All of the above” energy resources policy.
It would take a juvenile malicious idiot to accuse you of lying on these various counts – when in reality you are plainly just too idle to study and too gullible under the ‘received wisdom’ to think for yourself.
Quite why Tamino should want to post your bullying abusive input degrading the discussion on this site is a puzzle. It does nothing to advance the concept of “Open Mind.”
[Response: I’d say that both sides of this discussion have been less than collagial.
I’d rather have readers arguing with each other, even outside the bounds of pure civility, than restrain their passion for ideas and opinions. That said, a bit more calmness would be more productive, and might be far more persuasive to third-party readers. It would also be more entertaining if the purveyors of recent snark did so more artfully.
As for Obama, he’s far from the perfect choice to lead the effort to revise America’s climate policy, but given the extraordinary hostility of today’s political environment I think he’s done far more than most in America. Let not the “perfect” be the enemy of the “good.”]
Lewis, I call BS when I see it. If that offends you, then I suggest you grow a thicker skin.
And Obama wasn’t forced to back down from anything. The agreement he made with PM Trudeau to regulate methane from existing infrastructure is proof positive of that. The man is regulating all power plants emissions under the CPP and is also planning regulations for aircraft as well. In what world does that make him unfit?!
As for the 26-28% pledge, it can be achieved based on an expansion of his policies, which Clinton will do. I’ve seen analyses that suggest it is very possible.
It’s been abundantly clear to me that you don’t like it when someone challenges you on your rather wayward interpretation of facts, as demonstrated by your irritable replies. I’ve seen some of your more bizarre posts on ecoshock, and I’m not impressed at all.
Confidential suggestion for a topic: Big Earthquakes frequency increasing? Just when does it become statistically significant?.
“For a variety of magnitude cutoffs and three statistical tests, the global catalog, with local clusters removed, is not distinguishable from a homogeneous Poisson process. ”
However, there is a physical mechanism underlying future quakes,,,Post-glacial rebound – the ice mass released from Greenland and Antarctica will certainly cause a significant isostatic rebound. It may not be much now, but will certainly be so in the future… time for a baseline? Seems like a great topic.
Quick searches:
http://www.pnas.org/content/109/3/717.full?sid=e906ad30-c20a-41fb-b383-16aa538d39fe
Global risk of big earthquakes has not recently increased
“Abstract
The recent elevated rate of large earthquakes has fueled concern that the underlying global rate of earthquake activity has increased, which would have important implications for assessments of seismic hazard and our understanding of how faults interact. We examine the timing of large (magnitude M≥7) earthquakes from 1900 to the present, after removing local clustering related to aftershocks. The global rate of M≥8 earthquakes has been at a record high roughly since 2004, but rates have been almost as high before, and the rate of smaller earthquakes is close to its historical average. Some features of the global catalog are improbable in retrospect, but so are some features of most random sequences—if the features are selected after looking at the data. For a variety of magnitude cutoffs and three statistical tests, the global catalog, with local clusters removed, is not distinguishable from a homogeneous Poisson process. Moreover, no plausible physical mechanism predicts real changes in the underlying global rate of large events. Together these facts suggest that the global risk of large earthquakes is no higher today than it has been in the past..”
http://earthsky.org/earth/are-large-earthquakes-increasing-in-frequency
“Bottom line: Scientists analyzed the historical record of earthquakes greater than 8.0 in magnitude and concluded that the global frequency of large earthquakes is no higher today than it has been in the past. Results of the study were published on January 17, 2012 in Proceedings of the National Academy of Sciences.”
http://www.earth.webecs.co.uk/
Trends since 1986
“For example, between 1986 and 1996 (incl), a period of 11 years, there were “just” 15 earthquakes listed by USGS of magnitude 7.0 or greater. This is not markedly different (albeit a slight decrease) from previous (similar periods) of 20th century, where an average of about 18 might be expected.”
“But between 1997 and 2007 (incl), a period of only 11 years, there were 99 earthquakes with magnitude 7.0 or greater : This is more than a six-fold increase on the previous similar period – and is a stark increase on any earlier decades in 20th century too.”
http://earthquake.usgs.gov/earthquakes/search/
http://earthquake.usgs.gov/earthquakes/eqarchives/year/eqstats.php
http://www.livescience.com/45764-earthquake-cluster-2014-for-real.html
What is needed is to plant a lot of trees. Irrigated plantations in most of the Sahara desert and the Australian outback might be enough.
This would be a $150 billion per annum project for the next 200 years. The USA caused most of the excess so ought to pick up most of the tab.
Planting trees is a only a short-term solution – 500 years at best. Unless the plan is to bury the timber so that the trapped carbon is sequestered, the rotting or burning plant material releases the CO2 back into the atmosphere and you’re back where you started.
Oh, and if it were viable to irrigate central Australia, it would have been done by now. The soil is old and essentially infertile and we simply don’t have the rainfall to supply the water required. Where does the irrigation water come from?
Not to mention the blithe indifference to existing ecosystems!
Which species of ‘trees’, he wondered? As someone who does this for a living – revegetation – I’d argue this kind of cornucopian/utopian handwaving is almost as great a threat to already straining existing ecosystems as the BAU full-steam-ahead ecological indifference that got us here in the first place!
This argument would much better suit already trashed landscapes dropping out of agricultural production at the margins. Australia has plenty of them. Google ‘Goyder’s Line’, for example. Even then, anyone who imagines they’re going to see ‘forests’ in the sense of regimented European-style monocultural plantations just doesn’t get it. Do a google image search for ‘casuarina pauper woodland victoria’ for example.
David – On this I think we differ only on the detail of what is the most practical option for Carbon Recovery. Leaving aside the question of dependence on irrigation, I’d suggest that it would be very hard to make a difference simply by afforestation for natural sequestration, not least because forest matures within 60 to 100yrs to close to a steady-state carbon bank, and sequestration is then cut to the amount used in building new soil – which is minimal under both tropical and boreal forests.
The means of getting an open-ended sequestration at a far better rate /ha/yr without incurring serious process emissions is fortunately quite straightforward.
– First, the sylviculture used is that of native coppice, whereby the trees are felled at between 7 and about 25yrs of growth and the stumps are allowed to regrow – which they do about 20% faster than new plantings due to the large extant root ball. This also resets the tree’s clock and can be continued for centuries – the oldest known UK coppice tree being a hazel near Ashford in Kent that was planted during the Roman occupation.
Next the annual harvest of wood from the coppices is processed in dispersed ‘village-scale’ charcoal retorts (which minimize the feedstock haulage). The process of pyrolization to extract the wood’s carbon is heavily endothermic – that is it emits energy in the form of heat, and needs no energy input beyond a spark to provide ignition. This avoids the issue of process energy emissions that most other CO2 removal systems would require.
Next the charcoal is milled to ~2.0mm and is charged with a small percentage of a suitable compost or manure, and is delivered to farms for plowing in as a part of normal cultivation. Trials in over 25 countries have shown that so long as the charge is appropriate for the land it’s used in, the charcoal can greatly raise crop yields particularly in poor tropical soils, while also serving as a soil moisture regulator and cutting losses to drought and to flooding. The practice has ancient origins, in that an area of the Amazon equal to that of France and Spain combined was heavily treated with charcoal – mostly around 2,000 years ago in plots of up to 400ha.s – and is much prized by farmers for its excellent fertility and lack of need of expensive chemical fertilizers.
One further point worth noting is that during charcoal production around 28% of the wood’s energy potential is emitted in the form of hot hydrocarbon gasses – which are readily processed into the liquid fuel methanol. (The last UK coppice methanol plant in the Forest of Dean was out-competed by subsidized North Sea Gas feedstock in the 1970s). Having a co-product methanol output provides the process-transport fuel and also a surplus for sale and thus a second revenue stream alongside charcoal sales to help reduce the externally-funded cost per tonne of carbon recovered.
To be effective in cleansing the atmosphere this century this approach would need a rapid phase-out of anthro-CO2 emissions, with the afforestation started around 2020. Its scale would need to be that of a new global industry – using around 1.6GHas of suitable non-farmland identified in a joint WRI-WWF study as being globally available for afforestation. Besides its Carbon Recovery function and its two revenue streams minimizing costs, it would also offer strategic benefits, including: – huge new areas of native afforestation, massive new rural employment, and a major improvement in global food security.
The core issue delaying the agreement of a global program in Carbon Recovery is not the ignorant critiques of ‘isolationist’ anti-productive-forestry NGOs who denigrate the coppice-charcoal option and traduce its practitioners. In my view the prime hurdles are the scarcity of recognition that rapid Emissions Control is urgently necessary but no longer sufficient, and that in the use of native coppice forestry for charcoal we have an eminently practical long-proven means of steadily cleansing the atmosphere.
Regards,
Lewis
Another reason that El Niño years tend to have higher CO2 emissions is that Indonesia continues to burn forest for land clearing during droughts.
The trends looks to be following global GDP patterns, e.g. the 2008 post-GFC downturn.
https://www.wunderground.com/blog/JeffMasters/february-smashes-earths-alltime-global-heat-record-by-a-jawdropping said, ” The big jump in CO2 (its atmospheric concentration, comment added ) in 2015 is partially due to the current El Niño weather pattern, as forests, plant life and other terrestrial systems responded to changes in weather, precipitation and drought. In particular, El Niño-driven drought and massive wildfires in Indonesia were a huge source of CO2 to the atmosphere in 2015. The largest previous global increase in CO2 levels occurred in 1998, which was also a strong El Niño year. “
Scientifically literate people have trouble imaging what it’s like not to be equipped with that literacy.
Simply put, a reduction in the rate of increase is still an increase. All the graphics and numbers in the world will not get this simple point across, unless you make it perfectly clear at the outset, and don’t think if you’ve said it once you don’t need to say it every time it comes up.
Losing weight involves first slowing the rate of increase, then leveling off, and then the reduction can begin. It’s hard work. Negative emissions are necessary, but for most people they cannot imagine not continuing to increase, let alone the difficult rest of the job.
Hence, magic thinking. Somebody clever in the future will think something up, so we don’t have to do nuffin. Sickening!
Planting trees is good, but returning carbon to fields used for agricultural crops. At one time, ag soils contained large amounts of carbon due to use of animal manure for fertilizers and leaving fields fallow on a schedule. After the dust bowl, farmers had to leave fields fallow, and plow in the “green fertilizer” to get a farm subsidy. Now, farmers that use fallow fields in their crop rotation are not eligible for subsidies. The US national policy is to oxidize carbon out of our agricultural row crop land.
Starting with a mostly mineral soil (common in modern ag soils), it is not hard to build carbon content to several tons per acre in a couple of years. The result is more fertile land that produces more food on less area.
Yes, it is an ongoing effort to maintain organic material in the soil, but we are talking about large areas (http://usda.mannlib.cornell.edu/usda/current/CropProd/CropProd-04-12-2016.pdf page 6), so large amounts of carbon can be rapidly pull out of the air, kept out of the air as long as we are good farmers.
Don’t invest too much in Mauna Loa numbers. It’s higher than the global average and more prone to the wild seasonal Northern hemisphere fluctuations than measurements in the Southern hemisphere or closer to the equator. I think a global average CO2 number would be more meaningful, just as we have for global temperature anomaly.
For the global average, try here: http://www.esrl.noaa.gov/gmd/ccgg/trends/global.html
i compared Cape Grimm, Mauna Loa, and the ESRL global average, and the differences are less than 2ppmv when the “wild seasonal fluctuations” (~7ppmv) are removed. Some of that is due to the different methods used for smoothing used in the different datasets.
We have already reduced global emissions of CO2 during periods of global economic crisis, like 2008-2009. i wonder if these periods can be detected as a reduction in the rate of atmospheric CO2 increase. My guess is they can’t. Everybody assumes that a reduction in emissions reduces the rate of increase in atmospheric CO2, but we have no evidence for that.
Thank several of you for comments pertaining to growing trees. Here are my sources:
Could Planting Trees in the Desert Mitigate Climate Change?
http://www.sciencedaily.com/releases/2013/07/130731093456.htm
This group suggests planting Jatropha curcas unlike
Irrigated afforestation of the Sahara and Australian Outback to end global warming
http://www.springerlink.com/content/55436u2122u77525/
where a large eucalyptus is suggested. This abstract links to a pdf file which is freely available.
Using the Sahara Desert and Austrailian Outback offer an energy infrastructure advantage not available in most other locations, but is not essential. There are many variations and probably it will prove wise to try many rather than attempting to predict the optimum. The coppice plan might work quite well in the Maghreb and south into the Sahara as there are many underemployed there who could perform the coppicing.
Indeed, one uses biochar
http://www.biochar-international.org/biochar
to keep some of the carbon from re-oxidizing and to improve soils.
The irrigation is from desalinated sea water; it seems sensible to use solar PV to energize the process and the water pumping.
The main difficulty is not technical. It is rather obtaining the agreement of at least the US government and at least one of the proposed host governments to proceed with such a plan. That requires creating some form of movement, according to Bill McKibben. I don’t know how to do that.
As a coda about the area required start by noting that the area of the contiguous 48 states is just over 8 million square kilometers. The total Sahara desert area is 9.4 million square kilometers while the area of Australia, all of it, is a bit shy of 8 million square kilometers. The plan might call for half of that and does not call for all of the Sahara desert, just most of it.
Ferdinand Englebeen as gone to a lot of trouble to set the CO2 record straight for fellow skeptics.
http://www.ferdinand-engelbeen.be/klimaat/co2_measurements.html
Skeptic sites let him do articles on it, and he gets the science right (AFAIK). His diligence on the topic is praiseworthy.
Thanks, Barry. Quite interesting. I tackled that, too, but not in such detail–the target audience was more general:
http://hubpages.com/politics/How-Do-We-Know-That-Humans-Are-Responsible-For-Rising-CO2
I think that the shape of the Poisson distribution is determined by the rate of strain accumulation in earthquake zones, and the brittle failure physics of basalt seafloor plates around the Pacific, or continental crust in the Africa – Europe and India – Asia collision zones. The mid continent earthquakes – New Madrid fault, Kansas fracking quakes – may have different physical properties, but are so comparatively rare they they don’t affect the distribution much. As North America moves over the Yellowstone hotspot, and it is no longer under the Rockies but passing the New Madrid fault, there may be some interesting consequences, e.g., thermal expansion of the continental crust near the NM fault may trigger some quakes. The timescale for that is millions of years.
If an area is near the maximum stress, changes in stress due to other earthquakes would hasten (or delay) the failure; but the following failure would occur later (or sooner), since the plate motion rate responsible for the strain changes on 100 million year timeframes. If the return time for a Cascadia subduction quake(250-900 years) aligns with an occurence for the San Andreas fault(~100 years), one could trigger or delay the other. But the effect long term would be frequency modulation around the mean, generating beat frequencies.
Since there are many influences on stress besides just the plate motion – solunar tides, accumulation/depletion of groundwater, lumps of subducting seafloor with different mechanical properties & water content -. the return time is noisy (variable). This noise will likely obscur any interaction between earthquakes, except in rare cases(e.g. different segments of the San Andreas fault) or close proximity(e.g., aftershocks).
I would espect that isostatic adjustment in Greenland will cause more earthquakes locally, but I doubt it will have a discernible effect in e.g. Italy.
Click to access Ice_melting_Olivieri_Spada.pdf
Speaking of CO2. This is an interesting paper about the carbon sink loosing their capacity,
Curran, J. C., & Curran, S. A. (2016). Indications of positive feedback in climate change due to a reduction in Northern Hemisphere biomass uptake of atmospheric carbon dioxide. Weather, 71(4), 88-91.
Mauna Loa Observatory data for atmospheric carbon dioxide (CO2) reveal, within each calendar year, a regular seasonal fluctuation: in summer, a drop in concentration occurs as the Northern Hemisphere drives uptake of CO2 into biomass, whereas in autumn/winter an increase in CO2 occurs as the Northern Hemisphere releases it through biodegradation. Analysis of the magnitude of this drop allows an estimate to be made of the biomass activity each year in the Northern Hemisphere. There are indications of a small decline in such activity since around 2006. This has potentially serious climate change implications as it may be evidence of positive feedback.
the stats looks weak to me. Also, the authors only work with Mauna Loa, which is not exactly global.
Hi Tamino,
It looks like things have calmed down. Would it be possible if you could tell me if I’m correct to be skeptical about Al’s claims of a 2.2% increase.