
NASA has released the global temperature estimate for February of 2016. It’s a new record for the hottest monthly anomaly yet.
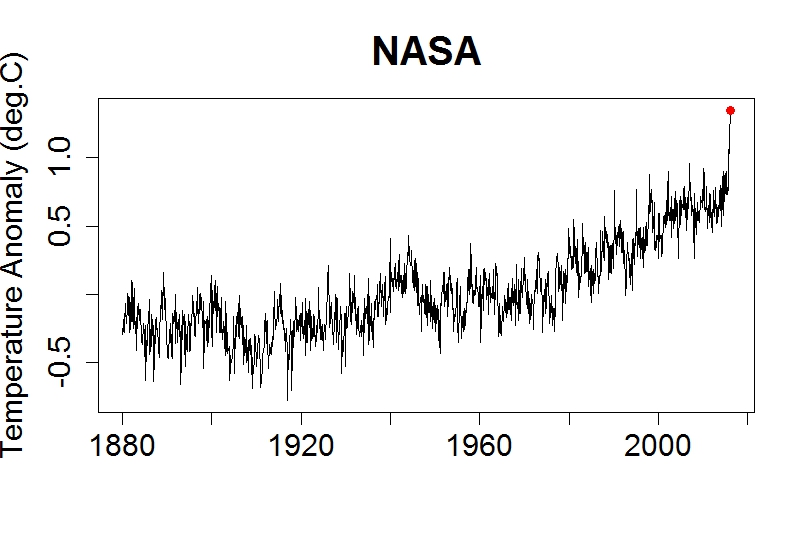
The red dot at the end marks the latest monthly value.
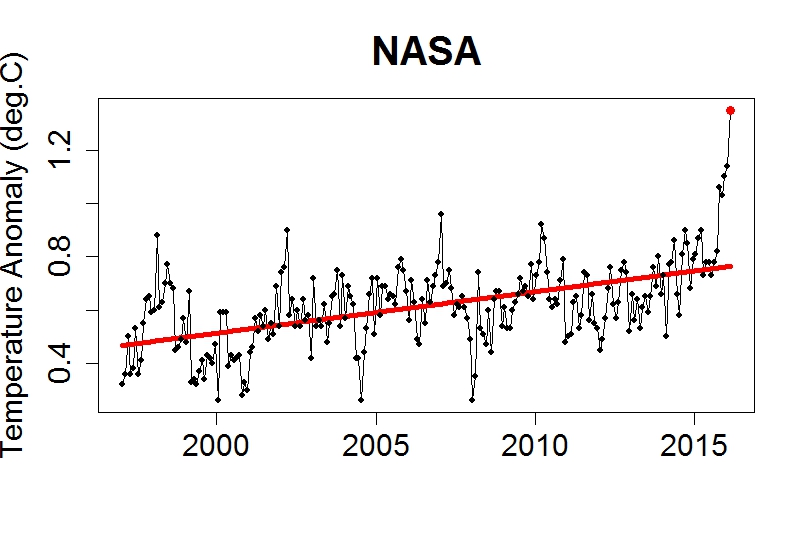
Deniers like Ted Cruz like to start their temperature graphs in 1997 or 1998, to hide the context which makes continued warming obvious. But that trick won’t work any more; here’s a view since 1997:
Deniers like Ted Cruz also like to show satellite-based estimates of temperature in the atmosphere rather than at the surface (where we live), because it shows less warming than the surface temperature data. They also like to claim that it’s the “best data we’ve got” — which is ironic, because Carl Mears (lead scientist of the team that processes the data they use, from Remote Sensing Systems) thinks the surface temperature data is better. In any case, those tricks won’t work any more either; here’s a view of satellite data for the troposphere:

The red dot at the end marks the latest monthly value.
It’s often noted that a single month is a limited view of what’s happening lately, that there’s also value in seeing what’s happening on the time scale of an entire year, and that 12-month running means are a way to do that. Here they are:

I like to emphasize that what matters most is the trend:

It’s going up. Has been, steadily, no pause.
The continuing barrage of record-breaking heat is remarkable. That’s because of the trend. Of course there’s fluctuation too, but without the trend we wouldn’t see records getting smashed again, and again, and again, year after year, month after month. We’re sure to see times again — soon — when the fluctuations go the other way and we get a respite from record-breaking heat. But that respite will be brief, because fluctuations will turn hot again too; that’s what they do. When they do, they’ll be added onto an even hotter trend value, because the trend isn’t going to stop any time soon.
Any way you look at it, not only was it a scorcher of a February, the trend is rapidly taking us down the path to worse trouble than we’re already in. Except one way: if you put your blinders on and refuse to see reality, because you’re in the grip of an ideology that denies science when you don’t like it, you’ll believe what you want to believe regardless what the facts say. Like Ted Cruz. And Donald Trump. And Marco Rubio.
If you value this post, feel free to donate at Peaseblossom’s Closet.


By breaking the February record set in 1998, the oldest remaining monthly record is for March in 2010. Only 2 month-to-month changes have been large enough for March 2016 to not break that record, leaving April 2010 and July 2011 as the only records before 2014. It’s likely that by the end of July, all of the records will have been set in 2014 or after.
February goes to 11.5:
Hadley are still showing their plot for January – http://www.metoffice.gov.uk/hadobs/hadcrut4/data/current/web_figures/anomalies.png – that goes up to +17.3C !!!
p.s., here’s the plotting tool Gavin refers to:
http://www.giss.nasa.gov/tools/panoply/
I use panoply for plotting all my spatial information, it’s easy to work with.
I’ve plotted an ENSO-adjusted version of the data up to Feb2016, which is undoubtedly imperfect in this case. But https://twitter.com/CColose/status/708756864402595840
We have a lot of new hockey-sticks now, based on instrumental data only…
What is the 30-year trend ending on Feb 29, 2016?
1.749 °C/Century.
Link
http://www.moyhu.blogspot.com.au/p/temperature-trend-viewer.html?Xxdat=%5B0,1,1,0,359%5D
“Record-breaking” doesn’t begin to describe it. Record-shattering comes closer.
The GISTEMP Land-Ocean Temperature Index for February was 1.35 °C. The next warmest month on record was 1.14 °C, going all the way back to January 2016.
For comparison, the GISTEMP index for 2015, by a very wide margin the warmest year on record, was 0.86 °C.
It is amazing by how much the record was broken. Highest anomaly before 2015 was 0.96K in January 2007. The current one is full 0.39K higher. Even more impressive is the average for winter 2015/16. It is 1.20K – higher than any other month to date and 0.36 higher than previous highest season (spring 2010).
One possible – but not certain – outcome may be the temporary pause of the “no warming” lie. Without constant lies from right-wing media maybe some people will get it and the political balance will shift.
oops, lost the link — here’s February goes to 11.5:
It’s not ideology that dictates Ted Cruz’s view on climate change — it’s his fossil fuel donors.
It’s both, with a rather large dose of political opportunism thrown in.
Without El Nino the long term trend would have put 2016 at around GISS 0.8C.
Past El Ninos have peaked around 0.3C above the long term trend.
As of February 29th the present El Nino is 0.55C above the trend and counting.
Would anyone care to speculate why?
With the best will in the world there is still considerable uncertainty in each month’s figures. I don’t know if NASA GISS publish uncertainty estimates, but they are published by HadCRU.
This could explain the discrepancy you identify – but it makes very little difference to the long term trend.
GISS confidence limits are+/- 0.09C.
It’s because statistical trendlines have been tricked by the unusually persistent cool period of 2006-2013 into showing a lower trend than the “true” multi-decadal warming rate. The slope intercept with now should be a couple of tenths higher.
That’s a really gob-smacking anomaly — far more than anyone imagined.
It should be front page news around the world.
However, as no amount of evidence and facts have made any dent in the denial industry for the last three decades, I don’t expect even this to have much impact unless electorates can get properly informed and vote appropriately.
Climate change might not make front page news, but the effects do.
I work in Charlotte (NC) and after the recent floods a few months ago in SC there was page after page of coverage in the local newspapers about the floods, but not a single word about climate change.
The storm itself cannot be blamed on climate change, but it’s likely to have made it worse:
http://www.theguardian.com/us-news/2015/oct/05/south-carolina-floods-climate-change
You would have thought the newspapers might have at least mentioned it.
Hm, I did post the link in responses above twice, and “view source” shows the link is there to the pictures (with the anomaly that goes up to 11.5) in Gavin’s comment on Twitter — but what I posted above is invisible in this blog format. Well, you can find that, probably, if you search for:
Gavin Schmidt @ClimateOfGavin
Updates for February in @NASAGISS temperature analysis. Wow.
—-
Wow, yes.
Sou now on facebook
https://www.facebook.com/HotWhopper-356926434444732/?fref=nf
Headline, “The pause that never was ends with a bang!”.
“[I]f you put your blinders on and refuse to see reality, because you’re in the grip of an ideology that denies science when you don’t like it, you’ll believe what you want to believe regardless what the facts say.”
True. Only problem is, Kochs and other billionaires (Art Pope, Foster Friess) and fossil fuels industries are still paying political candidates large sums of money to take blinders, put them on, and keep them on. MHO. Recommended reading: “Dark Money: The Hidden History of the Billionaires Behind the Rise of the Radical Right,” by Jane Mayer.
Tamino,
I’d be interested in your take on Attribution of Extreme Weather Events in the Context of Climate Change, now in pre-print by the US National Academy Press. It was linked by Heidi Cullen in yesterday’s New York Times. It’s mostly about approaches to the study of AGW-extreme weather linkages, and also about framing. Thanks.
I have performed simple exercise. I have assumed that temperature evolution from now on would follow the previous El Nino years from peak – assuming that February is a peak of current one. Then I computed average anomaly for year 2016 with that assumed temperature evolution. The results are scary:
1997/8 – 1.17K
2009/10 – 1.12K
2006/7 – 1.07K
2002/3 – 1.22K
1982/3 – 1.14K
1972/3 – 1.18K
1957/8 – 1.05K
1987/8 – 1.18K
1963/4 – 1.20K
1991/2 – 1.26K
Assuming that the result for February was not just a gigantic fluctuation, and evolution of the temperatures will be typical for El-Nino year we will have another record anomaly on top of already very high anomaly of 2015. Possibly above 1.0K.
A large warming in the Arctic and NH continents contributed to the large February anomaly, not only El Nino.
I did a regression analysis based on the GISS and MEI data since 1950 to predict the GISS anomaly for 2016.
I get 1.02+-0.10°C without the Feb 16 GISS temp and 1.04+-0.10°C with the Feb 16 GISS for the expected 2016 temp. So, with reservations to unusual events like a very large volcanic eruption early in this year, we will see a new record temperature this year. The third in a row. But 2017 will be probably no new record year, due to lack of El Nino.
Hey Tamino- Is it OK to use on of the plots here in a post on Bad Astronomy? I just want to point out the pause doesn’t exist, and link back to this article here. Thanks!
[Response: Yes.]
Cool, thanks!
The third chart (RSS TTT) shows 1998 way up. The bettors’ question is what will happen ecologically if that anomalous 1998 spike starts to become the mean. From a stochastic viewpoint, it’s like if a bettor starts accepting another card in blackjack with 19 showing and keeps getting a deuce.