
One of the clearest signs of global warming is the disappearance of sea ice in polar regions, so dramatic that people actually take notice — and not just the people who live in the Arctic.
Climate deniers don’t want you to know that, so they say the opposite of what’s true, and when they show you some graph (hard to avoid that these days) they show it in the most deceptive way possible.
The Truth
Here’s what’s happend in the Arctic:

The graph shows sea ice area anomaly, the difference between sea ice area and what it typically is for the same time of year. That way, we remove the seasonal cycle and isolate the changes from year to year — which is what we’re really interested in. After all, we already know that summer is hotter than winter, what we really want to know is whether this summer has more or less sea ice than the other summers. Data are from NSIDC, the National Snow and Ice Data Center.
The red line shows the trend, which hasn’t followed a straight line. It highlights the changes that follow climate rather than weather. After all, we already know it’s going to fluctuate up and down even when climate is stable, what we really want to know is what direction it’s going apart from those fluctuations.
And the trend shows us that Arctic sea ice has declined, since we started looking with satellites, by about 1.8 million square kilometers (about 700,000 square miles). That’s bigger than the state of Alaska.
Here’s what’s happened in the Antarctic, plotted on exactly the same scale:

For a time it showed an overall increase, trending up by a total of about 0.73 million square kilometers (280,000 square miles). But the Antarctic increase didn’t last; in the last few years it has fallen off a cliff. The net change since satellites started observing has been decline (just like in the Arctic) of 0.885 million square kilometers (340,000 square miles). That brings the total decline in sea ice globally (both northern and southern hemispheres) to 2.7 million square kilometers (over a million square miles), bigger than the states of Alaska and Texas combined.
The Bad
The stunning decline of sea ice isn’t just evidence that global warming is really happening. It also has consequences.
For one thing, ice, on land or at sea, is highly reflective. When sunlight hits, ice can reflect most of it right back to space. That helps cool things off; sea ice is one of the most effective air conditioners for planet Earth. When ice reduces, the air conditioner sputters and the planet heats up even more — on of those feedbacks that makes things worse. It’s a well-known and undeniable phenomenon called ice albedo feedback.
It also strongly affects how major wind patterns behave in the northern hemisphere (you know, where most of us live). When ice cover isn’t where it used to be, lots of heat can go from ocean waters into the atmosphere, wreaking havoc with things like the jet stream. It’s the likely cause of the fact that the “polar vortex” has been acting crazy lately, which — ironically — can sometimes bring bitter cold air from the north pole down you your house.
The Ugly
EPA director Scott Pruitt has been ordered by the court to show the evidence behind his recent statement that he doesn’t believe mankind is responsible for climate change. The so-called “Heartland Institute” scurried to his defense, sending him their reports with their “evidence” to dispute what the overwhelming majority of actual scientists say. Perhaps the centerpiece of their propaganda is Climate Change Reconsidered, a litany of “doubt is their product” products.
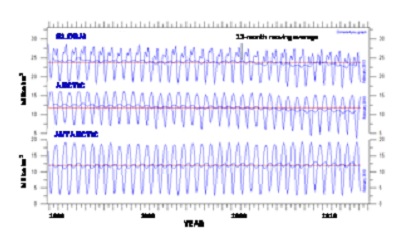
And what do they say about sea ice, you wonder? This:
The satellite observational record of sea ice spans only 1979–2012, and it has
recently shown increases in ice area around Antarctica and decreases in area in the Arctic Ocean. There has been little net change in the overall global area of ice over the past 33 years, as shown in Figure 5.10.1.
And what does their figure 5.10.1 show? This:
What’s wrong with that graph? Just about everything.
Let’s start with the fact that it’s damn hard to read. Fuzzy. Even if you blow it up it’s still fuzzy and mostly illegible. The source (they got it from somewhere else) isn’t that bad. Were they trying to make it too fuzzy to stand up to scrutiny?
Then there’s the fact that the main focus is on sea ice area, not sea ice area anomaly. That’s great if you want to know how different summer is from winter, but dreadful if you want to know how it’s changing over the long haul. Were they trying to hide the year-to-year changes?
We can’t blame them for leaving out everything from 2013 on, since their screed was published in 2013. But we can blame them for saying “There has been little net change in the overall global area of ice” when, using the data available back then (even before Antarctic sea ice fell off a cliff), the northern decrease was more than three times the southern increase.
And we can certainly blame them for “supporting” their claim by showing a graph which makes it plainly impossible to tell.
Making it impossible to tell what the truth is: that’s ugly.
This blog is made possible by readers like you; join others by donating at My Wee Dragon.


The climate4you website they give as the source for the graph

http://www.climate4you.com/SeaIce.htm#NSIDC%20recent%20Arctic%20and%20Antarctic%20sea%20ice%20extent
also has an up-to-date graph:
Literally off the chart.
Have you seen something recent attributed to NASA scientist Zwally asserting that Antarctica is gaining ice mass? The story’s being bruited about on pages like this:
https://yellowhammernews.com/upcoming-research-will-buck-the-consensus-and-show-antarctica-is-still-gaining-ice/
citing the “Daily Caller” neonazi press office, of all things.
That’s land ice not sea ice. Sorry for the digression.
That Daily Caller article is by the always-spinning Michael Bastasch, and it was also just published in WUWT under the headline, “NASA glaciologist Jay Zwally puts the hammer down: ‘Antarctica is gaining ice’.” The story has already gone viral across the deniosphere, as simply googling the phrase, “puts the hammer down,” will show. Obviously we should wait to see what Zwally really says as opposed to what chronic liar Bastasch said he says.
A year ago, Discover Magazine talked to Zwally, and he made reference to his upcoming paper, which is now apparently very close to release:
Quote:
Zwally still stands by his 2015 study, but in an interview last week, he said nature has recently changed the equation. His team is crunching numbers from the past two years, looking at ice melting and snowfall rates in Antarctica. And they found something startling.
The melt rates in West Antarctica just increased significantly. His calculations now show that the continent is in overall balance. The findings haven’t been peer reviewed yet, but he plans to present them at a science conference later this year.
“In our paper we said that might happen in two to three decades,” Zwally says. “Well, this is an unpublished result, but now we’re very close to the zero line.”
End Quote:
http://blogs.discovermagazine.com/d-brief/2017/05/16/is-antarctica-gaining-or-losing-ice-nature-may-have-settled-the-debate/
It will certainly be interesting to see what Zwally really says.
Those with long memory may remember Zwally wasn’t very popular with the “sceptics” back in 2007 when he talked about Arctic ice possibly being gone “in five years”.
https://news.nationalgeographic.com/news/2007/12/071212-AP-arctic-melt.html
It would be nice to connect these observations through DeConto’s observation that for every 1 cm of SLR at Antarctica Boston sees 1.2 cm, and the climate gentrification work from Harvard, namely, Keenan, Hill, Gumber, “Climate gentrification: from theory to empiricism in Miami-Dade County, Florida” via Environmental Research Letters, and the Zillow study which has a formal counterpart presently in peer review. There’s an indication that homes below 7 feet are already trading at a 7% discount with respect to homes which are above 7 feet.
Tamino You have a typo – last three words under The Bad