
When Ted Cruz turned a senate hearing into his own climate denier circus, he didn’t just emphasize lower-troposphere temperature data — he deliberately ignored every other bit of climate data that exists. Way to go, Ted.
It was mentioned that the satellite data was calibrated to radiosonde data, i.e. temperatures in the upper atmosphere measured by balloon-borne thermometers. Apparently Ted Cruz took this to mean that balloon data show global warming isn’t happening, which is wrong. Just plain wrong. He also claimed that the troposphere tempereture data (as opposed to the surface, where we live) “are the best evidence we have of whether warming is occurring,” which is wrong. Just plain wrong. That’s Ted Cruz for you.
If the satellite data were calibrated by balloon data, and the satellite data (from RSS at least) have been flat lately, how can the balloon data not be? Ted Cruz will never understand.
Saellite data from RSS is indeed calibrated using balloon data. In fact it uses many different data sets: HadAT2 (from the Hadley Centre/Climate Research Unit), RAOBCORE and RICH (from the University of Vienna), and IUK (University of New South Wales). But from all I’ve found, none of these data sets covers enough time span to support Ted Cruz’s claim of the lack of warming: HadAT2 don’t go beyond 2012, RAOBCORE and RICH end in 2011, and IUK doesn’t go past 2010.
That’s why I’ve used RATPAC data; they’ve been kept up to date. The latest data I’ve retrieved is quarterly (rather than monthly) and extends to July of 2015.
So how does the RSS data compare to balloon data, really?
Let’s take a look. Here’s the RSS satellite data (in blue) compared to the balloon-borne thermometer data from RATPAC (in red) (I’ve averaged the RSS data over 3-month periods to match the time sampling of RATPAC, and offset the RSS data by 0.2 deg.C to bring them into alignment during the calibration period).

They’re in excellent agreement until recently. Lately there’s a strong divergence, one which seems to be growing, after about 2012. It’s hard to believe that the problem is with balloon data; yes there are important calibration issues with them, but thermometers are still thermometers, and there are just as many serious issues if not more with the satellites’ microwave sounding units, including merging over a dozen different instruments, disentangling the signal from different levels of the atmosphere, and changing orbital drift and timing — issues about which different teams do not agree.
A close-up on their period of overlap shows the recent divergence even more clearly:

The RSS data simply fail to show the recent warming which is plain to see in the balloon data — the data from actual thermometers.
It’s also interesting to look at the difference between the two (with no offset). This suggests that divergence starts even earlier, but only became pronounced in the last several years:
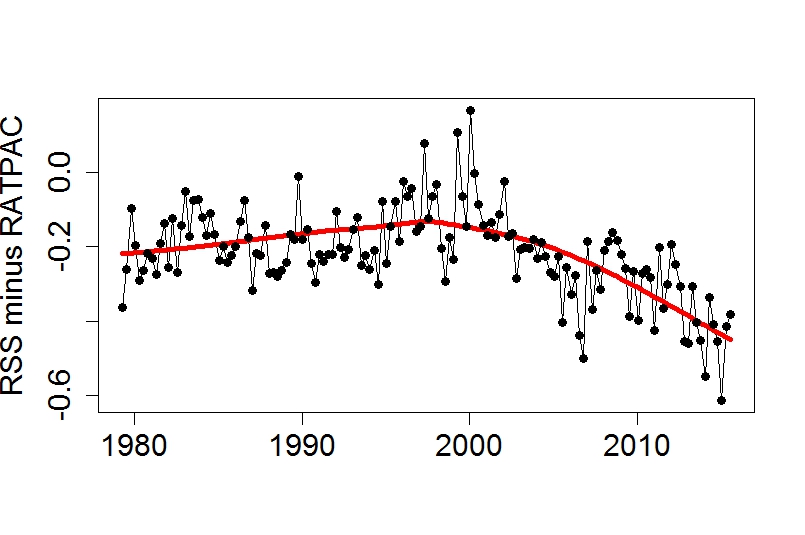
Overall, the satellite data have a distinct downward trend which is contradicted by the data from actual thermometers.
When Ted Cruz said that both satellites and balloon data fail to show warming, he was just plain wrong. When he said these data sets were the best evidence of whether warming is occurring, he was just plain wrong. Together, those two claims make up point number 4 of the 7 things he called “facts” — but he was wrong about their being facts. They’re just claims, claims which are just plain wrong.
Ted Cruz also didn’t seem able to keep straight how many of his so-called “facts” he listed. There were 7, but he repeatedly referred to 8. I guess when it comes to counting anywhere near as high as 10, Ted Cruz is again likely to be just plain wrong.


The spatial pattern of the difference may indicate whether it is because of the radiosonde dataset or the satellite retrievals. Problems with radiosondes would likely show small-scale variability in the difference maps if there are enough maybe even the borders of countries. Problems with the satellites would likely show more smooth difference maps or orbital patterns.
At some point, speaking for myself, I just need to look at the U.S. government apparatus as some kind of dynamical social system which, as the stock market gets to be some times, is just disconnected with reality. In particular, it has an inflated estimate of the variance on its input data, and is stuck in the state where it is. So, the process that corresponds to the U.S. government is on trial, and it is not clear at all it is capable of solving this problem.
Hopefully, the trial is not a courtroom jury trial, because, as many (statistician) colleagues of mine have studied, reported, and commented, THAT is not a rational decision-making process either.
But, y’know, at some point, it is insanity to sacrifice oneself to care more about a group of folks than they care about themselves. If they don’t pay attention to reality, or handicap themselves by failing to understand what matters about reality, including math and science, realistically, there’s only so much you can do.
The “long tail of CO2” as Professor David Archer (University of Chicago) talks about, is not something which appears to be popular among any audience, including subsets of climate scientists. And that is KEY for climate policy.
So Ted Cruz is a symptom — something like an acne pimple — of a bigger matter, and that is, wishful thinking by a community, the U.S. population, who came to prominence on the back of fossil fuel extraction and burning, and does not want to (a) lose it, and (b) accept the moral responsibility it has for creating (on the cumulative emissions basis) climate disruption as we have it.
Why should anyone expect him to behave any way other than he does? Look at his Presidential aspirations competitors.
I don’t in any way applaud his arguments, and his disregard of Rear Admiral Titley was astounding, meaning that he implicitly thought David Titley was hoodwinked by “climate change alarmists”. But Cruz doesn’t care about reality. He just cares about being elected, whatever LIES he needs to tell.
The Christy-Spencer-Curry carnival is out there, and is what the people who simply don’t want to buy the evidence and who have quasi-scientific sympathies run to. They, and random economists, who did studies in the efficient markets meme, said that you can’t detect interventions until you observe N years of data, applied to climate series, conclude there’s no observational evidence for climate disruption. But the conclusion is NOT based on observational evidence only. (See http://goo.gl/SI8D5a.) Indeed, there’s a very strong PRIOR, based upon what we know about Physics, Law of Conservation of Energy, Blackbody Radiation, radiative physics of atmosphere, the carbon cycle, and fingerprints based upon isotopic indicators from origins of Carbon and Oxygen.
Sure, Cruz needs to be covered and countered. But to the degree the public listens to him indicates their ignorance of Science. How much do we enable them to continue to have a good life even if they are ignorant?
I dunno. But there’s a lot of Twelve Step guidance which might be appropriate here.
I would take it that the failure to keep the other datasets up to date is a tacit admission that RATPAC is probably the best approach to homogenizing the balloon data. Another oops for Team B (or is that D?)!
Thanks. What laypeople like me need is something along the lines of “temperature records for dummies”. I’m so sick of doing my best to point away from this nonsense without knowing as much as you guys all do. If there is such a thing, please point me at it.
So there’s that. But then, there’s also …
The undoubted fact that temperatures are up. No amount of phony data can point away from the information an ordinary person like me has collected following weather globally for about ten years. I don’t keep a record, but it is undeniable; you don’t need to be a scientist to notice. I’m an amateur, but how obvious does obvious have to get before people stop finding so-called “science” that isn’t science and deluding their fans. Are they all in hermetically sealed rooms?
(speaking of which, one of my pet peeves. They’ve got a hold of “falsifiable” and make a nonsense of that too. It sounds clever, but doesn’t mean what they want their fans to think it means.)
On the RATPAC web site, it says; “The temporal homogeneity of many radiosonde time series is questionable due to historical changes in instruments and measurement practices. This may make them unsuitable for the study of long-term climate variations, such as through trend analysis.”
[Response: That’s exactly why RATPAC was created. The very next sentence on the website is “The goal of researchers was to create time series from radiosonde temperatures that are less influenced by the inhomogeneities.”]
So there is always uncertainty, no matter which method is used.
Nobody is denying that temperatures are variable. But none of the instruments used can answer the question about what is causing temperature swings over longer periods.
[Response: You sound like yet another practitioner of the “We don’t know everything so we don’t know anything” school.]
Exactly there is always uncertainty. Also the trends of observations have flaws and not all flaws may be known yet.
That is why it is so stupid of the mitigation sceptical movement to make the minor deviation that they call the “hiatus”, a large part of their political campaign. That is why it is so stupid when Roger A. Pielke Sr. immediately blames climate models when satellite retrievals fail to see a tropic hotspot. That is why it is so important to look at all the evidence and not just at one or a few datasets.
A short reminder that uncertainty is not the friend of mitigation sceptics.
Regarding the and UAH RSS divergence from recent surface temperature trends, did anyone catch this exchange on Roy Spencer’s blog? Unless I am missing something, Spencer seems willing to explain the divergence away though unintentionally admitting that UAH and RSS aren’t good proxies for sea surface temperatures! This, however, seems to leave unresolved the UAH/RSS divergence from RATPAC.
ehak: “…Highly correlated. But the TLT does not keep up with tpw increase during the latest years. There is also a lag where water vapor increases and decreases before TLT. So the big difference to the end (October this year that is) is a bit misleading. But it should give a clear indication of where TLT is (or should..) be heading. Anyhow. This is another indication that there is something wrong with RSS TLT and UAH TMLT. But the difference was clearly smaller in UAH TLT v5.6.”
Roy Spencer: “I have posted on the RSS total precipitable water (TPW) vapor trend before, and have discussed ad nauseum how
(1) it is indeed definitely tied to SSTs,
(2) but is increasing much faster than expected from constant RH, suggesting a problem with the TPW retrieval assumption of a constant specific humidity profile shape in the context of a warming trend, and
(3) how free tropospheric temperature doesn’t have to warm as fast as the surface temperature…it all depends upon changes in precipitation microphysics, which are not well understood.
The bottom line is that boundary layer vapor is not a proxy for tropospheric temperature…but it is a pretty good proxy for SST.
So please learn something about the issue, “ehak”, and stop making it sound like boundary layer vapor (which is basically what TPW is) somehow tells us what free-tropospheric temperature should be doing.”
ehak: “Guess what Roy just concluded. That TLT/TMLT is not a good proxy for surface temperature. That also means you cannot use the TLT/TMLT to judge the reliability of surface temperature indices.”
Holey buckets! I just googled that quote to find it on Dr. Roy’s blog, aaaand …
DR. ROY HAS SCRUBBED THE PAGE!!!!!
Here’s the Google link as of today, Sunday, December 13:
https://www.google.com/webhp?sourceid=chrome-instant&ion=1&espv=2&ie=UTF-8#q=site%3Awww.drroyspencer.com+%22The+bottom+line+is+that+boundary+layer+vapor+is+not+a+proxy+for+tropospheric+temperature%22
Google’s cache shows the page, with the quote, dated Dec. 3, and titled “2015 will be the warmest year in the satellite record”. But google’s link takes you to a scrubbed page on Dr. Roy’s site, just 10 days after it was posted.
Okay, I take it back. You can still reach that posting and comments from Dr. Roy’s main page (and I’m very sorry, Dr. Roy, for falsely impuging you!)
How can you count accurately above five up to ten when you only look at your fingers on the right?
Typo alert – “Saellite data from RSS” <= missing a "t"
And Cruz, supposedly one of the smartest Republican contenders, cannot even count to FIVE. Remember Rick Perry's "oops" from 2011 on the 3 agencies he would close if he became president ?
Last month, almost 4 yrs to the day, Cruz tried to list the 5 agencies he wants gone but counted the Dep't of Commerce TWICE.
http://time.com/4107728/ted-cruz-commerce-department/
IUK, RICH and RAOBCORE all go through at least 2014.
http://web.science.unsw.edu.au/~stevensherwood/radproj/index.html
http://www.univie.ac.at/theoret-met/research/raobcore/ – including 32 member ensembles of two flavors of RICH.
Also, RSS data is not calibrated using radiosondes. No radiosonde data is used in the dataset creation algorithm. Never has been. That was the criticism of UAH that led to RSS doing a remake so my irony-meter now needs replacing. It is post facto validated in a study that led to that page you linked to.
calibration /= validation, of course
[Response: Indeed I should have said “validation” rather than “calibration.”
However, the links you give don’t seem to support your claim of “through 2014.” UNSW page says “now containing data through Feb. 2013,” U.Vienna page says “It covers the period 1958-2011.”]
Data through 2014 were used in State of the Climate for RAOBCORE/RICH. IUK is new but should be updated annually.
Gosh, Tamino, that’s a pretty harsh review of someone who’s “very much into the Data”.
”
Senator Cruz seems very much into the Data, and generally knowledgable about the scientific process. One of his staffers is an avid reader of CE, WUWT and apparently Steve Goddard’s blog.
”
From which we can also read:
”
Actually, in the propaganda wars, Marc Morano’s new movie Climate Hustle does a good job of debunking warmest propaganda (I’ve seen the movie, stay tuned for a blog post on this within the next week).
”
Warmest propaganda.
It’s just that much warmer than all the other propaganda.
It is quite obvious that satellite data start to diverge from radiosonde data at about year 2000, also in RSS validation tool. Subsampling of satellite data doesn’t take away the divergence..
http://images.remss.com/msu/msu_amsu_radiosonde_validation.html
I digitized the subsampled HadAT and RSS curves and took the difference:
https://drive.google.com/open?id=0B_dL1shkWewaM1E1Z28zRzZBYXc
The result is very similar to the comparisons made by Paul S,

UAHv6-Ratpac A and subsampled UAHv6 – RatpacB station average:
The trends of RSS 3.3 and UAH v6 are not reliable after year 2000. However, those two indices doesn’t have monopoly on the free troposphere. There are alternatives that are quite similar to the surface trends:
https://drive.google.com/open?id=0B_dL1shkWewaYUdhcjdFOFJ3ZTA
More and more it looks like an AMSU effect, and perhaps one due to aging.
So why didn’t the Senators/their witness have these graphs of other datasets ready to go into testimony at the Cruz hearing?
Tamino (or anybody else for that matter),
Could you check the residual time series between…
RSS v3.3 -RSS v3.1
RSS v3.3 -RSS v3.2
RSS v3.2 -RSS v3.1
ftp://ftp.remss.com/msu/monthly_time_series/
Because, quite frankly, I need someone else to check my work.
There appears to be a ‘significant’ negative trend change starting right at January 1999 for v3.2 and v3.3 versus v3.1. Before that point in time (e. g. ending in December 1998) all three versions are virtually identical.
v3.1 ends in September 2008 (117 months in common from 1/1999 thru 9/2008 for all three versions), trend change is ~0.9C/century lower.
v3.2 ends in December 2010 (144 months in common from 1/1999 thru 12/2010 for v3.2 and v3.3), trend change is ~0.9C/century lower.
Maybe this is well known, I don’t know, or maybe I’ve made a very basic mistake. Baseline anomaly period is 1979-1998 (20 years) for all three versions.
Oops, my previous post has …
“v3.2 ends in December 2010 (144 months in common from 1/1999 thru 12/2010 for v3.2 and v3.3), trend change is ~0.9C/century lower.”
should be …
“v3.2 ends in December 2010 (144 months in common from 1/1999 thru 12/2010 for v3.2 and v3.3), trend change is ~0.6C/century lower versus v3.1.”
Sorry about that.
Sorry again, the above is wrt TLT global (1st column anomaly time series).
What tamino says, what Eli says, what Olof says, what tamino and Olof show with RATPAC vs. RSS/UAH since 2000.
When are Woy and Christy gonna admit they are flogging a dead equine? Answer: probably never, because ideology.
What’s the relative height of balloons, lower troposphere, and the level where the satellites are actually measuring? (middle troposphere?)
What level does RSS purport ot measure?
If you put UAH into the graph too, TLT and also middle troposphere, where would those points lie, relative to balloon and RSS?
(Is your graph comparing balloon temps to TLT? If so, what happens if you look at diffs between balloon temps and (UAH?) middle-troposphere temps over time? (To see if the problem lies with TLT only)
Also, I second Susan Anderson’s request. It would be nice if us general populace could explain, with some legitimate confidence, to the Ted Cruzes of the world why their understanding of this is wrong.
I apologize for any and all stupidity above. (It’s late in the day for the elevator to run all the way to the top.)
S & C will have to be dragged kicking and screaming to accept any result other than the one they’ve invested so much in.
OTOH, RSS doesn’t have the same ideological investment. Dr Mears at RSS will eventually get to the bottom of the problem or at least lend a willing hand in helping to resolve it.
Dana Nuccitelli hinted that a paper is in the works in response to a question from Victor Venema over at ATTP’s.
Cruz has taken more than $1 million from the fossil fuel industry in campaign contributions.
His intelligence was assessed by Dershowitz, one of his Harvard Law professors as “off the charts brilliant”. He represented Harvard Law School at the 1995 World Debating Championship.
He isn’t some clown who can’t count past five.
He has accused the Obama administration of being the world’s leading sponsor of state terrorism.
As for his position on climate science it seems impossible to conclude anything other than he knows he is lying.
Just because a person can be impressive in one intellectual area doesn’t mean it translates to all. There are too many stories of brilliant mathematicians that failed to figure out how do common daily tasks, like keep track of their money.
Nor is brilliance necessarily a defence against delusion–though I hasten to add that that’s not intended as a statement about which of the two describes Mr. Cruz.
Trump, Carson, Cruz. The GOP is full of great minds.
Until they open their mouths.
According to Mears & Wentz. 2009, http://journals.ametsoc.org/doi/full/10.1175/2008JTECHA1176.1 (page 1045) RSS also uses a climate model for corrections:
“A second important correction accounts for drifts in local measurement time, which can alias any diurnal cycle into the long-term time series if it is not corrected. Using 5 yr of hourly output from the NCAR Community Climate Model (CCM3) climate model (Kiehl et al. 1996), we created a diurnal climatology for MSU channels 2–4 and AMSU channels 5, 7, and 9 as a function of earth location, time of day, time of year, and incidence angle using the methods described in Mears et al. (2002). This diurnal climatology was then used to adjust each measurement so that it corresponds to local noon.”
So people how normally think climate models are totally wrong, love the RSS results that are partly corrected using… a climate model.
I hope they studied this well, the diurnal cycle of temperature is generally underestimated in climate models relative to observations.
Models have large grid boxes and time steps, whereas observations are local and typically integrate over only 10 minutes. Thus models will show less variability and thus less extreme values (Tmin will be higher on average, Tmax will be smaller on average) and the diurnal temperature range (Tmax-Tmin) will thus be underestimated. Not sure how important this reason is, from the perspective of the satellite retrieval this could just be noise.
However, also the distribution and diurnal cycle of precipitation is not particularly well reproduced and would likely affect the diurnal cycle of temperature. This could more easily be a source of bias.
Given how large the adjustments of satellite temperatures are, they need to be very accurate.
As I understand it, Victor, they calibrate the time, not to the temperatures. Of course the question remains whether the models get the *timing* right.
Tamino, I asked Gavin Schmidt to please add RATPAC to his mo-betta version of Christy’s fraudulent graph of models versus atmospheric observations, and suggested he ask you for the data and advice. https://twitter.com/ClimateOfGavin/status/675453487451246593
Is there any assumption that needs to be rechecked about these tools, that might be taken for granted?
Here’s why I ask — friends who are farmers, who have stored their nut harvest the same way for decades, using the same coolers other farmers in the same area have used for centuries — were blindsided by climate change this season.
The farmers have deep earth sheltered cold storage — left to cool all winter then closed up — that should stay about 35 degrees American through to the fall when they’re opened up to hold the season’s harvest.
This year, the ground storage was several degrees too warm — so they lost part of their crop stored there to mold. So did other farmers who’ve used this storage, there, this year.
Details here for anyone who wants them:
http://badgersettresearch.blogspot.com/2015/12/the-global-warming-grinch.html
Is there any reference in any of the temperature validation/calibration to any presumed longterm stable factor that could be slipping like this, to explain what’s going on with the measurements?
Heat transfer into soil is quite well described by Fourier’s Law. Just as it takes time for the internal temperature of your Christmas bird to rise in response to a hot oven, it takes time for surface warming to penetrate into soil, and (inversely) for surface cooling to remove the warmth.
If you approximate surface temperature variation by a sine wave, the conduction/diffusion process leads to two key features:
1) the time of peak temperature is delayed at depth.
2) the amplitude of the cycle is reduced at depth.
The important thermal property is the “thermal diffusivity”. The sine wave approximation works for daily cycles, which largely disappear after a few 10s of cm and can be delayed by hours, or for the annual cycle, which rarely penetrates more than about 10m, and can be delayed by months.
Google will throw up some references:
https://www.google.ca/?gws_rd=ssl#q=soil+heat+transfer+equation+sinusoidal
For a cave, some tens of meters deep, you won’t see the annual cycle. You will see a delayed response to longer surface changes, though, so bore hole temperatures are an interesting research area for looking at long term surface temperature trends. (Variations in thermal properties with depth, and cases of freezing and thawing make this moderately complex, though.)
So, yes caves are remarkably stable, and approximate mean annual surface temperature year-round, but they are not immune to long-term trends.
I’ve wondered about this before. When I was in college I worked summers as a cave guide in a tourist trap cave. I had to learn to give a basic tour. One of the things we told people was that, and this is a memory from long ago, the temperature of the big room at the bottom of the care was 56 degrees F year round, which the cave owner claimed was the average annual temperature of the area outside the cave. Whether or not that was actually true I have no idea. So does anybody know? Are caves getting warmer.
The word charlatan has never fit anyone better that Ted Cruz. Use it in association with him liberally.
https://www.washingtonpost.com/news/wonk/wp/2015/12/14/a-guide-to-what-ted-cruz-really-believes/
—————
“There is no meaningful risk of Christians committing acts of terror,” Cruz said last month.
—————-
His definition of “acts of terror” seems limited to anything that scares Republicans.
https://www.washingtonpost.com/news/wonk/wp/2015/12/11/what-social-science-tells-us-about-racism-in-the-republican-party/
—————
“As of 2012, 89 percent Republicans were non-Hispanic whites …”
Perhaps he’s never heard of Lebanon, or Northern Ireland. Or Oklahoma City.
One need not go so far afield. North Carolina has produced it’s share of Xtian terrorists.
Indeed. And me a resident of the greater ATL…
Oh, you meant the PP assailant, of course. I was thinking of Eric Rudolph, another anti-abortion terrorist–the one who bombed the ’96 Olympics.
JCH, that may have been a coincidence, each cave is different to the extent air circulation and humidity vary. Some caves ‘breathe’ more than others. There’s a whole lot out there even if you don’t limit search to Scholar:
https://www.google.com/search?q=cave+temperature+trend
(although typically enough if you make it an image search with ordinary Google, you get a whole lot of WTFUWT in the results).
Oh, one from Scholar:
http://link.springer.com/article/10.1007/s00382-014-2226-1
Climate Dynamics
August 2015, Volume 45, Issue 3, pp 569-581
Is global warming affecting cave temperatures? Experimental and model data from a paradigmatic case study
The rising temperatures aren’t listening to Ted Cruz because November, like October, just shattered a record as the warmest November in the NASA dataset:
http://data.giss.nasa.gov/gistemp/tabledata_v3/GLB.Ts+dSST.txt
Re AMSU and microwave sounders the RSS site says:
“In the future, the AMSU instruments will be phased out, and replaced with the Advanced Technology Microwave Sounder (ATMS). The first ATMS was launched on October 28, 2011. Measurements made by the ATMS are not yet used in our data set. We are working to cross-calibrate ATMS with AMSU so that ATMS measurements can be included in the future.”
Can anyone comment?
Well, cross-calibration with new instruments seems to be difficult. The merging of MSU and AMSU has not been succesful, since the trends in the AMSU-period can’t be verified/validated by weatherballoon data. The satellite data series have lost about 0.2-0.3 C during this period on other free troposphere temperature indices, and surface indices..
A simple advise to avoid getting “lost in cross-calibration” is to calibrate/cross check with balloon data–
I am sure that several of the 400 members of the RSS Monte Carlo uncertainty ensemble (which with 95 % confidence produce trends between 0.06 and 0.20 C/decade for 1979-2012) conform with e.g Ratpac data, and give directions for the right choice of adjustments.
Here is the 90% confidence interval: ftp://ftp.remss.com/msu/data/uncertainty/percentile_realizations/tlt/tlt_realization_trend_list.txt
I *can*, but presume you want something actually knowledgeable, and so will refrain…