
Note: See the update at the end of the post for a test involving 1000 (rather than 100) Monte Carlo simulations.
If a temperature event like we witnessed in the last century — a warming of around 0.9 deg.C in about 100 years — had happened at some other time in the last 11,300 years, would it have left some trace in the recent paleoclimate reconstruction of Marcott et al.?
Some believe that it wouldn’t because their estimate is based on an average of 1000 “perturbed” results. The perturbations include “smearing” the age estimates (introducing random changes to see how that affects the result), simply because the ages are, after all, uncertain. For each proxy, each age was offset by a random amount based on its estimated uncertainty. Then these perturbed ages were used to compute past temperature, forming a single “realization” of the perturbation process. A thousand perturbations were then averaged to create the final estimate by Marcott et al.
The belief of many is that this process of “smearing” ages would so smooth out any spike which may have occurred in the past, that it wouldn’t show in the Marcott reconstruction. This means, so they say, that warmings like we saw in the 20th century could have happened multiple times in the past, and the Marcott work doesn’t provide any evidence against that.
Let’s find out, shall we?
I created an artificial temperature signal consisting of a temperature spike like that of the 20th century, followed by a return to “normal.” The spike is a rise of 0.9 deg.C over a span of 100 years, followed by a return to zero over the next 100 years. I put in not just one, but three spikes, since the age uncertainties are different at different times so I wanted to know how spikes might be smoothed out at different times in the past. The spikes were centered at 7000 BC, 3000 BC, and 1000 AD.
I then took the proxy data sets used in Marcott et al. and added to them this artificial temperature signal. That enabled me to compute a temperature reconstruction (using the “difference method”) based on the Marcott proxies plus the artificial signal. Here it is:

Note that the spikes in the reconstruction are smaller than they are in real life, even though the ages have not been perturbed. That’s because some of the proxies are totally unaffected by the artificial signal, because they don’t include any observation times which occur during any of the spikes.
Nonetheless the spikes are abundantly clear. But what if we perturb their ages so different proxies record them at different times? For each proxy, I perturbed the ages with Gaussian random noise which had the same standard deviation as the “age model uncertainty” given in the Marcott data. Then I computed the reconstruction using the perturbed ages. One such realization looks like this:

We can compare it to the reconstruction using the unperturbed ages:

Clearly the spikes are reduced in size by the smearing of age estimates. But they’re still there. All three of them.
OK — but Marcott et al. didn’t just create a single perturbed record. They made a thousand, and averaged their final results. I didn’t do a thousand because that would have taken a lot of computer time, but I did do a hundred and averaged them. This is the result:

The spikes are still there. Plain as day. All three of ’em. We can compare this to the reconstruction using unperturbed ages:
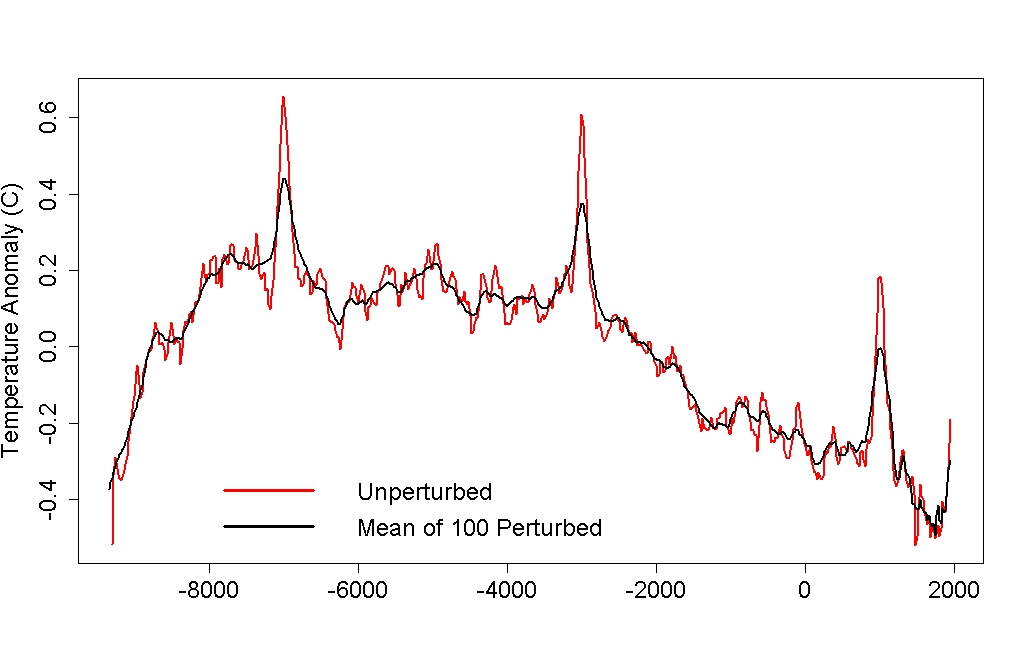
The spikes are a lot smaller than with no age perturbations, which themselves are smaller than the physical signal. But they’re still there. Plain as day. All three of ’em.
My opinion: the Marcott et al. reconstruction is powerful evidence that the warming we’ve witnessed in the last 100 years is unlike anything that happened in the previous 11,300 years.
The idea so terrifies those in denial of global warming, that they have undertaken a concerted effort to “smear” this research. That’s because it clearly implies that modern global warming is unprecedented, and shines a light on the folly of throwing a monkey wrench into the climate machine. And that means we ought to change our ways, which just happen to involve some of the biggest money-making ventures in the history of humankind.
The idea also terrifies me. For a different reason.
UPDATE
I went ahead and repeated the experiment using 1000 (rather than 100) perturbed records. It doesn’t change the conclusion:


Powerful stuff. Thank you Tamino for your analysis. Could you also comment, what extent and method of “smearing” would one need to make those peaks dissapear? What would the consequence be for the rest of the signal?
but this is not the relevant analysis- he has shown that the *data reduction process* in and of itself does not elimnate high frequency spikes. however, the “proxy formation process* is the relevant aspect.
You’ve got it JPS. The resolution problem lies in the proxies themselves, not how they were analyzed. Marcott et.al. published this fact themselves. The proxy forming process would be similar to anyalzing the date from ice cores by slicing them into very narrow slices and chopping them up. Then reassemble a “slice” for each interval by randomly mixing in pieces from slices 80 or so slices on either side.
Test proxies would have to be constructed in a similar fashion, but with even broader intermixing to represent the unkown process that go into forming the various types of proxies.
I just heard water dripping. if I’m not mistaken, it was the sound of McIntyre and Watts wetting themselves in unison.
Awesome, awesome work, sir!
Thanks, very much needed. I am reflecting on how to better control my urge to do my “fools rush in” thing to the detriment of the argument.
But returning to the science is extremely useful!
Money is a ponzi scheme. It will fix itself. Soon.
As in Willie Soon? (Sorry, couldn’t help myself.)
I confess I don’t follow most of your math, but this is fantastic. Very simple and powerful.
Jeffrey,
It’s probably more “simply explained” than “simple”, but it is certainly powerful.
And it is a powerful example of the stark difference between Tamino and the likes of Watts and McIntyre, who repeatedly make claims against the science of human-caused global warming, but who can never produce any real, actual, defensible analysis that supports their protestations. All that is left to them is to dog-whistle in the collective lay denialist mind the impression that somehow the real science has been rebutted.
Which reminds me – wasn’t Watts about to publish a game-changing paper? How’s that going, I wonder?
I was wondering if a spike, if one occurred, would show up if one used their analytical methods. Thank you for answering that.
I think your method doesn’t quite simulate Marcott’s research
1. The actual temperature history of the planet, which we don’t know directly
2. A set of proxies for that temperature history, all of which involve some error from various sources
3. Marcott’s randomization procedure, which is meant to counteract the effect of the errors in the proxies.
You’re simulating 1&3, but not 2, if I understand you correctly. You need to take your imagined temperature history and add errors to each your imagined proxies first, before doing the 100 randomizations.
[Response: Golly, that’s sure to make the spikes complete disappear without a trace. Especially since random noise is just as likely to make them look hotter as cooler.]
That’s the great thing about imagining. It doesn’t have to be constrained by physics, geology, geochemistry, biology, All those pesky “science” things.
It’s incredibly good to have all the tests Tamino does!
What is the precise form of the spike?
[Response: Linear increase of 0.9 deg.C over 100yr, followed by linear decrease]
I was wondering the same. I like it!
Hmm, I was afraid of that. The surface area under that curve is quite a bit more than under the real 20th C temp anomaly curve (+ mirror image). If you used that, the spikes would come out lower. Right?
[Response: Yes, but I really don’t think the difference is nearly as big as you suggest.]
It is great to see that you are pushing Marcott et al to the breaking point.
In fact it would be interesting to see the break point that a spike drops off (disappear) like 50 years 30 years, or 20. A large period of volcanisms of 20 years of -.5 or -1C and return to 0 would not be out of the question, but extremely unlikely.
Again a fanatic peace of work, you have done on Marcott et al. envious of you skill set.
What would Marcott’s study have looked like with 100 randomizations?
I ask because I wonder if there’s a threshold at which damping occurs.
I’m a bit concerned about the order of magnitude difference between 100 and 1000 iterations. With uncertainties and regional variations across the many proxies? That would, IMO, considerably reduce such a spike signal. The 100 iteration tests are a strong indication, but perhaps not proof.
However, looking at the Marcott Supplemental figure S3, illustrating a full 1K runs using their Standard methodology, it appears that none of the perturbed runs shows anything like a 0.9 C spike signal to be averaged out. And given the nature of Monte Carlo tests, at least a few of the perturbed iterations should show such a signal (if it existed) at or above full strength. They don’t.
Add that to data from high time resolution proxies (ice cores sampling at ~100 yrs, diatoms at ~10yrs, speleotherms with near-annual data), and I would opine that any claims of such spikes (or gremlins) are just unsupportable – there is significant evidence here that such spikes simply don’t occur in nature, at least not over the last 11ky. And making this paper yet one more consilient support for the fact that recent warming is due to our actions.
It’s not surprising that many ‘skeptics’ feel threatened by the Marcott paper – it undermines any number of their “it’s not us” claims.
Nice ambiguous title for the blog post!
If your computer has time, it would be great to see what effect running 1000 iterations would make. My guess is, not much.
David Appell has made the point elsewhere that, even if there were undetected big global spikes in the Holocene proxy temperature record, this would mean that we could not rule out another of these spikes occurring in the near future. If these spikes from some unknown physical cause (we can rule out CO2 from the ice core records) were to be superimposed on actual anthropogenic global warming, this could make a bad situation even worse and increase the urgency for action on emissions. This is probably not the implication the fake skeptics are arguing for.
Good to see you and your friend Gauss (aka Smeargol) have finally acknowledged just how BIG the Medieval warm period was (~1C).
What’s the sampling resolution of your series? Marcott’s proxies “have sampling resolutions ranging from 20 to 500 years, with a median resolution of 120 years”.
[Response: The sampling times are identical to those used by Marcott.]
I think DirkKS’s point 2 deserves a better reply. Its the point I was going to raise: proxies don’t, typically, capture all the variation in the temperature record. So representing a spike of 0.9 oC in the temperature record by 0.9 oC in the proxy is probably unrealistic; you’d get perhaps half that? Though if you half your final peaks again you still get something visible, I think.
[Response: I think you’re mistaken. Proxies can capture the *signal* even when amplifying or suppressing noise. And the data I used already have noise. I’d say “half” is a huge overestimate of the possible signal loss in proxies — if that were true then the proxies aren’t properly calibrated.]
From the title, I had expected this to be a post about mudslinging. But this is more interesting.
While your results are encouraging, I’m not fully convinced for a number of reasons.
1) the uncertainly in the Marcott’s chronology may have been underestimated (most age-depth models underestimate uncertainty, but I’ve not had the opportunity to test Marcott’s procedure). If they have underestimated uncertainty, it would have minimal impact on their results, but would make your spikes less smeared than they should be.
2) Some of the proxies are noisy and perhaps not very sensitive, probably OK for Holocene scale, but your analysis will be too optimistic. Fortunately, Marcott et al didn’t include my least favourite proxy.
3) Marcott’s result doesn’t have a strong 8.2ka signal. Although perhaps this event was too local, too short, or too low magnitude.
4) You’ve added a global signal, but most of the 20th Century warming, and probably past events, occurs at high latitudes. So you are more dependent on a few records being reliable. This might not bias the results, but would add variance.
[Response: It might be interesting to add a signal with latitude-dependent warming. But it will have to show a global *average* of 0.9K over 100yr to match what has been observed, and that will require much greater warming at high latitudes. My intuition is that it might add variance, but then again it might actually reduce it.
Also note that the Marcott proxy selection has a disproportionate representation of the northern extratropics and especially the near-Atlantic northern extratropics (disproportionate in terms of area of the globe) — exactly the region which shows strongest warming (both in their reconstruction and in the last century). So I suspect my procedure, which adds the same spike everywhere, actually *did* introduce a bias, namely, that it *under*estimates how strongly the signal would be detected using the same proxy locations and sampling times as Marcott.]
If you are mainly interested in seeing what happens to the artificial peaks relative to their immediate surrounding, can’t you get a pretty good idea by just doing the processing on 3 small subsets of the data, centered on the peaks in question?
In fact, seems like you could probably get a pretty good idea by just doing it on the data in the general vicinity of just one of the artificial peaks.
[Response: I didn’t think of that.]
I was hoping you would do something similar to this. The width of those introduced periods would require cooling to be about as fast as warming. Is that really possible? Of course it would just make them more obvious in the reconstruction.
I’ll give it a week before calling /crickets on the denier circuit.
[Response: I agree that such rapid cooling after such rapid warming is physically implausible. But of course, more persistent warming would be detected even *more* strongly.]
But but but … what about if you had a lot of interleaved upwards spikes and downward spikes, 1 degrees and one or two decades each. Would they be visible?
Or interleaved upwards and downwards 1-year spikes of 10 degrees each?
Or…
or 20° upwards/downward 1 day spikes ?
Omigod Tamino is a fraud and cornered !!!11!!
(just posting that so that I can say skeptics have “plagiarized” me …)
Tamino,
There is a flaw in your argument. You are ignoring proxy measurement error, and the data for each proxy show large natural statistical errors. To do this properly you should really randomise the temperature shift according to the proxy standard deviation.
I therefore suspect you may have simply shifted all recorded values upwards by 0.9 C and the down 100 years later. Instead you should really add in a random measurement error. I may be wrong but I doubt whether the spikes survive
Marcott’s result is a real step forward as it gives evidence of long term temperature trends. I don’t think it says anything about rapid trends.
(hoping you approve this one !)
[Response: I think there’s a flaw in your argument. The proxies already have noise, including during the synthetic spike episodes. Adding *more* noise to the spikes (different noise for each proxy) would increase the variance of the result but not its mean, and it seems to me would make the noise too big during the spikes, adding artificial noise on top of the already existing noise amounts to a “double dose” of noise during the spike episodes.
And frankly, even if “spike noise” were added it really would increase variance but not mean, and I suspect it would have very little if any noticeable effect on the final result. I’m confident the spikes will survive.
As I mentioned in an earlier comment, the synthetic spikes are not step functions, they’re linear increases followed by linear decreases.]
the real flaw in his argument is he is looking at the wrong thing- I think he has effectively shown the *data reduction process* will not in and of itself eleiminate high frequency spikes-. however, the *proxy formation process* is the key to why this occurs.
So you are casting doubt that the provide used can capture temperature changes?? That the proxies themselves cannot capture temperature variation over time? Based on what information do you assert that?
no, i am casting doubt that the proxies used can capture temperature changes on the scale of 0.1 C per decade, which is roughly what he has used in his artificial spikes. if the data itself could *never* show such a thing, the fact that the data *reduction* doesnt eliminate it doesnt mean much of anything that I can see
Actually, this might be an interesting statistical question;
I’d guess extra 0.1 spikes would be unnoticeable, while 0.9 spikes are clearly visible. How big is the minimal “noticeable” spike? 0.5?
0.3? (noticeable not being well-defined of course).
In any case, the statistical method seems to agree with physics, i.e., it’s hard for these to happen and not be noticed. It still takes 3-4 kinds ofmythical entities.
I’m confused didn’t they say the 20th century reconstruction isn’t robust? To me you could introduce any amount of data flips you like if you’re using something that isn’t robust to start with you are just going to finish up with a diminished argument not something that somehow strengthens your beliefs.
So what does lack of robustness in the 20th C. for this particular reconstruction have to do with examining the effect of temperature spikes 1,000+ years ago?
You should think about what you’re writing a little more. Read what Tamino has written in all of the articles about Marcott et al. Your comment makes it seem like you haven’t understood.
Tamino: for the curious, what sort of run time are we talking about for the 1,000-set compared to the 100 you did?
[Response: I didn’t time it, but the run of 100 might have taken around 20 minutes. I really don’t think there’s much to be learned from going to 1000, and nobody is paying me to do this.]
JaceF: the denialsphere has been going ’round and ’round on several issues, two of which are:
1. The 20th century reconstruction isn’t robust (they never claimed it was, and the instrumental temperature record is, so who cares?). That’s what you’re thinking about. This issue, however, is not the subject of the current thread that you are reading.
2. Another “issue” has been the claim that the reconstruction doesn’t have the temporal resolution in the PAST (where the reconstruction IS robust) to “catch” quick rising spikes like we see in the recent instrumental record.
Therefore, today’s rise might not be unusual. If it’s not unusual, some argue that some unknown natural forcing must exist that, if it caused a quick steep rise in the past, might be causing today’s quick rise.
THIS – not the non-robust proxy-derived modern uptick – is the subject matter of the current thread.
Ignoring for a moment that the argument is unphysical, others have pointed out that other proxies exist that rule out such a quick rise for much of the period of the reconstruction.
Tamino’s point is simple: the premise that the analysis wouldn’t catch a spike of the magnitude we’re seeing in the modern instrumental record is false. As usual, the denialsphere made the claim without bothering to test it analytically.
Understand?
“not something that somehow strengthens your beliefs”
Your use of the “belief” word makes me suspicious that this will fall on deaf ears, but I’ll be thrilled to be proven wrong.
Impressive stuff! But out of curiosity – shouldn’t your primary ‘start data’ look more like Mann 2008 (in the level of decadal variability) and from that one simulate the errors in both amplitude and especially timing?
JaceF, the issue isn’t about the small spike at the end of the reconstruction which indeed is not robust as Marcott et al state in their paper. The issue is about the claim that a warming of the rate and extent we’ve observed in the directly measured temperature record during the last around 100 years might also have occurred during the Holocene. That claim comes from another claim that the variable proxy resolution and smoothing in the Marcott methodology would render such spikes undetectable. The analysis in the top thread indicates that such spikes would survive (in somewhat broadened and attenuated form) in Marcott’s methodologies. There are several observational and physics-based reasons for rejecting the first claim, and Tamino’s analysis indicates that the second claim (about smoothing out rapid, high amplitude temperature excursions throughout the Holocene) are not robust…
When you say the following:
“…The idea so terrifies those in denial of global warming, that they have undertaken a concerted effort to “smear” this research. That’s because it clearly implies that modern global warming is unprecedented, and shines a light on the folly of throwing a monkey wrench into the climate machine.”
I have a few questions…
1. Is “this research” referring to Marcott et al, or all of climate science in general? I don’t think Marcott et al “clearly implies” modern global warming is unprecedented, unless you are referring to the rapidity of the recent rise (Mann et al and Marcott et al both indicate that the maximum warming the globe has experienced as divined by temperature still ‘could’ have been at other parts of the Hollocene).
[Response: Yes, “this research” refers to Marcott et al. Yes, I’m referring to the rapidity of the recent rise.]
2. “they have undertaken a concerted effort to “smear”…I have asked Michael Mann himself about this too, and it does appear that Climate scientists feel free and at liberty to conspiracy ideate (to use a flamer of a phrase) and to set aside “Occam’s Razor” and the “route of minimum nefariousness” only to their supportive colleagues, and completely decry the practice when others they don’t support do it. I’m still quite certain that there are folks some are ‘smearing’ into the ‘denialosphere’ that are actually not there, let alone not part of some concerted conspiratorial effort (though there may be different definitions of ‘denial’ out there, which would itself be a problem). Some anyway.
[Response: I consider the efforts to discredit Marcott et al. to be not just a smear campaign, but a concerted one. I doubt that the principal purveyors (Steve McIntyre and Anthony Watts) are motivated by fossil fuel money. I suspect it’s their ideololgy. Your implication of “conspiracy ideation” is mistaken.]
However, I do get that there are organizations astroturfed by oil money interests and all the rest…but there are a lot of bloggers out there that do what they do for nothing, and/or contrarian scientists that are not beholden. Like-minded-ness does not constitute a conspiracy.
All that being said, I do think that someone like a Steve McIntyre could have done a post like this, and also demonstrated how some sort of rapid rise/fall in the data that we’ve seen now could have been missed on a quite low percentage possibility. [Nevermind the fact that such a phenomenon would also require an explainable physical basis– as if it’s just ‘happened’ randomly in the past]. I know you have stated your reasons for why this doesn’t usually happen. But, I guess I enjoy reading a lot of different lenses/dimensions that view the same issues, even if each is viewing the other with suspicion and ill-intent.
[Response: My opinion: some people should be viewed with suspicion, because of their ill intent.
Be advised that “concern trolling” is not welcome here.]
Maybe ‘conspiracy’ is not the best word–that assumes a degree of secrecy. What Messrs. Watts, McIntyre et al are doing, though, is pretty overt for the most part. In some cases, there may be money involved, but in a great many cases, as Tamino says, there’s an ideological motivation instead.
Either way, the ‘effort’ is certainly ‘concerted.’ What Occam’s razor says to me is that the motivation is not pure love of truth–it’s desire for a palatable outcome, which appears to be one in which we can keep burning fossil fuels to our heart’s content (reality be damned.)
From wikipedia:
“A conspiracy theory purports to explain an important social, political, or economic event as being caused or covered up by a covert group or organization.”
That’s how I’ve always understood it. As Kevin says, covert or secret action, not simply concerted effort, is key. Some secret group that you can’t pin down.
We know, for the most part, who specifically are trying to destroy the careers of climate scientists through accusations of fraud (hey, is Steven “Piltdown Mann” Mosher available for another lesson in ethics?). It’s not a conspiracy ideation to note the cooperation between the likes of Watts, McIntyre, and the RP^2s. That’s reality.
Marcott et al analyzed their temporal resolution by using a white noise signal and found that there was “no variability preserved at periods shorter than 300 years” (5th paragraph). Adding spikes seems related but different, and you find you can resolve 200 year variability. How do you reconcile these two different tests and conclusions?
[Response: Specifically, they “calculated the ratio between the variances of the stack and the input white noise as a function of frequency to derive a gain function” and found that the gain function for frequencies less than 1/300 per year was quite small.
Quite small isn’t the same as zero. If I added a purely sinusoidal signal with frequency 1/300 per year it would be strongly attenuated by the Marcott procedure, but if its amplitude was 100 Kelvins you can probably understand that it would still be detectable. The fact is that compared to the rest of the variation in the Marcott reconstruction, a spike of 0.9 K is quite large.
More importantly, computing a gain function in frequency space isn’t the same as computing the duration of a spike at which attenuation can become dominant. In fact a 100-year linear rise followed by 100-year linear fall has significant signal power at frequencies both above and below 1/300 per year.]
[In fact a 100-year linear rise followed by 100-year linear fall has significant signal power at frequencies both above and below 1/300 per year.]
Thanks, this makes it clear. If I think of their processing as a low-pass filter, I would expect to see your spikes broadened to a width of 500 yrs or so. It is hard to tell from your graphs if this is what happens.
Well done.
Those concerned that only 100 runs were used should look carefully at the graphs presented to estimate the additional signal supression. Assume linearity.
David B,
You comment is vague, and liable to misinterpretation. Why should anyone assume linearity? Naive readers might deduce from your unsubstantiated claim that, if a 100 runs suppresses the spike by ‘a’ (where ‘a’ equals spike-height with no runs – spike-height with 100 runs), then 1000 runs would suppress the spike by ’10a’, which might be enough to make the spike almost disappear. If you want to make such a claim, and effectively paint Tamino as ‘hiding the full smear’, come out and say it. Don’t hide behind a vague comment.
Tamino,
This is why it might be worth spending 200 minutes of computer time (or whatever it takes) to forestall such objections.Just because it is obvious to you that it would not make much difference with extra runs will not be enough to satisfy everyone. BTW, nice work, I was hoping someone would perform this exercise.
Everyone else,
Can we please stop calling the 20thC rise a ‘spike’? Does anyone really expect a sharp decline on the other side? There is no plausible physical process for a brief ‘spike’ in temperature over the 20th to 21st C, but there is a whole body of science that explains why temps have gone up and will keep going up, followed by a long plateau. Imagining that the temp can suddenly go down again this century to make recent changes a weird unexplained ‘spike’ plays into the denialists’ faux objections to Marcott’s method, as well as into the denialist myth that a few hot years is no big deal, and we have time to wait before acting.
Cheers Leto.
Leto — Nobody knowledgeable considers the rise of the past 150 years a spike which will quickly go away.
Yes, I meant linear as in linear system analysis. That is considerably different than the naive interpretation. Upon reflection I am unsure that the linear system model is adequate here.
There are some negative spikes in tree ring data- 3100 bce, 2200 bce 1159 bce [this is the longest ‘winter’ of 20 years] a down turn in 540 ce for five years. These global winters lasted between 5 to 20 years and coincide with the end of several civilisations- Ramsis III reigned over a disintegrating ancient Egyptian empire with starvation and even a workers strike. Is 20 years of cooling too short to show up?
there you go – you only need 20 years for civilisation to fall a part. Egypt : the eternal empire- I bet they didn’t see it coming. Global cooling caused by dust loading- unlikely to be volcanic as spikes don’t show up in ice core and it is proposed dust and debris from comet Encke caused it as we orbited into its junk stream tail.
Tamino, I think that your analysis is exactly on-point. However, I also suspect that there is a flaw in your methodology here. The first thing that strikes me is that in their own FAQ they say “The smoothing presented in the online supplement results in variations shorter than 300 yrs not being interpretable.” Your result seems to contradict that statement correct?
[Response: I already explained here why the results are not contradictory to their computation of signal attenuation. They computed the attenuation in frequency space, which is not the same as the time scale of a spike which can be detected. In fact for the signal shape I’ve chosen most of the signal power is at frequencies below 1/300 per year.]
I think this discrepancy might be explained by you having used too simplistic of a conception for uncertainty of the proxies. You create a very strong signal by placing these spikes in ALL of the proxies manifested in the exact same way. The proxies are not actually ancient thermometers. We can’t expect that every proxy that we choose and calibrate as a temperature proxy(no matter how good we are at choosing and calibrating) will actually come up with the signal from that temperature event at that particular point in time. Nor is it evidently the case that a proxy impacted by such temperature events would register the event so precisely. Even if they are temperature sensitive, do the proxies all have the same rate of response to an event on a 10 year timescale, on a 100 year timescale? Is this kind of precision even expected of these proxies, and do our methods of analyzing the proxy deliver this kind of precision in extracting the signal? Because if not, then this spike would actually not appear in some of the proxies (perhaps many depending on the reliability of the proxies on sub-100 year timescales). Sometimes the spike might appear as spread out over a long period of time or vary in symmetry from one proxy to the next. You retaining the ‘noise’ of the original data does not mitigate against you introducing a perfectly persistent spike signal into all of the proxies that is not subject to all the physical and circumstantial limitations of using proxies to obtain temperature signals in real life.
[Response: Balderdash. I see no evidence that the proxies themselves smooth out temperature changes on time scales more than a century, which is what you’re really suggesting. It seems to me that what you’re really trying to do is discredit the data by suggesting the proxies don’t respond to temperature correctly. The argument doesn’t do you any credit.]
It also seems to me that you’ve incorrectly applied the ‘age model uncertainty’ in your analysis. You’ve presumably perturbed the spikes one way or the other for each proxy, but each of the proxies is already centered in the ‘correct’ position to start with. So you simply deviate around this known center with each of the proxies. Since there is uncertainty in the age model the spike certainly would NOT appear at precisely the same place in the raw data for each of the proxies even if we didn’t have the additional uncertainties suggested above. None of the other temperature events registered by those proxies have the advantage of appearing in the same place on all of the proxies in the raw data prior to your analysis. No wonder the ones that you introduced stand out compared with data with inherent uncertainty.
[Response: The purpose of perturbing the ages is to simulate the impact of age uncertainty, after perturbation none of the proxies shows the synthetic spikes at precisely the same time, and the time differences are in accord with the age uncertainties.]
Or perhaps those concerned about the number of runs could run it themselves. Any takers?
Hah! Thanks! So now we know that if a ‘skeptic’ doesn’t speak of downward spikes both sides of an upward spike, he’s a denier. :-P. “…no, you can’t see it in bristlecone record because the first it was too cold for growth, the too warm for growth, and then too cold for growth, so there’s a problem with the instrumental record…”, still getting funnier to construct a ‘plausible’ ‘septic’ argument.
Tamino, your argument about a signal spike (as opposed to attenuation of 1/300 per year sine wave) makes sense.
However, otherwise I still don’t think that you’ve justified your methodology or answered the concerns I raised. I’m sure that you are more familiar with the use of this form of temperature proxy than I am. Still, I know well enough that the standard for using such a proxy is a question of how useful they are at measuring something, not that they are beyond scrutiny. Are you saying that if regardless of circumstance you couldnt extract a known 100 year temperature event with the same precision as the one you introduced that the proxy would be ‘incorrect’? BTW: What do you think the physical significant is of there being ‘noise’ in the signal?
And you actually didn’t address my point about age uncertainty. Prior to your perturbation step the spikes in each of the proxies all appear in precisely the same place because you introduced them that way. Real temperature signals would not come out that way in the raw data (unless there was no uncertainty in the aging).
Mike, I think you might want to read the post again. Even before Tamino does his smear (be it of 100 or 1000 runs), the signal that appears in the reconstruction is reduced–a reflection of the imperfect resolution and noise of the proxies. I think a lot of people are missing this.
Snarkrates, I think that Tamino explained why the signals are reduced before he does the Gaussian spread. I don’t imagine that either the noise or resolution have much effect on reducing the spikes. As explained elsewhere in the thread the limited resolution of each individual proxy doesn’t limit Tamino’s spikes because when combined you can relatively good resolution. So for example proxy #22 with 150 year resolution might have a data point at -3060 BC and next at -2910, but then #35 with 80 year resolution has a datapoints at -3070 -2990 and -2910, etc. You can gauge the noise floor by what’s around the spikes. The only actual reason that the spikes are less an 0.9K is that not all of the proxies have observation times that cover the spikes.
Marcott’s sensitivity analysis is that you take the proxies as ground truth and add synthetic noise, in order to simulate what we believe actually happened. So in that model, tamino’s analysis is exactly what we need to do to simulate a 100-year simultaneous spike. The uncertainty happens after the ground truth occurs.
The warming and cooling is simultaneous worldwide by assumption; we currently see simultaneous warming almost everywhere. Tamino has already mentioned regional effects above.
Excellent analysis Tamino.
I’m starting to believe that every data analysis paper should include, perhaps in the supplementary material, an example of how the analysis performs with synthetic data with known characteristics. That would mean that the methodologies that emphasize unimportant parts of the data, or completely remove the interesting parts (e.g. McLean’s farce of a couple of years ago) would have a harder time passing peer review.
If a proposed methodology doesn’t work with synthetic data then there’s no way it’s going to work with real data…
Tamino, I also wonder how it would play out if you did insert something more like a 0.9K amplitude sine wave (at 1/400 per year frequency) so long as it was perfectly in phase in each proxy as was the case with your spikes. Following the same methodology are you thinking that sine wave would be much more attenuated than those spikes?
I went ahead and repeated the experiment using 1000 (rather than 100) perturbed records. It doesn’t change the conclusion. See the update at the end of the post for the result.
Thank you.
Fantastic Tamino,
Thanks.
Fully expected, of course. But some lessons are only learned the hard way ;-)
The Admiral’s test… thanks for taking the trouble.
Those two runs are identical. I expected them to be similar, but those are exactly the same. Is there an error or are the differences just too small to detect by eye?
[Response: Oops. Checking my program, I made an error. When I ran the 100 I saved the results to a file, then put a re-load file command just before the plots so I could freely produce plots without re-running the computation. When I ran the 1000, I left in the “re-load” command just before the plotting script so it re-loaded the run of 100 for plotting. That’s a bummer, because I didn’t save the run of 1000 so now I’ll have to run it again.]
Thanks Tamino for this analysis.
One comment : I am under the impression you consider for this analysis that proxies do pinpoint temperature anomaly measurements with a certain sampling rate – to make myself clear, a given proxy measure temperature anomaly at 3456 BC and not 3455 BC. Thus, if the proxy “misses” the spike, too bad for him.
However, I was wondering if some proxies do not, in fact, measure temperature anomaly average over several years. To make an analogy, tree ring measure temperature anomaly average over the growth season, and not a peculiar day within a year. Thus, if I am right, even if a proxy central date “misses” the spike, it would still “feel” it to some extent.
Your use of gaussian random noise tends to bring in this kind of consideration, if I understood correctly.
It may be worth trying to inject some physics and take into account the average time measurement of each proxy, but that’s an awful lot of work. When I tried to make a crude sensitivity analysis like you did, I made the simplistic reasoning “the proxies have a measurement span of 100 years, if a spike like the one we know appears it should generate a point at 0.4°C higher than its neighbouts, this spike is bigger than the error bars therefore we should have seen it”.
If I had some time, I should try some things by inverting proxies dataset assuming a linear relationship with temperature anomaly. The part I have to ponder, if I take this road, is how to inject temperature measuring averaging time (must be a matrix of some sort). The saddest part is, I’m sure someone already did this kind of things, and I try to redo the wheel.
Once again, thanks for the thoughts. Let’s wait for McI to find a page in his 1975 teenager diary “clearly showing you plagiarized him once again” …
The only proxy for which I would expect a substantial lag between the a temperature change and the response is pollen. The other proxies should all respond either within one year or with at most a few years lag (chironomids). Even for pollen, some response should be apparent immediately, even if it takes some time for vegetation to re-equilibrate. There are only a few pollen records in the compilation, so I would not expect this to be important.
Sorry, I have difficulties to correctly write what I am thinking about, you will better understand you see the gestures I do to formulate my thoughts (see them over the Internet ? )
In my mind, I didn’t think about the lag (a measure realised at t=t0 represents the temperature at t=t0-dt) but about the fact that some proxies may represent the temperature anomaly average over several years
Granted, I do not know anything about proxies, so maybe that was just a bad speculation. Since the sampling rate of several proxies is more than 50 years, I was more or less expecting that the proxies measure an average temperature anomaly over 20 years or something like that. I guess I have to work on that first :]
Tamino,
I have done exactly the same analysis as you did but using the individual proxy measurements binned into 50 year intervals. I used the Hadley algorithms for the global averaging of the 5×5 degree grid. I found that you are indeed correct and the peaks would be detected. The signal however is more smeared out than yours is.
What is even more interesting is that the underlying data does actually show a few slightly smaller peaks similar to the generated ones. One of these coincides with the medieval warming period !
see http://clivebest.com/blog/?p=4761 for details.
Correction – the correct URL to the study of peak detection in Marcott’s data is http://clivebest.com/blog/?p=4833
clivebest, the artificial peaks in your data seem significantly larger than the fluctuations you are pointing out in the Marcott record, including the medieval warming period. Have you done any analysis to assess the relative magnitude of these and what size an artificial spike would need to be to give a peak similar to that seen during the medieval period?
Wow, I don’t understand what you are concluding here. From what I can tell, the increase in temp anomalies we see over the last century are indistinguishable from the three of the past. This demonstrates that human CO2 contributions are insignificant contributors to temp anomalies, whatever produced those questionable spikes in the past are still at work today. You might think this “terrifies those in denial of global warming..” , but in my opinion it supports the deniers.
Cheers
[Response: Funny.]
Klem, I’m trying to apply some sort of logical transformation to make sense of your post, but the only one I can see that works is negation.
Does this represent a new measure against which all poes need to be judged?
It makes sense that 1000 iterations doesn’t make much difference, since the total time perturbation is about 100 yr and the signal is about 200 yr long. You filled the perturbation space with 100 records and after that you were stacking them.
I have a general question, inspired by an older post on wildfires. If someone (me, for instance) gets key ideas from one of your analyses and wants to take those further for their own work, how would you prefer to be credited? Just the blog citation? Reply by email if you’d like.
[Response: That’s fine, it’s not a big deal.]
More on topic for this thread, I encourage you to bundle the best of your original Marcott analysis into a letter to Science, or another journal.
Tamino, consider the more complete response provided during the FAQ:
“Q: Is the rate of global temperature rise over the last 100 years faster than at any time during the past 11,300 years?
A: Our study did not directly address this question because the paleotemperature records used in our study have a temporal resolution of ~120 years on average, which precludes us from examining variations in rates of change occurring within a century. Other factors also contribute to smoothing the proxy temperature signals contained in many of the records we used, such as organisms burrowing through deep-sea mud, and chronological uncertainties in the proxy records that tend to smooth the signals when compositing them into a globally averaged reconstruction. We showed that no temperature variability is preserved in our reconstruction at cycles shorter than 300 years, 50% is preserved at 1000-year time scales, and nearly all is preserved at 2000-year periods and longer. Our Monte-Carlo analysis accounts for these sources of uncertainty to yield a robust (albeit smoothed) global record. Any small “upticks” or “downticks” in temperature that last less than several hundred years in our compilation of paleoclimate data are probably not robust, as stated in the paper.”
This tells us straight out: ‘temporal resolution of ~120 years on average’ that the proxies are themselves fundamentally limited in their ability to capture the kind of spikes that you added to the data.
[Response: Nobody claims that the proxy data and Marcott’s procedure don’t seriously attenuate rapid fluctuations, making them harder to find. But there are 73 proxies which combined give a “net” temporal resolution much finer than 120 years. Even some of the individual proxies do. The idea that the existing limitations make all features of less that 300 (or whatever) years duration vanish without a trace is absurd.
And by Marcott et al.’s own computation (see panel (a) of figure S17 in their supplement) attenuation at low frequencies isn’t even large, let alone complete. Well, most of the signal power in the synthetic spikes is at frequencies below 1/300, in fact a significant fraction is at frequencies below 1/1000.]
You said ‘Balderdash. I see no evidence that the proxies themselves smooth out temperature changes on time scales more than a century, which is what you’re really suggesting’
Even smoothing on a twenty year time scale would significantly attenuate the amplitude of a 0.9K spike, so it’s not really true that I’m suggesting ‘times scales more than a century’.
[Response: Twenty years? Evidently you haven’t bothered to do the computation. That isn’t “balderdash,” it’s bullshit.]
In any case the authors themselves offer you evidence that smoothing on the order of centuries is inherent to the proxies:
‘Other factors also contribute to smoothing the proxy temperature signals contained in many of the records we used, such as organisms burrowing through deep-sea mud, and chronological uncertainties in the proxy records that tend to smooth the signals when compositing them into a globally averaged reconstruction’.
Certainly due to limitations in resolution, local short term climate factors and these kinds of sources of contamination (and variance in response times of proxies on the order of 120 years resolution) would also introduce qualitative variance in these temperature spikes, whether in the positive or negative direction and they would certainly not all appear at exactly the same time in all of the proxies as they do in your example prior to your perturbation step.
Unless you have some kind of explanation I have to conclude that while your efforts here are praiseworthy, your assumptions are apparently flawed and the results of your analysis mislead others into thinking that this reconstruction asserts something about lack of comparable historical temperature events which the authors clearly deny. This is exactly why it is significant that they have provided this FAQ to answer these questions, revealing that some original misinterpretations of their results are unfounded.
[Response: I’m glad you form your own judgement rather than merely follow that of others. But unless you have a better explanation than you’ve offered for why such large excursions (about the size of the *entire range* of variation of the Marcott reconstruction) with plenty of low-frequency power would absolutely vanish without a trace, I’d say your understanding is flawed and you’re misleading yourself. Unless you have something to offer other than repeating yourself …]
Given that Marcott et al have calculated a frequency dependent gain function for their Monte Carlo analysis (Supplemental materials, figures S17/S18 – ), couldn’t that be used _directly_ to see what effect it has on a 100yr up/100 yr down ramp like this? Create a trace with variances as per the last 1ky and perhaps the instrumental period, add the spike, and filter as per that function?
As you noted, a spike like that is composed of many frequencies – it might be interesting to see what is preserved by that filtering.
From the Marcott FAQ quoted above
It would seem that some have interpreted this to mean that “no temperature variability [of any magnitude] would [ever] be preserved with our method at cycles shorter than 300 years”.
But Horatio was under the impression that “size matters” — and not just for the subject of those ads you see on TV late at night.
Or perhaps this is just wrong and the perturbation/averaging procedure of Marcott would “disappear” even a “spike” that had amplitude of 10 degree C as long as it had duration less than about 200-300 years? (high frequency components)
If so, one thing certain (maybe the only thing): Marcott will never be asked to do a late night TV ad for mann enhancement.
” The perturbations include “smearing” the age estimates (introducing random changes to see how that affects the result), simply because the ages are, after all, uncertain. For each proxy, each age was offset by a random amount based on its estimated uncertainty. ”
Please could you give some detail about the perturbations – presumably they were random. What distribution? What standard deviation?
Thank you.
Publish! Please! Pretty please!
Tom, Tom, Tom…. that would be peer review. This is the contrarian version – smear review. Not the same (obviously), but they think it is.
Excellent work. It’s important to point out that even though the underlying time resolution of Marcott’s proxies individually was about 200 years, the resolution of the entire database is considerably less than that. Marcott’s database contains 8600 raw data (i.e., non-interpolated) points in the 11940-0 BP range, which is an average of 72 raw datapoints per century. Thus the mean resolution of the 73 proxies when combined is about 100 years. It’s simply not possible for a 100 year up, followed by a 100 year down, to escape notice.
On the subject of resolution, I’d also like to point out the relationship with a previous post of yours on variable star observation, https://tamino.wordpress.com/2012/06/06/seeing-the-light/
Note that the final resolution of the entire dataset is *smaller* than for any individual observation, due to the statistical power of large numbers. That’s what’s happening here with Marcott’s data too.
KAP, I understand this point that you can create a higher resolution collection by adding more and more lower resolution data sets. You claim therefore it’s impossible for 100 year up 100 year down events to escape notice? That’s bizarre considering that the author’s response to this question: ““Q: Is the rate of global temperature rise over the last 100 years faster than at any time during the past 11,300 years?” Are you and Tamino suggesting that he got this answer wrong?
You have to first answer other relevant questions:
1) How much does the high frequency temperature signal get smoothed out in the proxies themselves? If the proxy filters out the fast changes it doesn’t reappear just because you sample at higher frequency.
2) how accurately can you combine various data sets to generate a high resolution reconstruction of a 100-200 year signal? Do uncertainties in aging and possible variation in response times of proxies not conceivably pose a problem in that reconstruction?
Mike,
I’m claiming that it’s impossible for 100 year events of large enough amplitude to escape notice in Marcott’s data, and .9°C is large enough. Did Marcott answer the question wrong in the FAQ? His answer was that they didn’t really look at that question, and I’m sure he’s right: they didn’t. If they had, they might have followed a procedure similar to Tamino’s, and realized that spikes of that magnitude would have been detectable, if they had existed.
1. How much HF signal is smoothed by the proxies? It depends on the proxy. The lower-res proxies might miss a spike, but not all data in Marcott is low-res, and not all proxies would miss it.
2. Sure, uncertainties pose a problem, but that’s exactly why Marcott (and Tamino, supra) use the Monte Carlo method. Which shows that even accounting for uncertainties, a spike of that magnitude would be obvious — IF it existed.
So in other words you figure that Tamino has now added to the original findings of the Markot reconstruction and that we can now conclude exactly what Markot said they could not conclude?
Just to be clear Tamino has not taken into account that ‘low-res proxies might miss a spike’ that not all proxies would pick up a given temperature event, he hasn’t limited inserting signals only to proxies capable of detecting the spike, he hasnt introduced expected smoothing effects of the proxies (which as far as I know may be significant even for higher resolution data sets – which may also be compilations of low resolution proxy data) he hasn’t performed this step taking into account aging model uncertainty of individual proxies (because he inserted the spike in all proxies with no timing error and then only deviates around this common center point with his perturbation step – obviously on average the spikes still persistently show up centered in the place where he put them).
So Im not sure that he’s actually tested what is being claimed here.
It seems to me that if we are talking about a real event, the proxies do have to respond more or less in phase, and this should be reflected in the aggregate–albeit with diminished amplitude due to smearing.
And of course this leaves aside the question of what could cause such a large spike–aside from a very clever but stupid species burning a few hundred million years of sequestered carbon in less than a century.
Yes. The standard deviation of a 300-year segment of Holocene temperatures, at Marcott smoothing, is 0.017°C. I’m saying that a fifty-sigma signal could not go unnoticed in the record, if it were there.
Snakerats, yes given a real event the proxies would experience the event at the same time. That’s all fine and dandy so long as we ignore all of the actual difficulties (ie uncertainties) from that point on. As mentioned by the authors, over time that signal that is in these various proxies can be contaminated can be smeared/diluted over a wider area (ie. time period). And of course when the sample is extracted there is uncertainty in aging. What they think is 3050 BC is actually 2700 BC (this is an example, I don’t know what actual uncertainty would be). So even though the actual event was simultaneous, that doesn’t mean that they show up in-phase and unattenuated in the resultant proxy data sets.
[Response: “Snakerats”?
I’ve not interfered with your expressing contrary opinions, on the assumption that you were arguing in good faith and with at least reasonable civility. Was I mistaken?]
Haha. Tamino, that’s for you to judge, But ‘Snakerats’ was a typo. Apologies.
Another point we should emphasize: climate changes do not occur in a vacuum. Climate must be forced to change, and those forcings leave traces in places other than the temperature record. If there were a .9°C spike somewhere in the Holocene, what could have caused it? If there were a huge spike in solar radiation, that would leave its mark in the beryllium-10 record (a known proxy for solar activity). The 10Be record is drawn from high-temporal-resolution ice cores; see for example Vonmoos et. al. 2006 http://ruby.fgcu.edu/courses/twimberley/enviropol/EnviroPhilo/Vonmoos.pdf figure 2, where normal Wolf cycles have an amplitude of ~800 MeV (corresponding to about .1% of TSI, or .34 W/m²). Assuming the skeptical-favorite low sensitivity of 2° per 3.7 W/m², TSI would have to change by 1.67 W/m² for a .9°C rise, about 5 times Wolf cycle amplitude — which would imply a 10Be spike of about 4000 MeV. It is abundantly clear from Vonmoos figure 4 that no such spikes exist in the Holocene record, even at 2-year time resolution.
Indeed, the sharpest centennial-scale spike of the most recent millenium in the Vonmoos data occurs between 1600 and 1700 BP, with an amplitude of about 1000 MeV. This would imply a TSI difference of about .42 W/m² and a global temperature rise of roughly .2°C thereby. (A raw non-randomized average of Marcott’s data shows a spike of about .1°C at that epoch. The difference is likely due to Marcott’s lower-res data, but the fact that the spike is visible at all is telling.)
The point is that we already knew, from CO2 data and from solar proxy data, that there have been no such temperature spikes in the Holocene. Marcott’s data simply confirms what we already knew. The denialosphere has once again let go of their trapeze without a net.
Tamino, thanks for your responses.
First, to clear up what I said about 20 yr smoothing: Sure enough you are correct, that if I apply 20 year smoothing to the ramp function the effect on amplitude (and shape) is very small – I obtained a peak at 94% the original size.
Since I took the time to setup a spreadsheet to simulate this I also applied different levels of smoothing to both your ramp function and a sinusoid with frequency 1/400 years. I obtained the following (where we see % of original 0.9K peak)
Smoothing (yrs) SPIKE SINE
20. 94%. 99%
50. 86%. 97%
100. 74%. 89%
200. 49%. 62%
300. 33%. 28%
500. 20%. 19%
1000. 10%. 13%
Maybe this is interesting in itself that for smoothing on the order of 200 to 1000 years that the spike amplitude is attenuated to a similar degree (if not typically a bit more attenuated ) compared with the sine wave (probably due to its high frequency components dropping out). At much higher levels of smoothing like 2000yrs or more the sine wave is much more attenuated. I’m not sure that the specific shape of the signal makes much of a difference overall in this problem. Also consider that without prejudging what is/is not a likely scenario of historical temperature variation that there’s no reason to think that such 100-200 year temperature variation is a rare thing at all. Therefore a more continuous sinusoidal-like signal might be a more relevant test anyway – especially if you are trying to prove that such variation doesn’t occur.
You said ‘[Response: Nobody claims that the proxy data and Marcott’s procedure don’t seriously attenuate rapid fluctuations, making them harder to find. But there are 73 proxies which combined give a “net” temporal resolution much finer than 120 years. Even some of the individual proxies do. The idea that the existing limitations make all features of less that 300 (or whatever) years duration vanish without a trace is absurd.’
I’m thinking that this ‘net temporal resolution’ argument might also be a bit of BS ;). If the temporal resolution of these proxies are 120 years on average are you really claiming it’s likely that they wouldn’t exhibit smoothing on at least that same timescale if not larger? If you agree that the data itself might very well exhibit significant ‘attenuation of rapid fluctuations’ then why did you insert 100 year timescale signals scaled to the same gain as 2000 year signals? And how can you build a high resolution picture with a combination of low resolution proxies if there is significant uncertainty in the aging of the individual proxies on the timescale of these kinds of events? Think sbout it, if the high frequency data points of individual proxies are not in phase (due to known aging model uncertainties) then what do you think the result is when you combine them? Yet you don’t see a problem with artificially inserting these spikes with full 0.9K amplitude in ALL of the proxies.
Lastly you said “But unless you have a better explanation than you’ve offered for why such large excursions (about the size of the *entire range* of variation of the Marcott reconstruction) with plenty of low-frequency power would absolutely vanish without a trace…”
Again, the first point is that you inserted these particular signals in the data yourself without consideration of how such a temperature would actually appear in the proxies in real life. So your test only proves that the Marcott reconstruction steps won’t remove your artificial spikes, not real temperature signals. Secondly, regarding your point about low frequency power: if you remove the high frequency component and are left with a low frequency signal it will be much lower amplitude and will be low frequency. So obviously they don’t appear as fast-responding signals (comparable to the instrumental records). Moreover, if these spikes are not in fact rare, but more normal/semi-continuous variation then you no longer retain this low frequency power after filtering.
Physics, please. Back your hypotheticals with plausible forcings. Wild swings in this or that, but be specific.
To shoot down the hypothesis that recent warming is exceptional, you need two things:
1. Show that the temporal resolution of the proxies in question can’t capture events like current warming (not just Marcott, but Tamino, as well).
2. A plausible phyiscal explanation for such spikes that doesn’t involve CO2 (if you argue that they were caused by extraordinary increases in CO2 that would be an own goal), but other forcings (thus far, not captured in any physical record).
In a real sense, tamino’s analysis is interesting, but not necessary (except to refute bullshit). There are no known paleo changing in forces that would provide such spikes, regardless of Marcott’s temporal resolution.
Feel free to suggest some fairy dust ideas unsupported by physical evidence for our enjoyment, of course.
Tamino’s analysis is interesting, but from a physical standpoint, he’s simply knocking out a red herring, said knocking out being only necessary because of the politicized nature of climate science. Grown-ups who aren’t conservative dinosaurs don’t, after all, believe in fairy dust.
And while you’re at it; please give us a detailed explanation for how this fairy dust somehow manages to bluff all the different proxies. Show us some real physical mechanisms that you can back up with actual science.
Precisely, dhogaza. I’d like to see an analysis of likely forcings that could cause short-term spikes the size of the current. Divorced from physics, it’s possible to reduce this all to its absurd limit: a one year or one month 10C spike. Undetectable! It might have happened! Global warming disproven! Hoax! Light the torches and grab your clubs!
“… fairy dust.”
Proxie dust?
Mike,
Why not do this investigation yourself.
Then present your results.
Good suggestion Nathan. As I suggested in the first place, despite having criticisms of what was done here I think that this kind of analysis is on-point. I’m not certain that it’s necessarily a great exercise for an amateur. If I personally don’t understand the proxies thoroughly and then do an analysis based on my own assumptions and present that, then is that any more valid than what is presented here? I guess that if someone was to adopt a very cynical set of assumptions about the proxies and then obtained a similar result as Tomino that this would give much greater credence to his findings, but if we found this was not the case then we havn’t really helped to decide the question unless those cynical assumptions could be defended. I wish that I did have access to the proxy data and more discussion on the nature of the proxies used and their specific uncertainties to actually quantify some of these sources of error that we’re discussing. If anyone can point me in the direction to find any of that it would be appreciated.
“Moreover, if these spikes are not in fact rare, but more normal/semi-continuous variation then you no longer retain this low frequency power after filtering.”
When is a “spike” not a spike?
I can only say:
“KAP | April 4, 2013 at 11:17 pm”
Looking forward to you tearing apart the latest CA post…
I’m not seeing much serious analysis going on there.
This has always been the problem with Steve McIntyre: he has pretty good stats fu, but little knowledge of the physical constraints (i.e. climate science) that must go hand-in-hand with the stats. So, for example, this leads to him way overcooking the ‘red’ noise in his simulations that were used as a basis for the Wegman Report. His red noise had an auto-correlation persistence of about 19 years, when climate scientists agree that it should be between 1.5 – 2 years. That was a large part of the ‘hockey sticks out of random noise’ manufactroversy that he created, which Deep Climate has thoroughly debunked in “Replication and due diligence, Wegman style” (which I tire of linking to).
Now McIntyre (and Mike Blackadder) is making a similar mistake with his Marcott et. al. analysis: theorising places where huge spikes could hide, without proposing a physical basis for those spikes. This is not science. It’s mathturbation, as tamino likes to call it.
These people will never give up. If there’s a hockey stick, it must be gotten rid of, no matter what it takes.
Tamino, would you care to comment on this post by Clive Best, in which the spikes get flatter and broader than in your experiment? How could the difference be explained? Did you use different noise?
And maybe also a comment on the claim that Clive Best is blocked from your site. And if true, the reason for that…
Since Clive Best did put several comments on this thread, linking to his own post, and even got an answer from Tamino with technical points, you can easily give a straight answer to these “claims” coming from the usual suspects on dotearth.
Even if Clive’s analysis is correct, those peaks still show. So had there been similar spikes as today’s spike in the past, then they would be visible evidence of them in these proxy data.
“Skeptics” are again trying to muddy the waters. Nevermind the fact that if those spikes had occurred as skeptics were originally arguing, it would suggest a higher climate sensitivity. So what is it guys, spikes or no spikes? :)
It’s not from the “usual suspects on dotearth”, it’s from Clive Best himself from the link rovided by Lars Karlsson. “Tamino has blocked me from commenting again !”
Sorry, I should have noticed the comment by Clive Best above.
I agree with Tamino that introducing measurement errors in the spikes would not make much difference, but I think that introducing dating errors would have an impact.
Anyhow, in Clive Best’s experiments the spikes are still quite conspicous.
Mapleleaf:
“if those spikes had occurred as skeptics were originally arguing, it would suggest a higher climate sensitivity.”
This comment might lead to confusion, that is, many people think of climate sensitivity as temperature rise caused by 2X increase of CO2 over pre-IR’s 280ppm, although it is really increase in forcing.
Given ice-cores and well-mixed nature of CO2, we know there weren’t any inexplicable upticks in CO2 in early Holocene, so any higher sensitivity must be from other forcings, not CO2.
Personally, I think the only explanation left for the proposed big early-Holocene upticks are the (Maxwell’s) demons I described at RC, which magically spent a century moving ocean heat content away from the marine proxy locations (probably into other spots in the deep ocean), and then the proposed basilisks (or demons in reverse gear) then moved the heat back to escape all the proxies. As noted at RC, these are different than the gremlins and leprechauns needed to explain current warming without GHGs.
John Mashey,
Thank you for clarifying, that is what I was trying to convey.
Mike can’t investigate this himself because what he is claiming is that we can never know if proxies are capable of detecting these spikes. It’s like the god of the gaps argument in creationism. It can be used as long as we don’t have a combined proxy/instrumental overlap on a full spike(basically forever because the modern spike isn’t going to come back down for centuries).
It doesn’t matter that there is no mechanism for the spikes to be created. It doesn’t matter that the mechanism generating the modern spike is known. The point is that they can just say “We’re not 100% sure.” forever.
Actually Ryan, all Im doing is asking the question of whether the proxies could detect the spikes. I’ve admitted that I don’t know the answer to that question one way or the other, and like I said given more details about the specific proxies someone could presumably form an argument to support claims about the expected proxy response. I don’t presume that this is necessarily an unknown quantity just because I don’t know the details – this isn’t even my field of expertise and I don’t have access to the details. However, I think that as a starting point you can consider some of the responses given in the FAQ in questioning the ability of the proxies to track any such shorter term variability in global temperature.
See, that’s where you need physics, because they chose those proxies because of a physical feature – they understand HOW the proxies reflect temperature.
Bingo, Nathan! See other posts above, and in fact all over the climate blogosphere. Mike Blackadder is JAQ, to which he knows there is a perfectly valid answer, that he doesn’t want to know about because it conflicts with his ideology.
Exactly Nathan, so refer to what the authors said about the manner in which these proxies respond to temperature on the timescale we are discussing.
Metzomagic, I’m all over the blogosphere, because Im kind of a big deal. Maybe you guys could research some of my comments and write a book or something. (I wish I knew an emoticon to indicate eye rolling..)
Mike,
2. Uncertainty, and references therein. Note that these proxies weren’t invented by Marcott et al.; they can be found discussed all over the literature and the Internet…
Damn. Now you made me do your homework. No, I don’t expect a thank you
Gavin’s Pussycat, thanks for the link. I didn’t know where to find this info.
> I didn’t know where to find this info.
And yet you’re ‘all over the blogosphere’? Perhaps better to leave the field to those who know their way around?
Ah well, I’m in a good mood today. Here’s a freely accessible copy of Marcott at al., so also the unbegoogled can join in the fun
Gavin’s Pussycat, that’s great thanks. I think that some of you guys need to learn to take a joke a little better though. Why so serious?
Are you trying to tell us that you shouldn’t be taken seriously? Sure…
i see i am a little late to this party but the researchers own work suggests the proxies (at least an average of them) will not detect these changes
Click to access Marcott.SM.pdf
in Table S1 they actually list the resolution they used
“Golden Spikes”
— by Horatio Algeranon
Sixty-year “spikes”
Were all the rage
Natural cycles
In by-gone age
Marcott dissed
This magic number
While Monte and Carlo
Simply slumber
Let me put this in a different way. When Marcott says in the FAQ “We showed that no temperature variability is preserved in our reconstruction at cycles shorter than 300 years,” what does that really mean? It means that there is no variability in the signal greater than, say, four sigmas, and four sigma signals (or less) are not preserved. Fair enough. But a signal of .9°C in 100 years up, followed by .9°C in 100 years down, is a fifty-sigma signal. If it were there, they would have seen it, easily.
“Climate of Sin”
— by Horatio Algeranon
“50-sigma” is not enough
The “skeptic” crowd is really tough
“100-sigma” is the min
To answer Mann’s Original Sin
A couple of people have asked for me to propose some possible cause of global temperature variations in the past comparable to what is observed today: example from dhogaza | April 5, 2013 at 4:22 am “Physics, please. Back your hypotheticals with plausible forcings. Wild swings in this or that, but be specific.”
I think that you folks need to step back for a second and think about what you’re saying. The whole point of this discussion is to test whether Markot’s reconstruction is offering proof to support the claim that variation on the order of 0.9K per century probably didnt occur over the past 10,000 years. The usual way of testing a claim like that scientifically is to consider the ‘what if my hypothesis isn’t true’ scenario in your test. This is what Tamino has actually done in this analysis. He asks – can this Marcot result offer proof that modern warming is mostly anthropogenic? He answers by proposing; if non-anthropogenic variation had occurred in the past what would have been the response of the reconstruction? The fact that this yields a different result from what we see in the actual reconstruction offers proof that such events in fact did not occur.
What some of you seem to suggest is that we shouldn’t test the reconstruction against the possibility of larger amplitude natural temperature variation unless there is further evidence to support this possibility. Maybe you have good reason to question the likelihood of that scenario. That’s fine, but the logical inconsistency on your part is to simultaneously claim that Marcot itself is offering any proof to support this conviction. You say that ‘X’ (eg Markot) proves the answer is true because it is implausible that the answer is false. ‘X’ actually contributes nothing to the verity of that statement.
[Response: First of all, it’s not proof, it’s evidence. You yourself have offered possible reasons to doubt (I’m not endorsing them but I recognize them) and there’s always the chance I’ve made some mistake.
Second of all, asking for a physical basis for past temperature excursions is not ducking the issue at all. It’s the opposite — the universe is bound to obey the laws of physics and if there’s no plausible physical explanation for past excursions, that’s further evidence against their existence.]
> Clive Best
also posted at RC; Gavin’s inline response there: “… adjusting age models … might be fun to do here with the actual data”
Mike,
Tamino’s approach is the other side of the coin to asking for physical mechanisms. By showing that a very large, centennial scale spike would leave a mark, he has placed further constraints on the sorts of events that might escape notice–either their size or duration. A move to smaller magnitude by the skeptics means that the current warming is still exceptional. A shorter duration event of large magnitude is even more difficult to countenance from a physical perspective. Tamino’s analysis, along with the need for physicality pretty much makes the arguments of the pseudoskeptics irrelevant.
I think that in all discussion about the details of Marcott’s reconstruction one thing tends to get overlooked.
That is that even if there HAD been super large natural temperature excursions in the past AND they had somehow not made it into Marcott’s reconstruction (which we know to be very unlikely thanks to Tamino’s work), that wouldn’t change a thing about what we know about the temperature rise over the last 200 years and the underlying causes and mechanisms.
As far as the right policy decisions are concerned, we have had enough information since at least 20 years, if not more.
Mike Blackadder says
Is that really what Tamino has asked?
Do we need Marcott to answer that?
If so, we better inform all the scientists who contributed to AR4 that their main conclusion was unwarranted.
Horatio thought he had a monopoly on goofy, but this thread gets goofier by the minute.
‘Is that really what Tamino has asked?
Do we need Marcott to answer that?’
See that’s the problem with me using imprecise language. Should have said ‘evidence’ not ‘proof’. Lesson learned ;)
No, Marcott et al doesn’t provide such evidence, nor does the paper claim to, nor have they in public claimed to.
Modern warming is mostly anthropogenic, that is not an item of dispute within climate science.
Deal.
Is that the problem?
Or is it reading comprehension?
[Response: I don’t want to single you out, Horatio (nor should I), but to readers in general —
Although I don’t agree with Mike Blackadder, I have found his arguments cogent and his mind open. Let’s not lump him in with the “deniers” until there’s some real evidence.]
Horatio and dhogaza, I think that you guys might be missing something in the discussion here. What do you think Tamino is demonstrating here with regard to Marcott’s reconstruction? If you take the position that Marcott doesn’t itself provide evidence that modern warming is exceptional then why are you arguing with me? Very bizarre.
Sorry, Tamino.
But, honestly, is it too much to expect that someone who makes claims like
will at least have taken the time and effort to read and understand what it is that you have claimed (and not claimed) and what Marcott et al have done, claimed (and not claimed)?
There are a indeed a lot of cogent comments above — from KAP, KR and others. But it’s easy to get lost in the forest.
Not sure if the comments below are from the same “Mike Blackadder” and don’t much care, really.
It makes no difference either way.
What the fellow above has said speaks for itself, at any rate (and Horatio has never been much impressed with folks who get the buzzwords right but the gist of the argument wrong)
and here’s another comment
Horatio,
I’m with Tamino on this. As long as Mike is engaging sincerely and respectfully, I don’t see the harm. It is conceivable that his learning curve could have a positive slope, and the more objections we hear to Tamino’s treatment, the more opportunities Tamino has to improve it.
If Mike should decide to be a two-faced, disingenuous clownshoe on some other blog, that is his business and it is his credibility that would suffer.
“…It is the divergence from observed temperatures [briffa] that is the problem, not the fact that it declines.”
And, now, of course, it’s the lack of divergence that’s the problem Marcott et al face.
Diverge, converge, climate science is a fraud, regardless.
Or so we’re told …
Horatio, I’m pretty sure that those are comments that I’d written on some other blog. May have been Climate Audit, Real Climate, Wattsupwiththat or ScienceofDoom. Of course it isn’t as though it is at all relevant to the arguments/questions that Im posing here; but quite frankly I am familiar with the controversy surrounding Mann’s original ‘hockey stick’ reconstruction and how things unfolded with Steve McIntyre. Fun times.
Mike
Here’s a little test. See if you can spot the difference between number 1 and 2 (Hint: it’s not the proof/evidence word issue. Swap in ‘evidence” in number1 if that makes it easier)
1. “He [Tamino] asks – can this Marcot result offer proof that modern warming is mostly anthropogenic?”
2. “The Marcott et al. reconstruction is powerful evidence that the warming we’ve witnessed in the last 100 years is unlike anything that happened in the previous 11,300 years.”
You should recognize the first claim, of course, because you made it (and Horatio contested it just above), but somehow or other it “morphed” into a different claim (consistent with #2) in your “bizarre” reply (wonder how that happened)
The second claim is what Tamino actually said (which you also certainly NOW recognize because that’s essentially what you chose to include in your “bizarre” reply).
OK fine, so it was the anthropogenic quality that bothered you. Why don’t you just say that rather than act coy? Is that a clever way of avoiding the point that Im actually making? You do see how the argument that modern warming is exceptional contributes to the argument that modern warming is not natural? As others have mentioned here, assumptions of historic temperature variability go into other areas of the science (such as climate models) that help establish climate sensitivity to the anthropogenic forcings and feedbacks. If in fact we found that those assumptions were false this would impact our conclusions about the causes of modern temperature variation.
So is that really all you have to say about my comment at April 5, 2013 at 4:30 pm?
Tamino, yes I agree I’m being lazy and using the words ‘evidence’ and ‘proof’ as though they were interchangeable.
I also agree asking about a plausible natural mechanism is relevant to the climate change debate. However, if what we are trying to argue is that the analysis we are doing provides additional evidence of low natural variability (on ~ century timescale) the analysis obviously can’t be carried out under the assumption that there can no be no high natural variability (due to a lack of natural forcing).
I would argue the opposite, that such research can be done under such assumptions, and indeed that is how research is almost always done. If the results of such research belie the underlying assumption, that’s a Big Deal that requires explanation, and the paper will generate a lot of controversy. If the results of such research don’t contradict the underlying assumptions, that’s just normal science at work that never makes the headlines.
The problem here, of course, is that the assumptions of scientists, based on earlier research (that there are no spikes) are quite the opposite of the assumptions of deniers (that there MUST be such spikes, because otherwise global warming would be real and dangerous). Thus a paper which raises no controversy at all in the scientific community sends denierville into apoplexy.
OK KAP, so are you actually suggesting that it’s valid to adopt a methodology of analyzing Marcott’s data (and reconstruction) that disregards the possibility of large natural temperature variation in order to produce a result that demonstrates there could not have been large natural temperature variation? The problem with that has nothing to do with the expectations of believers/skeptics.
“OK KAP, so are you actually suggesting that it’s valid to adopt a methodology of analyzing Marcott’s data (and reconstruction) that disregards the possibility of large natural temperature variation ”
No he didn’t say that. As he said:
“If the results of such research belie the underlying assumption, that’s a Big Deal that requires explanation”
“assumption” != “disregard the possibility”.
To rephrase a bit …
“The problem here, of course, is that the assumptions of scientists, based on earlier research (that there are no spikes)”
The actual assumption is that there are no unknown natural forcings that could cause such a spike, because we know a lot about physics these days. A surprise on this order of magnitude would upset a wide swath of science beyond climate science.
“are quite the opposite of the assumptions of deniers (that there MUST be such spikes, because otherwise global warming would be real and dangerous).”
While denialists insist that unknown natural forcings exist which not only could cause such spikes in the past, but the modern rise in temps, and not only are they/it unknown but it coincidently matches the change in forcing mainstream science tells us is a result of changing concentrations of CO2, while also coincidently CO2 has recently ceased to act as a GHG.
Since such unknown forcings must exist, over 11,000 years there must’ve been spikes similar to today’s. That’s pretty much the argument, followed to its logical conclusion.
Lol. So it’s normal science to form a hypothesis, then carry out an analysis limited only to cases where the hypothesis is true, and then conclude based on that analysis that you’d confirmed the hypothesis? And the justification is that it would be really surprising if it turned out that you got a different result. That’s amazing.
That, of course, is a total misrepresentation of Marcott et al.
Why do you insist on lying?
If you really believe that assuming standard physics is the wrong thing to do, how can you possibly live your life except in fear? You can’t step on an airliner, etc. Everything physics (and other science) tells us is wrong.
I won’t live my life that way, sorry.
dhogaza, at what point did I suggest that this is what Marcott was doing? This line of discussion started when others here asked me to propose possible forcings that would cause temperature variation it the past. They ask that because I suggested to Tamino that in order for HIM to actually dispute claims of greater historical variability that we should model this 0.9K per century as regular variability. That’s because Tamino is trying to present an argument that Marcott’s reconstruction does actually provide evidence that modern warming is unprecedented. If you don’t understand that point then please start at the top and try again.
If you actually read what is being discussed then you won’t me by claiming that I’m a liar when in fact you just aren’t following the conversation.
Also, unless I am mistaken there was a reply from KAP before mine and has either been removed or is somewhere else in the thread. I was actually responding to something that he had said following my last comment.
Missed a word there: meant to say ‘If you actually read what is being discussed then you won’t [misrepresent] me by claiming that I’m a liar when in fact you just aren’t following the conversation.’ ;)
It can be hard to follow the arguments of the climate “skeptics” because they rarely articulate a clear hypothesis. I can’t help but suspect this is because their hypothesis, if stated baldly, sounds pretty ridiculous. So it takes a bit of reading between the lines to figure out what they are talking about. But I think that Tamino has successfully divined (and provided evidence against) the underlying hypothesis, which seems to be something like:
1. The theory of CO2 induced global warming is incorrect (never mind how). CO2 has little or no effect on global temperatures.
2. There is some other unknown (but natural!) physical mechanism that produces a temperature rise with coincidentally similar magnitude and kinetics to that predicted from the CO2 theory, but in contrast to the persistent temperature rise predicted from CO2, it is transient, and exhibits an equally steep fall.
3. The modern temperature rise is due to this other mechanism and it is about to reverse itself Real Soon Now.
4. Such brief temperature spikes are not uncommon, even though there is no actual evidence of one. You can’t prove they don’t happen because the proxy data doesn’t have the temporal resolution to detect a brief temperature spike.
Tamino’s analysis rather severely undercuts #3.
trrll, it takes a great deal of effort to convey to a low-information skeptic a convincing argument of how they are misinformed. The same is true when talking to low-information believers. If you follow much of the science then you know it isn’t something that fits well in a 200 word comment on a blog.
Hi Tamino,
I noticed your reply to Andy Skuce and was wondering if you had already redone the 1000 already? If not, the “update” text should be changed for now.
Sorry if I missed the updated update.
Very clever approach.
A suggestion–run a set of simulations with lower change values and see at what level the spike would be subsumed within normal variation–eyeballing it looks like it would be around 0.3 degrees/100 years
Tamino,
You might like to look at the latest thread on Climate Audit. A couple of statisticians claiming that Marcott et al have left out a major term in the Monte Carlo error estimation. I think they are wrong.
Tamino, looking at the 100 and 1000 perturbation graphs in gimp, they are identical. Even zoomed in to high resolution, on switching between them not a single pixel changes. I have no axe to grind with the general result, but this seems improbable. Is it possible that you posted the wrong image for the 1000 perturbation graph?
[Response: See this.]
T, from my mechanical engineering world we have strict rules on sampling rates vs. signal frequency rates. Ie you cannot reliably measure a 60hz ac sine wave with a 5hz analog sampling device. The result ends up being strange results that don’t show spikes well and also might not show averages well either. Can you help me understand how 120 year sampling proxies can resolve relatively high frequency temperature spikes?
[Response: Setting aside that a temperature spike has significant signal power at low frequencies …
Irregular time sampling enables you to get information at frequencies much much higher than the mean sampling rate, or even the maximum sampling rate. Those who don’t understand the impact of uneven time sampling often make your faulty claim.]
Thank you for time.
*your time.
Yeah Tamino the same thing happens when you have limited resolution measuring a given signal over a long period of time. For example you might be measuring a 127 mV voltage, but your A/D only has 10 mV resolution. It’s actually an advantage if that input signal is a bit noisy or drifts around a bit with time because then you’ll pick up some 120mV readings and 130mV readings, and given enough time you can obtain a higher resolution measurement than the A/D resolution.
No, that’s not the same.
What you are describing is an increase in precision due to averaging. It’s the reason that you can get precision for an average temperature (or average temp anomaly) that is better than 1 degree (eg, 0.1 or even better) when 1 degree is the best your thermometer can resolve (ie, you can only measure the individual temperatures that went into the average to the nearest degree)
What Tamino is describing is due to the fact that when you sample a sinusoidal signal unevenly, you sample the sinusoid at different parts of its cycle. With enough samples, you will “cover” the cycle (or at least its basic outline)
Thanks Horatio, I know that they aren’t the exact same thing. I didn’t want to appear overly pedantic by specifically pointing out the parallels between the two situations (ie. that you require noise/variance on the signal in one case, just as you require proxies with different sampling phase in the other, that you obtain better precision sampling for a longer period of time in one case and better resolution the more data sets you have in the other).
Mike,
There’s a big difference between being “pedantic” and being “precise” with words.
The latter is actually necessary for science (but only if you wish to communicate your ideas with other people :-)
Perhaps you should worry less about the former and more about the latter.
And by all means, read Tamino’s posts, because they are a paragon of precision and clarity.
…and don’t forget “accuracy”, either.
Statements can be very precise and utterly meaningless.
Yes precision and accuracy are not the same thing. Is this newfound wisdom that you’ve been dying to share? Quite honesty I think that this criticism of yours is a silly point to dwell on. I probably don’t communicate as well as I could, but it isn’t that difficult to decipher what I was saying especially after I explained the point in more detail a second time.
How anyone could divine from your comments that they were even a reference to (to say nothing of meant to “illuminate”) Tamino’s comment about “uneven time sampling” is a mystery that only you can solve.
I’m guessing that not only is tamino working on the mean of 1000 perturbed runs thingy, but also on how to make sure the .9C spike is injected into the proxy data ‘holistically’, so as to remove all doubt about this issue once and for all. I also suspect that I am not wrong in this assessment of the current state of affairs :-)
Tamino, nice piece of work.
I don’t understand why it created so much controversy and in particular why people claim that it disagrees with conclusions from the original papers. They claim resolution of 300 years for a cyclic signal. Your spikes can be very simplistically assumed to be a half of the sinusoid with 400 years period that is well within the resolution claimed by authors. Where is the disagreement?
Moreover, I would like to stress that authors of the original paper wrote about cyclic signal. It means roughly that any upward spike should be followed by equally strong downward one and they should average out after full cycle. The upward spike that is not followed by a downward one is a different beast – it won’t average out and will be visible even after averaging.
By the way – isn’t the MC procedure roughly equivalent to the moving average with Gaussian (or whatever distribution of choice) kernel?
It is quite obvious that application of moving average to a spike gives rather different result than to a cyclic signal.
Indeed, sharp observation. I didn’t think that far.
I think so — the word you’re looking for is ‘convolution’.
I’m not conversant in the literature on this subject in any serious way…but am I reading it correctly that those arguing against AGW are asserting the existence of a 60-year cycle without proposing a theoretical mechanism for such variation? Because if they just arrived at that through data mining on a time series that’s the type of naive use of statistics that leads to all kinds of spurious correlations.
faustusnotes, I looked through most of that thread myself. I think that between Nick Stokes, RomanM and others that it was a pretty reasonable discussion. I wasn’t sure at first, but now Im pretty much convinced that the authors missed accounting for the total uncertainty of the temperatures.
What are you referring to when you say “If you do the calculation you’ll see that about 90% of the variance in RomanM’s revised calculation is obtained by scaling the residual error of the proxies by the slope”? Are you referring to the (0.05/0.033)^2 term? I don’t know that it is particularly convenient, it follows from the regression model that includes the residual error term, but I think I know what you mean. Why use a less accurate one-size-fits all calculation when you can more accurately determine prediction intervals from the fits themselves?
I think that RomanM was making the same point during his discussion with Nick: http://climateaudit.org/2013/04/04/marcott-monte-carlo/#comment-409983
[Response: When I see this:
Then I know such a place is not governed by reasonable discussion.]
I can’t say anything about his experience at CA. I can say that Ive never seen anything like that any of the times that Ive visited the site. I would think that faustusnotes’ experience is probably not typical. Steve McIntyre actually runs a pretty tight ship mediating the comments. I think CA can be unwelcoming for outsiders sometimes because the topics are often technical, and not written so as to be understood by anyone other than an expert in statistics.
I do know that this is the first time that I have visited this blog. And it’s the first time that Ive had someone search my name on other sites and copy comments I’d made elsewhere without context behind those comments as a way of discrediting me personally. I know it’s not the same as someone posting pictures of your kids, but still it’s thuggish behavior.
Not that I would blame you for that, that’s just the actions of one (or more) individual(s), and there are always those individuals who don’t know how to actually carry out a discussion or have the patience to deal with someone who says things they think are wrong or don’t agree with. I wouldn’t describe this blog as a bunch of thugs, nor would I describe CA that way.
Are you f*ing serious? Those were comments directly related to the subject at hand, and to your persona’s credibility as someone who is honestly just trying to learn. If you no longer hold those views, just say so, that’s OK — I would be happy to see you, or anyone, change their minds after learning more. I’m also more than happy to see you point out the importance of context. Remember climategate?
Gavin’s Pussycat, actually those comments were not related to the discussion that we are having. The point was to put up a couple of things here that I had said previously that at face value most people here wouldn’t agree with, but doesn’t include the context of the discussion. In other words, regardless of whether I am raising legitimate arguments here, the point is to say- oh he’s a denier and so comes here with an agenda (other than discussing what he actually thinks). If it was important to establish where I am coming from on other areas of climate science (because such prejudice is actually significant for some reason) then he could have linked to the entire thread, rather than just dropping in comments that on their own provide very little information about what is being discussed and why it is being discussed.
I’m not so offended by this that I was turned off by this blog or refused to talk to the guy. But still this is a form of debate that seeks to discredit the person, rather than illustrate the flaw in the argument. And it is thuggish behavior, albeit not the same as posting pictures of someone’s family which is what I said in the first place.
I have to say that I have commented volubly at CA in ways that are seen there as misguided. I have encountered mockery and hostility, and my ethics are often impugned. But despite commenting under my own name, I haven’t felt personally threatened, and the editorial treatment has been fair.
faustusnotes, my impression is that in this case Muller’s calibrations for the proxies is exactly what is being used in Marcott to convert proxy measurement into temperature estimates. I think that if the calibration being used doesn’t apply because for example data was collected in completely different circumstances that have different inherent uncertainty then that’s a whole other problem. Then you obviously can’t be using Muller’s calibration or his model uncertainties applied to these proxies, but that’s exactly what Marcott did. The only thing is that they didn’t include all of the uncertainties from the original model I don’t see how they can justify only including the uncertainty in the regression coefficients as though a corresponding proxy response would fall right on the regression line, when in reality the proxy responses are observed as scattered around the regression line according to E.
Are you suggesting that really you can’t use Muller’s model as representative of the uncertainty for the proxies used by Marcott?
By the way, I’ve never seen that kind of thing go down at CA (like what you describe as them posting pictures of your family). I understand why based on that experience that you aren’t keen on returning.
‘I’m pointing out that it’s altogether too structural: you can’t seriously believe that the error in the x’s must be driven by the error in the y’s.’
I don’t think that I paid this point enough attention in my last comment. I need to think about that some more.
A statistician, a mathematician, and a lawyer arrive in Australia. From the taxi driving them out of the airport they see half a dozen of sheep. They all appear black.
“Look,” says the statistician. “That suggests that Australian sheep are typically black.”
“I disagree,” says the mathematician. “All it proves is that there are black sheep in Australia.”
“No, you both are wrong,” interjects the lawyer. “It only proves that, of those six sheep, the sides that are turned to us are black.”
Any relevance to the issue at hand is left as an exercise for the reader.
Tamino
Sorry I can’t see how by proving that a processing step does not remove local high amplitude signal, you also prove that the more obvious problem of natural smoothing, that actually occurs within the stratified sediments, is no longer an issue also. There are near surface diagenetic processes that smooth the temporal geochemical signal. These are more marked in older parts of core than younger core.
Another observation, perhaps not so important:
The other thing to note is that your “spikes” where added as isolated peaks.By analogy, what are the conditional probabilities for moving from different climate states using other – higher resolution – palaeodata with less natural smoothing:
e.g.:
simple process:
0->1
1->0
0->0
1->1
Where 0 denotes non-extreme and 1 extreme (isolated peak or trough) using residual data after removing for variable trend. In short how likely is your synthetic case.
CD
“Sorry I can’t see how by proving that a processing step does not remove local high amplitude signal, you also prove that the more obvious problem of natural smoothing, that actually occurs within the stratified sediments, is no longer an issue also.”
Rather than just some armwaving, why not outline how this affects the use of the sediments as a proxy? Have you explored the physics and geology of how these sediments have been accepted as proxies.
As a side note, I think what Tamino has done is assumed these proxies can be used as proxies, because many people have used them as such. Their ‘quality’ as proxies wasn’t part of the disucssion – he was exploring if large, fast temperature excursions recorded by the proxies would be seen in the early part of the reconstruction.
Rather than just some armwaving, why not outline how this affects the use of the sediments as a proxy?
I thought I did.
Click to access Sachs-Alkenones_as_Paleoceanographic_Proxies-G300.pdf
I think what Tamino has done is assumed these proxies can be used as proxies, because many people have used them as such.
I never said they couldn’t. I just said that, with all the best will in the world, proving that you can manufacture something in a proxy data set proves nothing about the validity of the reconstruction in capturing such a features – and therefore its absents in the reconstruction proves it didn’t happen. Which is what is being attempted here – smoke and mirrors.
Their ‘quality’ as proxies wasn’t part of the disucssion – he was exploring if large,
Then…
fast temperature excursions recorded by the proxies would be seen in the early part of the reconstruction.
So which is it, is it about the proxies or not?
BTW I never said the proxies couldn’t be used for reconstruction just that there is a geological process that smooths the geochemical signal – post processing can’t change that.
“The other thing to note is that your “spikes” where added as isolated peaks.”
Isolated peaks like current warming.
Think about this.
Thing about spikes is that they are temporary and since there has been no statistically significant warming (Met Office) for the last 17 years perhaps you make a good point.
[Response: You don’t help your credibility with this foolish comment. Let’s avoid the ridiculous, shall we?]
I have not read through all of the above comments, but would point out that what Tamino has shown here is that the *data reduction process* does not in and of itslef remove the high frequency spikes. however, the *proxy formation process* does and is the relevant aspect of analysis.
JPS
So, show us how you discovered that the sediment formation removes high frequency spikes. No arm waving though…
besides the authors themselves giving a figure of 300 yrs (if my memory serves), a simple internet search indicates deep ocean sediment- 1000 to 5000 yrs, coastal sediment – 100 to 1000 yrs, lake sediment 10 – 100 yrs. so, while it is possible some lake samples could see this high frequency certainly the average of all of these would (could) not. what would be interesting is to extract just the lake samples and see what they look like.
in doing a bit more research i found the actual values the researchers used here
Click to access Marcott.SM.pdf
there is a single value for an ice core at 20 yr resolution, a handful under 100 yrs, but a majority are well over 100 yrs (200-500)
JPS – Minimum of 20 years (2 proxies), maximum of 530 years (1 proxy), and a median proxy sampling of 120 years. That means >50% of the 73 proxies with sampling resolutions of 120 or fewer years, and in fact 16 proxies with resolutions under 75 years.
Off the top of my head a median sampling of 120 years, assuming a box-average over the sampling period, means that a 200 year spike signal will be attenuated by just over 50%. Longer periods will blur it more, shorter less, but a 120 year box filter collection will result in just over 50% attenuation.
Looking at Tamino’s first single run plot, with the 0.9 C spike resulting in roughly 0.4 C as an averaged realization (as expected), I would have to say he’s doing things correctly. Your claim that proxy formation would remove this kind of signal is in error.
-KR please forgive my ignorance of your calculations, but I must ask how can simply the median resolution of the data set determine the attenuation? for example, if there were 101 proxies, 50 of them had a resolution of 119 yrs, 50 had a resolution of 5000 yrs, and 1 was 120, surely that would change the result? i assume it comes out of your box-average assumption but i am not sure what that means
For simplicity, let’s assume a set of a number of 100-year averages (box filters) of the proxy data, with various offsets, looking at a 200-year spike.
If the sampling split for a particular proxy hit the peak, each of the neighboring 100-year averages would be 1/2 the peak value above the long term averages. If a split bracketed (+/- 50 years) the peak, that point would be 3/4 the peak value with neighboring proxy points of 1/4 the value. Average a number of offset 100 year proxies, and you get a value at the peak point of somewhere above 1/2 of the peak, as no particular proxy has a nearby value less then 1/2 the original peak. .
120 years will give slightly lower values (including a bit more of the backgorund) – a mix of proxy sample spacings as seen in Marcott will include some (1/2 of the proxies, as per the median 120 year value) that reinforce/increase that blurred peak, with central values > 1/2, and some (longer than 200 years) that are lower than 1/2 the peak and decrease it. Any sampling less than 200 years will have a nearby supporting value > 1/2 the peak value.
Date uncertainties will drop that value, in a manner dependent on how uncertain the dates are, but you are starting from a non-shifted proxy reconstruction at or above 1/2 the peak value. So 40% or so of the original 0.9 C peak is entirely reasonable with 120 year median sampling. The only way the reconstructed peak would be significantly lower is if date uncertainties were >> 200 years (with most perturbations not reinforcing), or if the majority of proxies were sampling at considerably > 100 years; neither of which is (as far as I can see) the case here.
The median value means that 1/2 or more of the proxies will reproduce a spike at just under 1/2 its original value – with some increasing it, some decreasing. The median is very important in this case.
Now, if you want to run the data yourself (I recommend R for these purposes) and can show that date uncertainties blur the spike above what Tamino has shown, please do so and show your results. But his data seems quite reasonable to me, given sampling intervals.
Your assumption of a group of proxies at 119 and a group at 5000 is not supported by the actual proxy data, which show a spread only slightly shifted to a longer tail. [ Median 120, Mean 156, whereas your rather extreme example has Median 120, Mean 2600 – not the same situation at all ].
If you disagree with the analysis, you’re going to have to show it with something other than absurd/extreme examples that have little or nothing in common with the Marcott data.
-KR no need to get defensive. I was merely trying to illustrate that more information than the median alone is needed to make a proper analysis, a point which i inferred (perhaps falsely) from your prior post. in any case i will work with your other post that explains your methodology and see what i come up with.
Tamino,
can I ask about the actual way you have “put the spikes in” into the proxy data? Judging from the small scale figures I assume these are sort of triangular-like peaks with width of 200 years and height of 0.5 -0.6K.
How many data points per peak did you introduce?
What I am worried in your analysis, is that an introduction of a definite, narrow peak means very strong autocorrelation of the data (on the scale of 200 years, which is the resolution of the core samples!). Thus I am not surprised that the peaks survived randomization – especially a Gaussian one.
PAber
It looks like you are right that RomanM has incorrectly treated 95% confidence intervals as standard error. Need to look more closely for sure.
faustusnotes, yes I think you have the correct expression for calculating variance from independent variables. The only slight complication in this case is that I’m pretty sure that you can’t consider ‘a’ and ‘b’ to be independent. For example, I think you’ll find that given a fixed value of ‘a’ that this will impact the uncertainty of ‘b’ in your regression model. Remember that the uncertainties in ‘a’ and ‘b’ directly specify our ability to predict ‘a’ and ‘b’.
RomanM inverted the expression to predict Pert(T) from UK37. He then simplified the problem by considering the slope error to be negligably small. Without making that assumption the problem is obviously more complicated (and actually more complicated than what you’ve suggested here). You might be able to make a case for why neglecting the uncertainty in ‘b’ would significantly alter the prediction interval of Pert(T), but just looking at the numbers it seems that it does not and in fact that neglecting the dependence of ‘a’ and ‘b’ would introduce a bigger error.
It seems to me that RomanM reading the +/- uncertainties for Alkenone proxies as 1 sigma was not an obvious error given that immediately before that in the supplement equations of the same form for Mg/Ca had uncertainties expressed as 1 sigma.
As he pointed out, knowing that coefficient uncertainties are actually more like 2sigma actually just means that Marcott may have underestimated the uncertainty in temperature values to an even larger degree (if their methodology actually follows what is expressed in the Supplement). If in fact Marcott has not included the much more significant Epsilon term, then would you not agree that they might need to revise their findings?
“It seems to me that RomanM reading the +/- uncertainties for Alkenone proxies as 1 sigma was not an obvious error…”
It doesn’t matter if the error is obvious or not. What the McI crowd has made obvious for a couple of decades is that they don’t care if they’re wrong or not. Obvious or not doesn’t matter.
They must do their best to destroy the reputations of anyone who publishes on climate science who doesn’t adhere to the notion that increasing CO2 doesn’t cause warming.
That’s the audit goal.
They ignore the horribly horrific papers on “their side”.
Are you learning something here?
[I can’t “reply” directlyto the 10:45 Faustus comment so I will put my comment here]
Yes, I did indeed overlook the fact that the +/- values for the slope coefficients in Müller were for 95% confidence intervals rather than the standard errors themselves. Before accessing the Müller paper, I had first read the description in the Marcott SM where all of the other +/ values were standard errors, so I was somewhat negligent in not verifying their meaning when I read the Müller derivations. I will indeed correct this crucial misinformation in the CA post later today. I should also berate the readers for not purchasing their own copies of the paywalled Müller paper so that they could immediately correct any such failures on my part in the future. And what are all these other numbers, “every” one of which I am wrong about?
You also seem to have missed the point of my reference to prediction intervals. The Marcott perturbation methodology varies the values of the slope and intercept independently (you do know the estimates of the slope and the intercept in Müller’s regression are negatively correlated) and ignores the uncertainty effect of the epsilon (which I have termed E in my post). My point was that, assuming the correctness of my view of the major point involved here, all three of these sources might be properly accounted for by a single perturbation variable whose standard deviation is calulated from the formula for the prediction interval.
You mentioned earlier that you were going to do some simulations to look at the questions raised about the MC approach. Actuallly, I don’t think that this is necessary. Let’s look at it in a hypothetical situation.
Assumptions:
Calculations (as done in Marcott):
Do you see a problem with the error bars calculated from the sequence of standard deviations?
Roman,
It really would help if you would simply say what you think is wrong and why, with even perhaps some explanation, instead of just a sequence of questions.
It seems your key issue is the last – that you think they got their standard deviations just from the 1000 MC groups, rather than including the between proxy variation from the previous step. What they said isn’t as clearcut as your version here, but it is a possible reading. And if so, yes, their uncertainty would be much understated.
But a much more natural mathematical reading is that the sd includes the total variation of the 73000 data points (for each age point in the recon) that they averaged over this step and the previous. That captures between proxy variability.
I cited the example of Loehle and McCulloch’s less ambitious but rather similar study. This was much discussed at Climate Audit before submission, and sent off with applause. In it, similar proxy values are converted using published regression formulae, and the between proxy variability of temperature is made the measure of uncertainty. No extra term such as you propose was used, and certainly not one derived from the regressions of the original formula creators.
Marcott et al add another stage of Monte Carlo accounting for age model and temperature formula uncertainty. I can see no reason why that step alone requires them to take in a whole new level of uncertainty which seems to double up on what they already have.
dhogaza, there are a couple of problems with what you said there.
1) In all of the posts that I’ve seen at CA I’ve never seen one that suggests increased CO2 doesn’t cause warming. That’s a straw-man argument on your part. In almost all cases posts are about discussing what they argue are flaws in statistical methods of climate scientists or are about discussing difficulties trying to get some scientists to disclose data and/or methodologies.
2) The error that RomanM made with regard to 95%CI vs SD actually has the impact of understating the point that he was making. I don’t see how this fits your characterization of CA being tolerant of errors so long as they dispute the claims of climate science. On the contrary we see that RomanM’s interpretation of the coefficient uncertainties was not influenced by a desire to overstate the flaws in Marcott.
There is a problem with your analysis. You seem to think that the original data stays as it originally was over time, it just get perturbed by random noise. This is not entirely true. For example, for ice a diffusion process occurs (I don’t know it such proxies were used, anyway, all proxies have issues). This would spread out your added peaks and make them smaller. It’s not like adding peaks and then noise to the measurements, but it’s like adding peaks to the proxies, then let them evolve in time. They degrade, and they do not degrade nicely. There isn’t only random noise added, but a ‘filtering’ due of an ‘averaging’ (and the possible superimposed noise, too) with the nearby layers due diffusion, evolution towards equilibrium. And.. no matter what calculations you do, you cannot get data that isn’t there anymore (actually, you can, but it would be numerology, not science).
At the extreme, if you have ice layers all showing -15C, with only two ‘peaks’ of -20C and -10C, with enough time passed – leaving all complications aside – you’ll end up with ice showing -15C everywhere, and no ‘peaks’ will be visible. But, depending on when you measure, you might have smaller but spread out peaks. Now, considering this simple case, one might tend to think that he could infer the evolution in time and calculate the original values. This is not true for a complicated case, from the same reason why we have the 2nd law of thermodynamics.
faustusnotes, I’m not going to bicker with you about the ‘every number is wrong’ point. Yes, he made an error at the very beginning interpreting the correct meaning of the uncertainty values that translated into the rest of his numbers throughout the analysis. Was this a careless mistake? Maybe, but it’s understandable too because the supplement actually isnt clear – even you remain uncertain of whether Marcott made the same error.
It doesn’t appear that he used the wrong equation for determining the variance. Like I said he simplified the variance calculation by disregarding the small uncertainty in the slope coefficient; and stated clearly that he did so in his analysis. In actual fact the equation that you proposed using is wrong equation because the variance in ‘a’ and ‘b’ coefficients are not independent.
Let me explain why I think Epsilon is not automatically taken into account in the data. Imagine that you have only one proxy that for whatever reason you justify can be representative of global temperature. That proxy has the same sources of error as the proxies we are discussing. Now you know that the UK37 readings when converted into temperatures have an estimated uncertainty and there is uncertainty in aging. So you perform the same procedure that Marcott did by perturbing the proxy values according to time uncertainty and temperature uncertainties.
You then take the 1000 perturbation sets and from them estimate the uncertainty in your model reconstruction.
Note that if you disregard epsilon as a source of error when calculating T from UK37 that it does not get factored into your assessment of model uncertainty at any point in this analysis.
As far as I know that is incorrect. Do you agree?
Mike,
I think the key issue is how you read the calculation of that final sd. They actually average a total of 73000 numbers to get each age value for the recon. They describe it as two separate steps, done sequentially. It would be mathematically logical to use the standard deviation of the whole set. They don’t say explicitly that they did, but I don’t think what they said clearly says that they didn’t.
Of course, someone could ask them…
Surely you jest (with jousters), Kevin.
Faaaar more fun to speculate until Sheryl Crow comes home than to ask (or even read).
The RomanMperor is a roman and the RomanM pyres are burning brightly
I agree with you that this is the key issue. I comes down to the details of what specifically they are doing to estimate the uncertainty. They do average the 73000 numbers, but it doesn’t seem that they are not measuring the standard deviation across those 73000 numbers. Rather they come up with 1000 sets (each set containing a perturbed value of the 73 proxies). They average each of those 1000 sets to obtain what is basically 1000 global temperatures, and then they obtain the average and standard deviation across those 1000 sets.
The problem is that I don’t think it would be correct to take the standard deviation across the 73 proxies (ie. standard deviation of all 73000 numbers) due to the fact that the proxies are from different geographic locations – there is an expectation that variation at different geographic locations would not be equal when there is global variation- so you’d be including variation of the different locations in an estimate of global temperature uncertainty. This would be wrong I think, and based on their description of analysis I don’t think that they actually did that. That’s why I think they need to include the epsilon uncertainty when perturbing the individual temperature values. Then they can follow the same methodology of measuring the standard deviation across those 1000 global temp values and this would include all the actual uncertainty (and would not be applying epsilon twice).
Nick, my comment at April 10, 2013 at 1:07 pm was meant as a reply to your comment here.
I was going to say that even if my interpretation is correct I still think it might be difficult to know whether or not we add too much additional variance by including the epsilon value at full magnitude. It comes down to the actual response of the proxies and interpreting the source of variation in Muller’s results. I don’t have that report so I don’t know much. For example, would any given proxy at given location/historical circumstance give us a spread of UK37, T values similar to his result, or is a significant amount of variation across different proxies/geography/etc? Is the uncertainty associated with our manner of obtaining and analyzing the sample?
We know for example that in many cases a UK37 value at a particular point in time might actually manifest as an average of a longer time span. If most of epsilon is sort of a random error over a relatively short timespan and can be expected to appear in a single proxy then a UK37 value might actually by averaging out some of the variation, and you would never expect to see epsilon variance in entirety depending on the age you are measuring – so in that case I can see it would be wrong to perturb that reconstruction by epsilon because you would never see an actual sample with that much variance. However, if much of that variance (reported by Muller) is across proxies, then we interpret the low variance of an individual proxy in a completely different way.
Mike,
I have now done a Marcott emulation in the style of Loehle and McCulloch 2008 here. I have calculated the confidence intervals in the same way as L&M – ie as standard error of the weighted mean across proxies. I do not do the Monte Carlo, and so there is a lot less smoothing. My CI’s are quite comparable – narrower in the central region, and broader back beyond about 7000BP.
As a result I am convinced that they have included between proxy variation in steps 5-6 of their stack reduction, and that there is no major omission in their CI calculation. I have included the R code in the post.
For example, if you look back at the temperature around the time of 4000 BP you might have error bars of +/-0.5C at 95% CI (based on Muller’s coefficient uncertainties). However this estimated value was never considered anything more than a slightly perturbed version that happened to have been obtained by that proxy at that point in time. You never took into account that the value could very well have been +/- 3C from the fit of the regression line.
“… Some lakes, especially deep lakes that contain little or no life-sustaining oxygen, can record annual records of climate in their sediments. The lack of oxygen in such lakes diminishes or eliminates the disturbance of the upper layers of sediment by worms and other burrowing animals. Paired layers of sediments, called “varves”, are laid down in alternating light and dark layers reflecting seasonal differences in runoff sediment composition (light-hued mineral-rich sediments versus darker sediments rich in organic materials). These “varved” lake sediments provide a continuous climate proxy record with an annual resolution….”
http://eo.ucar.edu/staff/rrussell/climate/paleoclimate/sediment_proxy_records.html
There are too many comments for me to read them all now, and I therefore apologize if I repeat a question previously raised.
Unfortunately, I don’t find your analysis entirely satisfying (I am not a scientist and don’t claim expertise) because it shows exactly what I would naively expect to see. It seems to me that if we integrated one of your introduced artificial short-term signals, then we would get something like a step function (maybe exactly a step function if the 200-year signal period were reduced to zero). I therefore wonder what the result would look like if the artificial signal had a value of zero when integrated over the signal period (my curiosity comes from thinking about signal curves somewhat similar to the dV/dt curve in subfigure d at http://www.nature.com/nrn/journal/v8/n6/images/nrn2148-f1.jpg.
Frankly, I would be very (VERY) surprised if the actual future temperature record would show a rapid drop to a negative “anomaly” with a subsequent return to the “normal” temperature. But I think an analysis (1) using an artificial signal with such a strange normal-hotter-colder-normal pattern and (2) changing the signal parameters (time period and maximum increase) in order to find the limit parameter values of an undetectable short-term signal would be quite convincing. I just don’t have access to resources that would allow me to do such an analysis myself. Sorry.
“Fiddles and Lyers”
— by Horatio Algeranon
Fiddles and Lyers
And RomanM pyres
The hero Nero
Still inspires.
But the fiddle fiddling
And lyer lying
Prohibit progress
No denying.
> I’ve never seen one
You can search, you know, rather than just wait and see:
https://www.google.com/search?q=site%3Aclimateaudit.org+“CO2+causes+warming” is not an exaustive search, just one example of how to look.
> I’ve never seen one that suggests increased CO2 doesn’t cause warming
Amazing. Do you think CO2 causes warming? Said so there?
Tamino – I have run a Marcott frequency gain filter on a 200 year 0.9 C spike, with interesting results (http://www.skepticalscience.com/news.php?n=1951&p=2#93527). I see a 0.3 C 600 year resulting spike given that transfer function, albeit with no phase shifts (as I would have to digitize their graph for that). This is consistent with the 0.2 C spike result you have shown, given my interpretation of the phase shifts shown in the Marcott et al supplemental data.
I would be interested in your comments, if possible.