
In truly fascinating new reasearch, scientists have searched historical records to collect data about when the grape harvest began each year. Their research wasn’t published in the Journal of French Wine (I don’t know if there even is one), it was published in the journal Climate of the Past. That’s because the date when the grape harvest begins is a clue to temperature.
The importance of clues like this is that they extend farther back in time than thermometer records. The grape harvest dates (GHD) start in the year 1354 — centuries before the thermometer was even invented. Also quite important: they are all for the same location: Beaune, France.
When the temperature is hotter, the grapes are ready to harvest earlier. When it’s colder, they harvest later. If climate is really heating up, the grape harvest should be getting earlier. And what did they find? This:
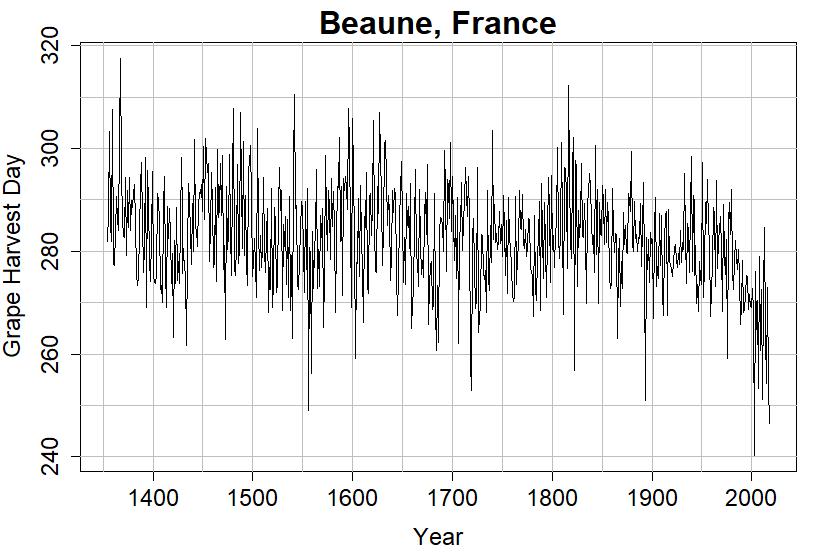
There’s no doubt about it: since about 1980, the grape harvest has been getting earlier in Beaune, France. I don’t say so simply based on “eyeballing” the graph — I’ve run the numbers, done the statistical tests, and there is no doubt about it.
Visually, the change seems to start right around 1980, so I used changepoint analysis to estimate when it really started to heat up (when the grape harvest really started getting earlier). It suggests that it actually began around the year 1978:
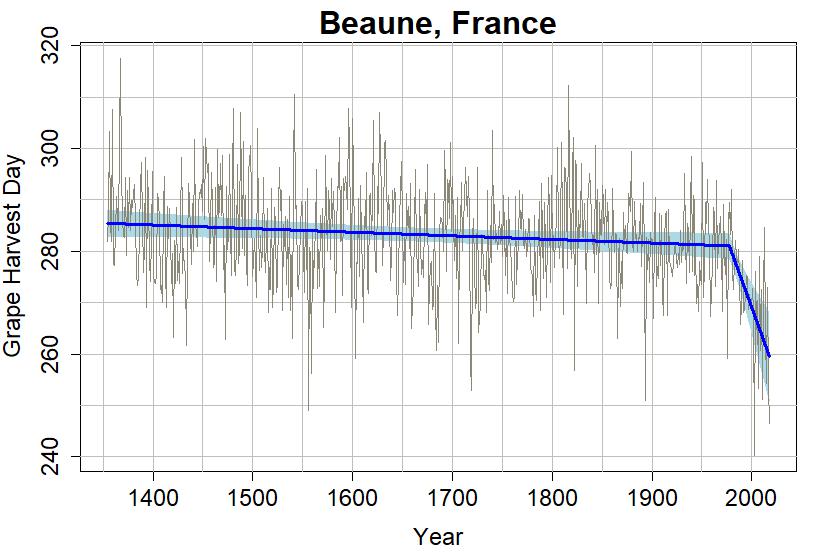
Before 1978, the harvest was getting earlier by about -0.007 +/- 0.007 d/yr (days per year. That means the real rate is most likely between -0.014 d/yr and 0 d/yr. It certainly wasn’t changing much, if at all.
But since 1978, the trend is a whopping -0.53 +/- 0.23 d/yr. It’s definitely trending earlier, and at a half day a year, since 1978 it has gotten earlier by about 20 days. Here’s a close-up on the data since the year 1800:
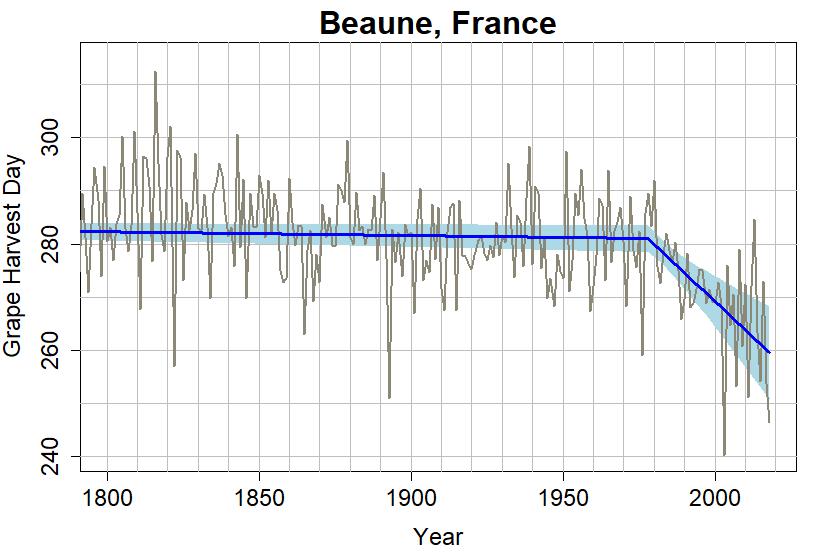
Interestingly, the earliest GHD (Grape Harvest Day) in Beaune, France was in the year 2003 when France suffered through its worst heat wave ever.
I can also estimate the trend with a smoothing function, and regular readers know I’m fond of the lowess smooth (but different methods give essentially the same result):
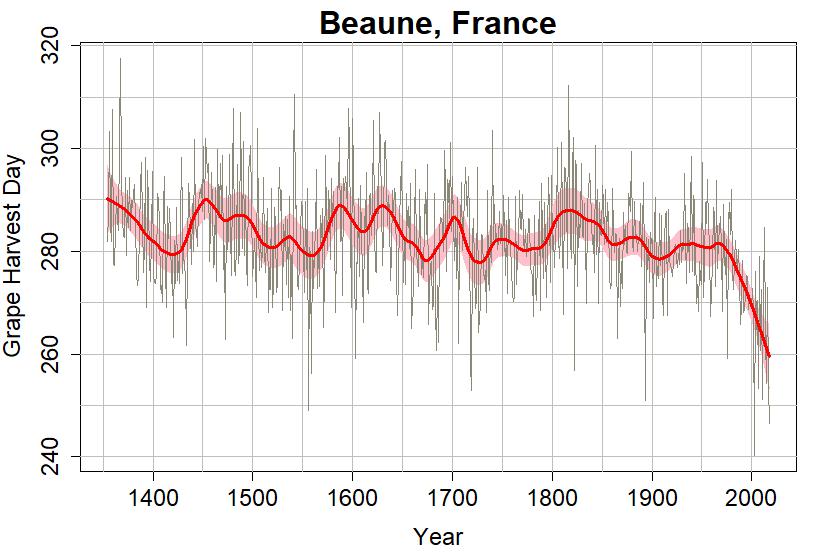
It fluctuated before 1978 — real data does that — but since 1978 it has been declining precipitously. This is not natural. It’s because of man-made climate change.
We can get an “image” of how this indicates temperature has changed throughout the years, simply by turning the graph upside down:
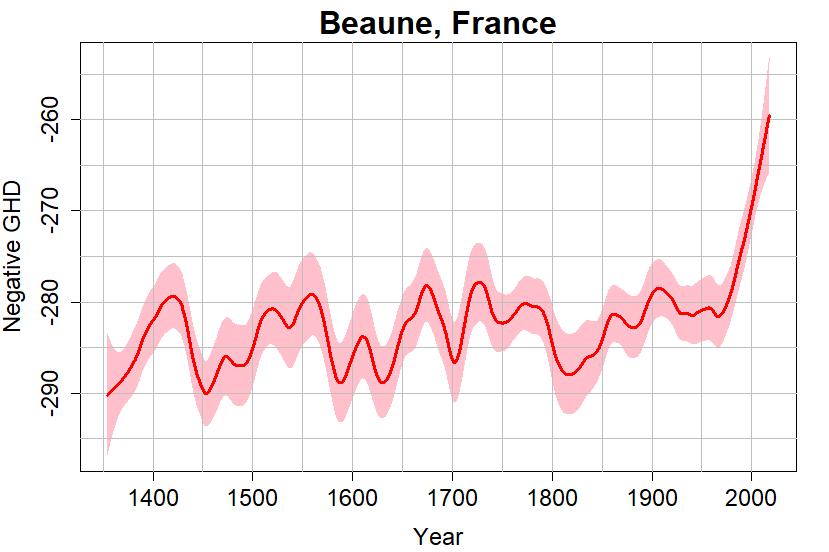
That is one steep rise since 1978. Just as obvious as the recent steep rise, is the lack of such things in the previous 600 years. This is not natural. It’s man-made climate change. Does the shape of this graph remind you of anything? Maybe … something like … a hockey stick?
Whenever new evidence of climate change emerges, climate deniers try to dispute it by any means necessary. They especially hate anything that looks like a hockey stick because it shows so clearly how what’s happening today is not like what we’ve seen before. It’s not natural. Perhaps they’ll claim that French wine-grapes are communists who want to destroy our freedom and impose world government.
I’m looking forward to seeing their response. This is such a wonderful opportunity for them to embarrass themselves! I’m sure they’re up to the task.
This blog is made possible by readers like you; join others by donating at My Wee Dragon.


Terrific observation, a useful point of view. Don’t know if you saw this, but it is a sad observation on our increasing inability to get reality front and center with the anti-realists: Twenty-five years before Greta, there was Severn and we ignored her https://www.irishtimes.com/opinion/twenty-five-years-before-greta-there-was-severn-and-we-ignored-her-1.4022656
Interesting, particularly since the cultivation of grapes for wine was a basis used by Lamb to justify his estimate of temperatures during the “Medieval Warm Period” Many sceptics will now be in the difficult position of arguing that the geographic spread of wine grapes is important, but the date of harvest is not.
Looks pretty convincing. However, if the MWP was about as warm as today, should it not also have shown a dip like this hockey stick? And shouldn’t the Little Ice Age show more of a bump?
Except at the MWP predates the data. The LIA was not really a contiguous period. It might be interesting to correlate the negative delta t with sunspot activity, to see if one can make out grand solar minima.
May I respectfully ask you, Tamino, to refrain from the toxic phrase “hockey stick”? I think Golf Club seems far more appropriate in the current… uh… climate. ;-)
This does not bode well for the future of Pinot Noir. Even the lower end Burgundies are expensive enough as it is now. Drowning my climate sorrows with flabbly california Merlots isn’t quite the same… :-(
Aside: I recall fondly my days when a trip to Beaune was a 90 minute drive on back roads of France….
(I’m re-posting this here having managed to post it in the wrong thread earlier, re-posted now with a few additions.)
The other phenological data available over impressive time-spans is the Kyoto peak cherry-blossom dates which kicked-off in AD 812 and, initially with big gaps (there are only 14 data points 812-900), it builds into an impressive archive. The individual dates range from the last week in March into early May, with average results spanning 10th-17th April. The last late peak in this ‘average’ was back in 1840 and since then the ‘average’ has become earlier, and arriving before 10th April for the first time in twelve centuries by about 1960, since which the ‘average’ has continued to arrive earlier, as of 2016 ‘averaged’ arriving about 5th April.
And to add that the Kyoto temperature record back to 1881 is available at BEST show a good correlation between March temperature and timing of the Cherry Blossom for data 1881-2013. Temp = +15.31ºC – 0.1865D where D = Day of Cherry Blossom after end of Feb with the 1sd CI = 0.0135D. A more serious analysis is presented by Aono & Kazui (2008) ‘Phenological data series of cherry tree flowering in Kyoto, Japan, and its application to reconstruction of spring-time temperatures since the 9th century’.
Finally, for completeness we should not to miss out the screams of “Fraud” from the swivel-eyed denialist community. Apparently the correlation is not a problem. It is the cause of the recent warming they dispute which apparently is due to a local Urban Heat Island. But if they don’t dispute the size of the warming, the Cherry Blossom data surely still show that, whatever the cause, recent warming is far far larger than the Kyoto spring-time temperature variation in previous centuries.
1980 seems to be THE year for physical evidence catching up with the earliest AGW predictions. I’ve seen lots of conjectures about why that was so. One theory — the effects of the Clean Air Act had finally removed enough industrial aerosols for temps to rebound — seems plausible, but I’ve never read a discussion of the phenomenon that seemed authoritative.
[Response: There’s good evidence that aerosol pollution was a big factor up to about 1975. This comes from both estimates of aerosol emissions, and from direct measurements of sulfate concentrations in ice cores. We know for a fact that sulfate aerosols cool the climate. So I consider the conjecture to be well founded. By the way, we didn’t really remove aerosols from the atmosphere, we just stopped increasing the *amount* we emit, and man-made aerosol pollution is short-lived (unlike CO2) so if you stop increasing it, you can hold its cooling influence steady.
Some are worried that if we actually stop aerosol emissions, the atmospheric concentration will actually decrease and that will raise global temperature about 0.5 °C. Others have pointed out that if we stop sulfate emissions it’ll be because we’re halting industrial processes that also emit CO2 so that will offset most of the warming from aerosol removal. Take a look at this.]
There is no doubt that the temperature has risen by roughly 1C since 1800. However the grape harvest date also fell (by eye) ~10 days from 1350 to 1900 implying a rise of roughly 0.5C. Why?