
I read Shakespeare and the Bible, and I can shoot dice. That’s what I call a liberal education.
— Tallulah Bankhead
People have been playing with dice for at least 5,000 years. They come in all shapes and sizes, but have a common purpose: to generate randomness. When dice are rolled (or “thrown” or “cast” or “tossed” or “shot,” depending on your verb of choice) many results are possible, but what actually happens isn’t known until it happens. Dice (or one die, to use the singular) are the world’s original random-number generator. We may not know what they’ll give but at least we can figure out what to expect.
If they’re fair, that is.
The most common form is the six-sided die, a cube with dots on it, a different number for each face, ranging from 1 to 6. They’re often rolled in pairs (as in the gambling game craps), but sometimes singly or in groups of five (Yahtzee!) or more. If you roll a single 6-sided die (what gamers call a “d6”), ideally the probability for each possible result will follow the uniform distribution, meaning simply that all possible results are equally likely.
If you’re shooting craps and roll two dice, then add up the numbers on both, not all results are equally likely (as Tallulah Bankhead well knew). You have a 1-out-of-6 chance of “lucky 7,” but only a 1-out-of-36 chance of rolling a 2 (“snake-eyes”) or a 12 (“boxcars”).
Mathematicians easily calculate the chance for each possible result (again, assuming the dice are fair), and can also compute “summary statistics” which encode what we expect more compactly. One of the most important such quantities is called the mean, also known as the expected value. If you roll a die many times — many many times — theoretically at least an infinite number of times, then compute the average of all those results, the mean value for a single die is 3.5. You can’t actually get the mean value for a single roll; there’s no “3.5” face. But the average of a large number of rolls will be close to 3.5, and the more you roll the closer it will get. If, of course, the die is fair.
As with all random events, results may vary. In fact, results will vary (or it wouldn’t be random). By how much? That is often summarized with a statistic called the variance. If you subtract the mean from each result, you’ll know the deviation for each. If you then compute the average squared deviation, you’ll have estimated the variance. [It’s a wee bit more complex, because often, instead of adding up the squared deviations and dividing by how many there are, we divide by one less than how many there are.] It can also be called the “mean square deviation.” But it’s more customary to take the square root of the variance, giving a quantity called the standard deviation (a.k.a. root-mean-square deviation).
Those two quantities, mean and standard deviation, are the most basic and most common summary statistics for a random process like rolling dice. There are plenty of other choices, and we need more than just two quantities if we want to specify things completely, but they’re actually quite a useful characterization. For rolling a single die, the mean is 3.5 and the standard deviation is 1.707825. If, and only if, the die is fair.
We’ve already mentioned that a pair of dice gives a number for which not all results are equally likely, i.e. it no longer follows the uniform distribution. Here’s the probability of each possible result of a pair of dice; the minimum is 2 (a “1” on each die), the maximum is 12 (a “6” on each die), but the most likely result — which also happens to equal the mean — is lucky 7.

If we roll 5 dice the probabilities are different still:
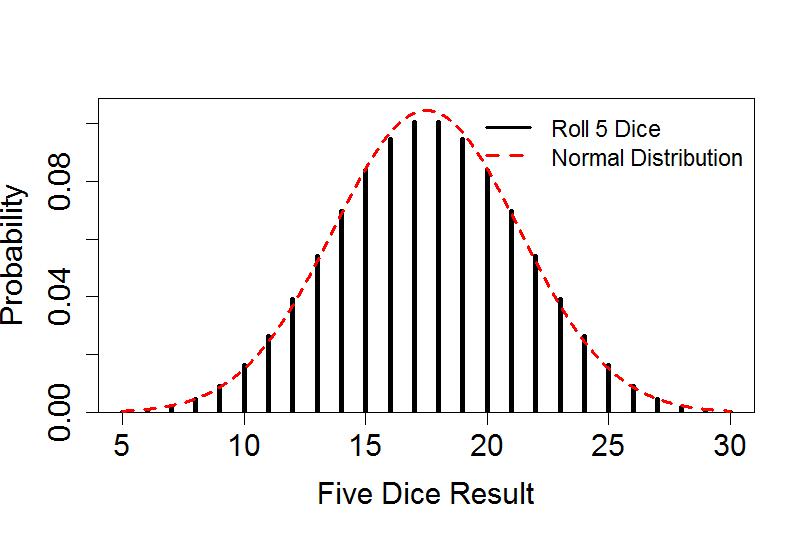
Also shown (as a dashed red line) is what statisticians call the normal distribution, the classic “bell curve” shape you may have seen before, quite often. This particular normal distribution has the same mean value and the same standard deviation as the roll of five dice. Note that the probabilities for a five-dice roll tend to follow that normal distribution quite well; not perfectly, but the match is excellent.
And that’s no accident. If we roll 100 dice and add them up, the the probabilities for each possible result (from 100 to 600) will match the normal distribution, not just “quite well” but stunningly so.
This means we can use dice as a random-number generator which will, at least approximately, follow the normal distribution. That particular distribution is uncannily common in nature; few natural phenomena follow it exactly, but so many follow it approximately that it’s downright spooky. [Until you find out why, one of the deepest and most beautiful theorems in statistics, but that is another topic entirely.]
The Weather Game
Let’s invent a game we’ll call weather. We’ll roll 12 dice — one for each month of the year — and add them up, the result indicating what the weather was like for that year. The mean value for rolling 12 dice is 42 (if they’re fair, that is), which will represent weather so good we have a great year; for a 42 we’ll award ourselves 6 points. If we’re one off, with a 41 or 43, we only get 5 points, two off we get 4 points, etc., all the way to five off (37 or 47) which is only one point. Those are the “good weather year” results.
If we’re off (from the 42 average) by anywhere from 6 to 12 (if we roll between 30 and 36, or between 48 and 54) then we’ll say the weather is just “OK” so we don’t gain any points, but we don’t lose any either.
But if our roll is too extreme, 29 and below or 55 and above, we’re in the bad region and we lose points. We’ll pretend it’s extreme weather such as brings flood, hurricane, tornado, killer heat wave, drought, all spelling trouble. The least extreme bad rolls cost only one point. But, as is the case with trouble, as it gets more severe the damage rises rapidly, so we’ll square the amount into the bad region to get the point loss. The most we can be is 18 (on either the high or low end), so if we roll a 72 (“6” on all 12 dice) or 12 (“1” on all 12 dice) we’re penalized 324 points.
It may seem like a losing proposition to have the maximum reward for any one year be only 6, while the maximum loss is 324; we would need 54 years of best possible weather to make up for a single year of worst possible weather. Isn’t that just a recipe for misery? Not at all, because despite the extreme cost of the worst possible weather, the chance of that happening is small. The probability of rolling either 12 or 72 on a dozen dice is merely 1 out of 1,088,391,168, less than one chance out of a billion. ‘Tain’t likely.
Here are the probabilities for each possible roll, and I’ve marked out the regions we’ve called “good,” “OK,” and “bad.” It’s plain to see that the good region has all the most-likely rolls and the bad region all the least likely. If, that is, the dice are fair.

I used my computer to roll the dice, ran it for 1,950 years, and got these rolls:

The biggest single-year gain was 6 points, which happened 144 times, while the biggest single-year loss was 49 points, but such disaster only struck once. The most common score (584 times, just about 30%), was 0 points for “OK” weather. The running score is shown here:

As you can see, it’s easy to win this game. Despite random ups and downs, over the long haul we gained an average of about 2 points per year. The game is rigged — for you to win.
Loaded Dice
It has been said that climate is what we expect, weather is what we get. Let me re-phrase that:
Climate is the rules of the game; weather is the roll of the dice.
There’s an unspoken rule of the game I made up: the dice have to be fair. What if we change that rule? It’s just as easy for my computer to simulate loaded dice as fair dice, so starting in 1951 I changed how the dice behave. I did so slowly at first, building up so they’re more and more loaded as time passes. By year 2000 they’re loaded noticeably, but not extremely; the year-2000 probabilities for a 12-dice roll are shown (in red, compared to the old probabilities in blue) here:

The probabilities are different, but the good rolls are still the most likely — just not as likely as they used to be. Bad ones are still the least likely, but more common than they used to be. That means we can expect to gain fewer points — on average — while losing more. But that’s the climate, the rules of the game, which now include progressively more loaded dice. The weather is still the roll, still random, so we know to expect less but we won’t know what happens until we roll the dice.
Running it for another 50 years, I got these results:

Most of those years the dice are so slightly loaded you could hardly tell. But look at the total score here:

We see we haven’t made much progress since year 1950. There have been fewer good years and more bad ones, and the bad ones have been a little bit worse, we even had one year where we lost 81 points.
That could have happened merely by chance, even with fair dice. But the new rules call for the dice to get more and more loaded.
By year 2025 we expect this:

Now the most likely rolls are for weather that’s just OK. Good years are a lot less likely, and bad years are quite a lot more likely. By year 2050 things have gotten really bad:

At that point, we’re considerably more likely to get bad years than good ones. Because the bad years are more destructive than the good years are constructive, it’s starting to look like a losing game.
Running the game out to the year 2100, loading the dice a bit more with each passing year, I got this:

By year 2100 we rarely get a year that’s even OK. The number of bad years is off the charts, and when troubles come they’re worse than we’ve seen before. Our running score was on the rise for 1,950 years. But in half a century our progress stopped, and in the century following we’ve been losing. Fast.

This doesn’t portray of the physics of climate change, but it does illustrate a few important things. One is that as we change climate, we’re changing the rules of the game. Our civilization has developed to make best use of the rules we’ve lived with for ten thousand years or so, but the changes to come, the changes we’ve seen already mean fewer good years, more bad ones. We’ll still see all types — the dice are still random — but the rolls are leaning in a way not in our favor.
Another is that the biggest change is in the likelihood of extreme values, the really bad weather years. As a result, when we move into dangerous territory things don’t get worse at a constant rate. Trouble starts small, then builds more and more momentum, and by the time change has gotten big we won’t just be headed for trouble, we’ll be doing so at breakneck speed. If we don’t stop loading the dice soon, we stand to lose in a lot less time than it took to win.
If you found this useful, join others who help support this blog by donating at Peaseblossom’s Closet.


Beauty, eh?
I like how in year 2000, or in any single-to-few years you can’t tell the difference between a fair dice and not.
If, instead of climate numbers, the statistics were about finance or gambling, the deniers would be a whole lot more skeptical of their null model.
My son’s middle school math class is just starting a project on climate change data; this is very timely.
[Response: Look for posts here with the tag “Global Warming Basics” and you might find more that’s useful to him.]
Nice. Thanks for another contribution to our ‘liberal education’
–including the wit and wisdom of the divine Miss Bankhead.
Brilliant!
Wow. Good one, Tamino. Very clear to readers such as myself with only elementary understanding of statistics.
Jim Hansen studied this and found that “Extremely Hot Summers” are occurring about 5000% more often than just 50 years ago…
http://climateplace.org/file/Summary.html
And he has updated his findings:
Click to access 20160120_Temperature2015.pdf
Well laid out.
101 question: Why is it better to use root-mean-square for standard deviation than simply the mean? I’d guess removing the negative values is helpful with this operation, but other than that I’m not sure.
[Response: Removing the negative values is essential. If you average the deviations you’ll always get *zero* because it’s the mean difference from the mean. Try it yourself (with some random data), you’ll see.
Alternatives include the mean *absolute value* of the deviation (abs.value also changes neg. to pos.), and the *median* absolute value of deviations. But there are other reasons to use root-mean-square … if you’re really interested you can buy my book.]
“The likelihood of recent record warmth”: http://www.nature.com/articles/srep19831
Clever.
Thank you.
This is great Tamino, I will share it. One question – does this analysis minimize outliers on the LEFT side of the distribution? Won’t we lose even more “climate points” in the real world due to extreme winter storms, Jennifer Francis-type polar circulation/jet stream waggles, etc. than show up in this loaded dice model? Or is the fact that your “loading of the dice” is not temperature but some vague “badness” mean that all outliers will be captured on one side of the distribution?
[Response: It’s a “general badness” indicator. What it’s really meant to show is that as the distribution changes, not only does the frequency of “good” go down, but the likelihood of “bad” (and especially *very* bad) goes up dramatically.]
One of the other deepest and most beautiful numerical phenomena in nature is the occurence of Fibonacci’s sequence, which has the most complex-appearing structure, but which can be arrived at by a fairly simple rule – “make the optimal use of space”. In biology this is easily mediated by cytokine gradients: the moment that I learned this was one where I was left silent and awe-struck by the sheer beauty inherent in the emergence arising from natural processes.
There’s a horrible beauty too in the numerical phenomena that characterise humanity’s alteration of our planet’s climate. The frustrating thing about our species’ (in)capacity to grok it is such that we seem to need to reach points of maximal slope on a sigmoid curve before we concede the need to act, when the lag inherent in our biospheric/abiotic systems is in its turn such that the points of action precede such points of inflection by a number of decades. As a consequence we’ve already past the last moment at which we could have the rip-cord to ensure a soft landing: we’re now left with the choice of landing with spained ankles, or multiple fratured bones and ruptured organs, or simple death. And even though science told us long ago to start yanking that ring for all we’re worth, we’re still just gab-festing about whether we’re going to deploy that ‘chute, or enjoy the wind rushing past our ears just a little longer…
There’s a point at which even the most optimistic and/or conservative of scientists needs to admit that we’re past the point of avoidance and heading well into damage reduction – if any possibility of such remains. I think mere spained ankles are now a pipe dream, and it’s a choice of fractured legs and mangled livers, and if we leave it much longer it’ll be just a matter of whether we close our eyes at the end or watch the final moments with full awareness of our failure to act.