
Given how rapidly global temperature was rising prior to 1998, what’s the most surprising thing about global temperature since 1998?
Most who call themselves “skeptics” of global warming would probably say “No global warming since 1998!” Under the name “hiatus” or “pause,” it features prominently in public discussion and even in senate testimony (e.g. from Judith Curry). In truth, such a “pause” or “hiatus” is not that surprising, neither from a statistical point of view nor based on climate model output. But there is one thing about post-1998 temperatures, compared to the pre-1998 temperatures, that is quite a surprise.
It has — quite rightly — been pointed out that surface air temperature (SAT) isn’t all there is to global climate or global warming. Since 1998 we’ve witness sizeable warming of the oceans, including the deep ocean. We’ve seen a staggering decline of Arctic sea ice and the continued dwindling of most of the world’s glaciers. Sea level has continued to rise at a rate much faster than the 20th-century average (which itself was much higher than the average over the last several thousand years). It has been emphasized that a lack of “statistically significant” warming is not the same as a lack of warming. It has also been pointed out that the “pause” in SAT is not inconsistent with climate model simulations, that in fact climate models show episodes like we’ve observed “since 1998” even in a still-warming world. And it has been shown (as climate scientists knew all along) that greenhouse gases aren’t the only factor influencing temperature, that “since 1998” we’ve seen the most prominent known non-greenhouse factors (el Nino southern oscillation, volcanic aerosols, and solar variations) conspire to lower global temperature. It’s obvious to those whose eyes are open that without continued greenhouse-gas warming to offset these natural factors, we would have seen a notable decline in global temperature “since 1998.”
But, let’s put all those perfectly valid considerations aside. Let’s ignore the oceans, the ice, the known natural factors, all of it, and look at nothing but global average air temperature (at the surface and in the lower troposphere).
Riddle me this: if we had been told by an unimpeachable source on January 1st, 1998 that there would be no statistically significant temperature increase over the period from the beginning of 1998 through the end of 2013, what would we have predicted? How would that compare to what has actually happened?
Let’s use temperature data starting in 1979 (so we can include satellite data for the lower troposphere) and ending with 1997 to predict what we would have expected over the next 16 years, then compare that to what happened. We’ll even make two predictions: 1) Based on continued warming; 2) based on certain knowledge that there would be no statistically significant warming from 1998 through 2013.
We’ll start with the HadCRUT4 data set from the Hadley Centre/Climate Research Unit in the U.K. Taking the data from 1979 through 1997, we’ll compute a linear regression line, then extrapolate that line through to 2013 to construct our “still-warming” prediction. We’ll also compute the standard deviation of the residuals from our linear regression so we can add two lines to the graph, one of which is two standard deviations above our forecast, the other two standard deviations below, in order to delineate the range in which we would expect most of the future data to be.
We’ll also take the final value of the linear regression line (not the slope) as our estimate of what we would expect if we had been given certain knowledge of no statistically significant warming from 1998 through 2013, and we’ll add extra lines, two standard deviations above and below, to mark out the expected range.
If all we know is data before 1998 then here is what these simple approaches predict (“still-warming” prediction in red, “no-warming” prediction in blue):

It’s clear that if we expected a pause, we would expect most of the following years’ temperatures to be below the red forecast line, but about half above and half below the blue forecast line. On the other hand, if we expected continued warming, we would expect most of the following years’ temperatures to be above the blue forecast line, but about half above and half below the red forecast line.
So … how did it turn out? Were subsequent years about half above and half below the red (warming) forecast, or the blue (no warming) forecast? The answer is: neither.
What actually happened is that, according to the HadCRUT4 data, most of the data are above both forecasts. Twelve of sixteen were hotter than expected even according to the still-warming prediction, and all sixteen were above the no-warming prediction:

When it comes to global temperature, the HadCRUT4 data set isn’t the only game in town. There’s also data from NCDC (the National Climate Data Center):

Once again, twelve of sixteen years were hotter than expected even according to the still-warming prediction, and all sixteen were above the no-warming prediction.
Well, how about the data from NASA GISS?

Using these data, thirteen of sixteen years were hotter than expected even according to the still-warming prediction, and all sixteen were above the no-warming prediction.
Maybe we should include the new data set from Cowtan & Way, which uses the best (in my opinion) method for estimating unobserved areas:
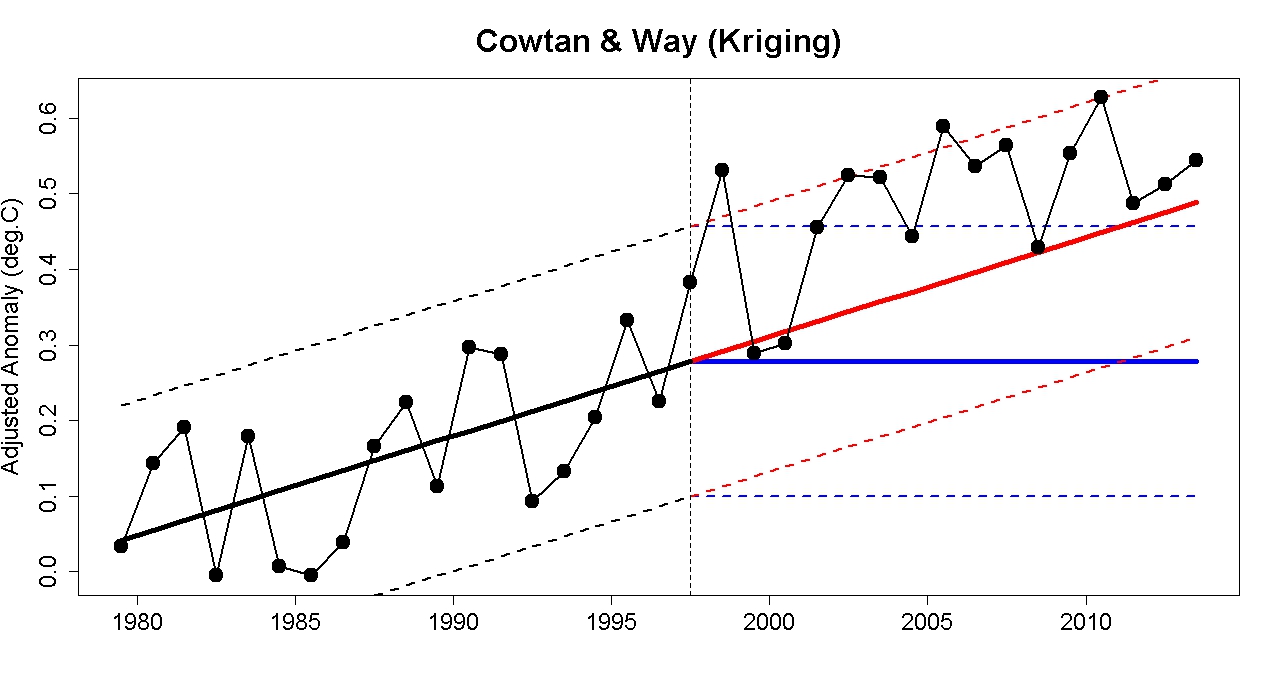
Now fourteen of sixteen years were hotter than expected even according to the still-warming prediction, and all sixteen were above the no-warming prediction.
Do the satellite data give a different result? Here’s what we get using the TLT (lower-troposphere) data from RSS (Remote Sensing Systems):

Once again, fourteen of sixteen years were hotter than expected even according to the still-warming prediction, and all sixteen were above the no-warming prediction (although one is just barely so).
Finally, here’s what we get using the TLT (lower-troposphere) data from UAH (Univ. of Alabama at Huntsville):

All sixteen years were hotter than expected even according to the still-warming prediction, so of course they also were above the no-warming prediction.
Given how fast global temperature was rising prior to 1998, the real surprise which followed is not that temperatures slowed or stopped their increase … the real surprise is that temperatures rose so far so fast and were so damn hot. Even allowing for the existing trend.
Does this mean we need to launch a massive research effort to divine the reason for this sudden and pronounced warming? No.
If we had chosen the 1998 boundary because we had been visited by an omniscient alien in January of 1998, then maybe we would. But I didn’t pick 1998 because of that. I picked it because so-called “skeptics” picked it, and they chose it because of the result it gives. Which makes it cherry picking.
That kind of cherry-picking requires a large compensation to statistical analysis, one which makes it clear that there’s no justification for a massive research project to investigate the post-1998 blazing heat. It also makes clear that there’s no justification for running off at the mouth about the so-called “pause.”
As for “skeptics” about global warming, I love ’em. I welcome their valuable, even essential contribution to the field. Unfortunately, most of those who call themselves skeptics, espcially those who blather on and on about the end of global warming while swallowing the most ludicrous ideas hook line and sinker, would be better described as fake skeptics.
UPDATE
Arctic vs Antarctic sea ice decline:

Just the smoothed versions:


I’m not generally inclined to encourage smugness amongst fellow bloggers by unconsidered compliments, but this one is a cracker. Jolly good show, that chap, A+. :)
The actual skeptics, from classical Greece, are spinning in their graves.
Wow great analysis, I thank you for your detailed analysis
Fantastic! I suppose my suggestion stuck. Just one minor edit: it’s La Nina.
And it’s worth mentioning that the planetary heat imbalance, despite La Nina transferring heat to the deep ocean, and despite aerosols and anemic solar cycle is still about +.6 Watts per meter squared. So the human forcing and related global positive feedbacks continue to over-ride the much weaker cooling mechanism.
That is indeed surprising. This could well become another highly-referenced post. Nice analysis.
It is always a pleasure to read your analysis. And regardless of your thoughts on the rest of my comment, your post shows a really clear way to present the data.
However, it appears to me that the deniers (a) include 1998 in the “previous years” data, and then (b) set the no-warming line from the 1998 data point, rather than from the regression line. Item b looks completely bogus to me, but item a is at least somewhat defensible. If it is not too much effort to calculate, how much of a difference would the new regression line created by including 1998 in the previous years data make in the hotter than/cooler than counts in your presentation?
Thanks…
Of course they start at 1998 and draw the line from there. Anyone trying to misrepresent the data would do that. Tamino has made the point that starting from a chosen point, however, always greatly inflates the error bars, something those who are dishonest “analysts” always fail to communicate.
When aggregating data annually, in almost any of the series the only using 1997 and 1998 will result in nonsignificant regressions. In at least 2 of them, UAH and GISS starting at 1999 WILL result in a significant regression. Of course I have yet to see any denier start at 1999.
Of course starting at 1999 is just as dishonest. The best place to start is with the entire dataset.
The best place to start is with the entire dataset.
Depends what question you want to answer. You don’t want to do a linear regression of the temperature for the past 30ky if the question is whether our burning of fossil fuels in the past century or two is having the predicted effect, for example.
Where deniers fail is in being honest about (or cognizant of) the effect choosing a subset has on their error bars. Well, that’s one place where they fail anyway. They’re generally pretty bad at forming useful questions, or understanding what question their methodology actually answered.
To start a new trend line from the 1998 temperature point breaks the continuity of the trend. Doesn’t that automatically require a physical event of some kind to explain it?
Wow. Beautifully done, sir. Thank you!
I think many of the skeptics are surprised to find as much determinism in the outcomes as there is. The CO2 as the control knob is the big deterministic factor, but then when one considers all the factors such as SOI, TSI, volcanic aerosols, and something to represent the long term variation such as LOD, then the outcome is locked in if we know these values.
Nice to be able to build off the ideas of Foster&Rahmstorf
http://contextearth.com/2014/01/22/projection-training-intervals-for-csalt-model/
Actually, I’d urge you to consider replacing fake skeptic with (climate) pseudoskeptic, which has a long history of usage, as in this or this. The main WIkipedia skepticism entry is useful, but my favorite is:
Morton’s Demon, a cousin of Maxwell’s Demon that we actually see riding many commenters.
‘Morton’s demon stands at the gateway of a person’s senses and lets in facts that agree with that person’s beliefs while deflecting those that do not. This demon is used to explain the phenomenon of confirmation bias.’
However, this may not go far enough, but I don’t know a well-known term, but some are ridden by roving Morton’s Demon’s, who range far and wide looking for even the craziest things that support beliefs, rather than standing around waiting at the gateway.
Anyway, fake skeptic is not bad, “skeptic” as in “skeptic” blog is in some sense ambiguous, depending on the reader:
“skeptic” can be interpreted as: this calls itself skeptic (in the classic scientific skepticism), but it might not be, or I have my doubts …
whereas pseudoskeptic blog = no way is this a classic skeptic place
I really think it is time to take the hijacked term back.
Martin Gardner and Carl Sagan were skeptics, as are/were most people listed here.
Of course, people can be selective, being real skeptics on many topics, and pseudoskeptic on some other. A few years back, Skeptical Inquirer published a straightforward article on global warming, creating a small, but intense firestorm of “cancel my subscription for printing this hoax” letters.
That suprirised E-i-C Kendrick Frazier for a while, but after a while most of the climate pseudoskeptics seem to have left.
There is of course some evidence that many climate pseudoskeptics can be prone to believing the silliest conspiracy theories. I hope to publish that next month.
I myself prefer several terms to “skeptic” or even pseudoskeptic.
Morons works, as they are actively using their intelligence to fool themsellves.
Clowns works, as they are both scary and entertaining.
Denialist or denier works, as that is what they do.
Coward works, because most are motivate by their lack of courage to accept the truth.
Or perhaps the less succinct: denizens of the Dunning-Kruger circle of hell.
“Dunning-Kruger Denizens”
— by Horatio Algeranon ( with title by Snarkrates)
Dunning-Kruger Denizens
Deep in denial
Scientific jettisons
Circular in file
Snarkrates, your suggestions (and Horatio’s poem) made me laugh, particularly as I have spent far too long thinking about the correct terminology to use.
Rob,
I am glad my humble contribution could at least do that. After all, if we can’t laugh at the clowns who refuse to look at the science, what use are they?
The Denialati are certainly not entitled to the term ‘sceptic’ because they do not practic true scepticism. They are in fact scepticism-resistant, and driven by ideologically-motivated confirmation bias, which would make them ‘ideologically-motivated confirmation bias-driven scepticism resisters’.
Sadly I can’t squeeze a cartchy acronym from that mouthful.
Oh, certainly it should be renamed: “Monckton’s Demon.” He’s earned that.
John Mashey wrote: “I really think it is time to take the hijacked term back.
Martin Gardner and Carl Sagan were skeptics …”
Actually, Sagan’s famous aphorism “Extraordinary claims require extraordinary evidence” is the very essence of pseudoskepticism, since it asserts that different standards of evidence apply to claims that one judges a priori to be “extraordinary”. A genuine skeptic should first and foremost be skeptical of a priori judgements as to what is or is not an “extraordinary” claim, and should require the same standard of evidence for all claims.
[Response: I disagree. I think Sagan was using “extraordinary” to mean that which is in conflict with very well-established prior information, in which case it isn’t a “double standard,” it’s just basic Bayesian reasoning. I suggest that insisting we ignore prior information is a capital mistake.]
Of course, the ultimate in “extraordinary claims” are those that one believes, a priori, are “impossible”, in which case no amount of evidence can ever be sufficienty “extraordinary” to prove their validity. Which is exactly the stance that some so-called “climate skeptics” take towards anthropogenic global warming.
I think that a good way to look at this is in terms of Bayesian probability. There are certainly things that strain credulity because they fly in the face of what we know to be true. I would be exceptionally skeptical of a perpetual motion machine, a time machine or a Star Trek-like warp drive, because they violate known laws of physics. Our prior should be biased against such things. However, if our prior is zero, then we cannot be convinced by any strength of evidence–our posterior probability will always remain zero.
[Response: I read a paper once which pointed out that there are solutions of the Einstein field equations which correspond to a “warp bubble” — they will “pick up” your starship, move it faster than light (globally, not locally) and accomplish “warp drive.”
Of course, it required negative energy density, which is allowed(temporarily) quantum-mechanically, but the total negative energy for a small warp drive amounts to the mass-energy of several galaxies. But that’s just a minor technical problem…]
My Prior for FTL travel isn’t zero, but it’s bloody small, and it would take a whole helluva lot of evidence for me to believe it. Of course FTL expansion of the Universe probably has happened (inflationary epochs), but all that did was make portions of what had been our Universe independent (noncommunicating) Universes.
I’ll just second what snarkrates and tamino have said: Extraordinary claims are those that contradict a lot of scientific data and the resulting theories that have been built from this data. A good example was the recent “faster-than-light neutrinos”: It would have been silly to abandon well-established principles of physics just because some team of scientists (and a quite large and competent team of scientists) measured neutrinos going a tiny (but highly-statistically-significant) bit faster than the speed of light.
It was an extraordinary claim and it turned out to be wrong. (And, the scientists who made the claim, to their credit, recognized it to be an extraordinary claim and didn’t try to oversell it…but merely said that they were reporting it because they had been unable to figure out any errors in their experiment or analysis and felt obligated to show it to the broader scientific community for their scrutiny.)
That’s the best explication of the false (pause)itive.
Many thanks.
It makes you wonder what will happen when ENSO turns mostly positive again, the PDO turns positive, the Sun becomes more active and BRIC countries start cleaning up their acts, doesn’t it?
Or does it? I’m not particularly looking forward to that, and the Houdini acts that will be performed by fake skeptics so that they can start afresh when the next “hiatus” in the Escalator begins.
Great update to the original Riddle Me This post, Tamino!
Reblogged this on And Then There's Physics and commented:
I thought I would reblog because it seems like a really clever illustration. In some sense, it’s another illustration of the escalator. Making a big deal of the “pause”/slowdown since 1998 essentially ignores that such a slowdown occurred immediately after a large jump in surface temperatures. Of course, if you start your analysis prior to 1998, the slowdown isn’t nearly as evident. I also liked the comment in the post that a lack of “statistically significant” warming is not the same as a lack of warming – something worth repeating.
You could consider a lack of warming (zero or negative) to be the null hypothesis. “Statistical significance” means it is disproven. But lack of “statistical significance” doesn’t mean it is proven because the null hypothesis is never proven.
Assuming the null hypothesis has been proven is one of the pseudoskeptic fallacies.
I wouldn’t expect it to change much, but what happens if you push the cut-off on a year to the end of 1998/start of 1999?
I just ask, because the argument generally uses 1998’s SAT as the “end” of the warming period (that way they get to use the El Nino as their cherry).
I sometimes try to reproduce what is presented here using the clunky tools I have available to me. In this case, I downloaded the HadCRUT4 data, imported to an excel worksheet, and used the stats and charting functions it provides. Here is a chart done with the range you describe. You may have to scroll around to see it full size. It takes more time to dress up the chart than to do the analysis.
Many thanks for that. It’s not a million miles from what I would have expected, which is gratifying.
Are you sure about these calculations? 1998 is a big outlier in just 20 years of data. I would expect it to have quite an effect on the slope of a fitted regression. All least squares/L2 projection methods are very sensitive to outliers, from their definition.
Denialists will, of course, scream foul because they said (read their lips) “since 1998”. But even then, and even with all the caveats presented in in the second paragraph of the post, and all the criticisms of underestimation leveled at HadCRUT4 due to its incomplete global coverage; ignoring all that, a linear rise calculated using data 1979-98 still puts the majority of the data above the rising forecast with two of those now below the no-rise forecast (because it is now set 0.06ºC higher). And if the data 1979-99 is used, or 1979-2000, the data points beneath the no-rise forecast quickly drop away from the analysis, demonstrating that insistence on using 1979-98 data is the real act of cherry-picking here.
Such alleged “experts” as Richard Lindzen or Judith Curry who place themselves in front of governmental committees of enquiry and talk of a +16-year-long pause, 16 years with no change – there can be but one conclusion to draw. These “experts” provide unreliable testimony. You cannot trust what they say even on something as simple as the”hiatus”. These are truly false experts providing false evidence to official enquiries. Can it get any worse?
I should correct/clarify the Curry figure given the severity of the accusation. She tells the committee it was “15+ years” or “16 years” (ie “stagnation in greenhouse warming observed over the past 15+ years”, “For the past 16 years, there has been no significant increase in surface temperature.”) This pretty much parrots Lindzen’s “For the last 16 years it hasn’t increased.” (12:05hrs on the video clip. Interestingly, if we can assume they are not saying no increase ‘over’ the last 16 years, (because they don’t say it) that puts both saying ‘No significant increase/no increase since 1997.’
Curious.
The statement “stagnation in greenhouse warming observed over the past 15+ years” implies that it’s not simply “increase in global surface temperature anomaly” which has “stagnated”, but the warming due to greenhouse gases, specifically.
That claim is quite distinct (and different) from “For the past 16 years, there has been no significant increase in surface temperature.”
The latter is a general statement about observed temperature record, which includes the effects of all sources of warming and cooling.
The former refers to only the effect of greenhouse gases.
Setting aside the question of how Curry managed to pull the “greenhouse signal” from the observed surface temperature record, how could “greenhouse warming” itself have “stagnated” (even in principle) when atmospheric CO2 continued to increase over that period?
Perhaps something “switched off” the “greenhouse warming” (IR absorption) in the CO2 that was added during that period??
There’s a certain Nobel prize (in physics and chemistry) for anyone who can show how that’s done in the lab.
Incidentally, even a “bare” (no feedback) climate sensitivity for CO2 doubling of 1 deg C (which even Lindzen acknowledges) would mean that the CO2 increase during the last 15 years would have induced about 0.1C warming (maybe slightly more, maybe slightly less “realized warming” depending on the climate response time, but roughly in that ballpark).
0.1C is well within the “trend + 2sigma uncertainty” that one gets with all the global temperature data sets (GISTEMP, HADCRUt4, RSS, UAH, NOAA) for that period.
And, actually, 0.17C is also within “trend + 2sigma uncertainty”, and that would be consistent with a CS for CO2 doubling of 1.8 deg C (or more) — 1.8C, assuming all the warming from the CO2 increase over the period has already been realized, which it almost surely has not. In the latter case, a consistent sensitivity might be higher.
It is very unfortunate indeed that a scientist (any scientist) would make scientifically unsupported (and unsupportable) claims at a Senate hearing (sloppiness is no excuse).
It makes a mockery of the very idea of having ‘expert” scientific testimony.
Indeed it is a very curious little speech that Curry makes.
”The premise of the President’s Climate Action Plan is that there is an overwhelming judgment of science that anthropogenic global warming is already producing devastating impacts.”
I’ve little knowledge of this Plan but surely the overwhelming judgement is that impacts of AGW are mainly in the future. And is this the same Plan described by Curry to reduce emissions as the way to reducing extreme weather events?
”Nevertheless, the premise of dangerous anthropogenic climate change is the foundation for a far-reaching plan to reduce greenhouse gas emissions and reduce vulnerability to extreme weather events.”
But judging by her words, Curry seems to be stuck in some mindset that future climate is inevitable and reducing emissions are some unlikely attempt to alter our destiny.
”Attempts to modify the climate through reducing CO2 emissions may turn out to be futile.”
And the ”stagnation in greenhouse warming observed over the past 15+ years demonstrates that CO2 is not a control knob that can fine tune climate variability on decadal and multi-decadal time scales.”
If you were determined to see a 15 year “hiatus”, I’m not sure where this assertion about ”multi-decadal time scales” comes from, or why it would lead you to deride mitigation efforts for being too long-term.
”Even if CO2 mitigation strategies are successfully implemented and climate model projections are correct, an impact on the climate would not be expected for a number of decades.”
It has to be said that if anybody’s looking for a meeting of minds here, forget it, coz someone is away with the fairies.
Nice, but what would happen if you chose to do the same on January 1st, 1999? Surely the still-warming prediction would be steeper (and the range wider?), but would it make a big difference to include 1998?
[Response: It makes surprisingly little difference to the forecasts, but it makes a notable difference to the slope of the linear regression *afterward* — without the 1998 spike it’s a lot harder to “give us pause.”]
Thanks Tamino, I suspected as much.
That would make me witless.
I may be mis-understanding Andreas’s question, or Tamino’s answer, but I think it *does* make a big difference whether 1998 is included as the last year of the first part, or the first year of the second part.
When I split the data set at the end of 1997, as Tamino does, I get roughly similar results to his (slightly different numbers of points falling above the lines, but it’s probably just a difference in how the regression is being computed).
But when I split the data set at the end of 1998, instead of the end of 1997, I get very different results — in most cases, only around half (or fewer) of the post-1998 points fall above the trendline.
Of course this is all based on a cherry-picked start date. 1998 was a crazy year for the climate, and thus when you split the data around that point and look at one half or the other, you can get misleadingly high or low trends depending on which side you include 1998 in.
[Response: When you split at 1999, how does the post-1999 trend compared to the post-1998 trend? How often have you heard “No global warming since 1999!”?]
Somewhat confused by Ned’s comment I decided to redo the predictions myself for HadCRUT4. There is indeed a quite big difference in the slope between choosing 1997 and 1998 as end years (0.168 deg C/dec compared to 0.133 deg C/dec). However, including -99 does not make big a difference (0.162 deg C/dec) to the 1998 case. It is interesting to note that the 1999 and 1998 trends are not very different from the trend one gets from all the years 1979 to 2013 (0.155 deg C/dec) and approximately half the points fall on either side of the extended trendline in either case. Surely this would not happen if there was a pause/hiatus after 1998? Furthermore, when I redo the same exercise with the Cowtan & Way data, the trend for all years is the largest. Again, why would this happen if there was a post-1998 pause?
Tamino writes:
[Response: When you split at 1999, how does the post-1999 trend compared to the post-1998 trend? How often have you heard “No global warming since 1999!”?]
Thank you for the response (not to mention the original post itself).
Yes, there are two different ways of looking at this problem:
(1) Calculate the trend up to date X, and then see how many years after date X fall above vs below that prior trendline [this is what you do here]
(2) Ignore what happened before date X, and just look at the slope of the regression line after date X [e.g., the usual fake-skeptic “no warming since 1998” thing]
For case (1), putting 1998 into the *first* half makes it look more like warming has slowed. For case (2), one has to do the opposite (put 1998 into the *second* half). Of course, one of the advantages of being a fake-skeptic is that one is free to be inconsistent in how one picks one’s cherries.
I guess the point I’m making above is something that’s no doubt obvious to you and to most others here. 1998 was just an anomalous year, and one can skew an analysis at least a bit in either direction by choosing to split the data around 1998 and put 1998 itself on one side or the other of that divide.
What you do in this post isn’t all that bad, because the anomalous year isn’t getting included in the regression model (good!) and it doesn’t have much of an effect on the post-1997 “number of years above the regression line” because it’s just one year.
But a fake-skeptic could use this same approach, shifting the breakpoint by one year, and get very different results. At which point, you still have to explain to them that cherry-picking an anomalous year as the start/end point for an analysis is misleading.
I apologize for the length of this comment…
[Response: No need to apologize, it’s certainly not excessively long. But before others get the wrong idea … brevity is the soul of wit.]
“fake skeptics” is too kind.
The real term is “credulous”.
Tamino, this of course raises the question, does a nonlinear rise better fit the data in a statistically significant manner?
[Response: As far as I can tell — if you compensate for the affects of the southern oscillation index, volcanic aerosols, and solar variation (so you’re looking at the man-made component), then temperature change since about 1975 is approximately linear. That’s based on statistics, we already know (from the laws of physics) that it can’t be perfectly linear — but the nonlinearity has yet to make itself plain (as far as I can tell).
The only data set for which I’ve noted an exception is the UAH TLT data. In that case, after compensating for known factors the rate of warming has changed demonstrably. It has gotten faster.]
Rather an irony that the only dataset to show hints of acceleration is UAH TLT.
Why would temperature change be non-linear? The control knob is CO2, and emissions have been growing approximately exponentially. Temperature responds to the log of CO2, so that should be approximately linear, shouldn’t it?
[Response: El Nino/la Nina, volcanic aerosols, solar variations, anthropogenic aerosols, non-CO2 greenhouse gases, black carbon, nonlinear feedbacks, etc. And — is CO2 rising *exactly* exponentially so its logarithm is *exactly* linear?
Further, even if climate forcing happened (by some miracle) to be increasing in exactly linear fashion, is the *response* of a complex system with multiple time scales also exactly linear?]
I’m confused. What straw man are you trying to demolish?
You started with compensating for all those things and got an approximately linear result and claimed that we know it can’t be thus. I’m wondering why approximately-linear is surprising given approximately-exponential input. What *should* the curve look like, from the physics? Or am I wrong that input is approximately exponential?
[Response: I quite agree it’s approximatly linear, in fact I stated that I have found no statistical justification to say it isn’t. I was only emphasizing that physics pretty much precludes its being *exactly* so.]
the way I see it, while the temperature rise should be approximately linear with only Anthropogenic co2, this approach excludes the potential faltering of carbon sinks due other effects of climate change (f.e. droughts, floods, wildfires), the decomposition of the (somewhat) established natural carbon pools in hydrates, arctic bogs and soil. Plants normally take part of the atmospheric carbon out but cannot do it as well in extreme conditions. If one checks the longer global temperature datasets (beginning from the mid 1800s , aka preindustrial), it’s quite easy to get a better correlation than linear with a very slight exponential function but I very much doubt this is a valid way of analysis since the analysis omits other forcings (aerosols and clouds for instance), that do make a difference in the temperatures.
while I’m at it, do you know if there are any high resolution datasets of global proxy temperature records from the last 1000 years or so (with datapoints of ~5 year intervals), set of local datasets might also do?
numerobis: The logarithm of an exponential function is linear only if the base of the logarithm is the same as the exponent. What Tamino is trying to say is that there’s no reason they should match exactly and with the amount of different things affecting both only a miracle would make them exactly the same.
It’s completely possible the result is close enough to linear that the difference will never make any practical difference, though.
[Response: I do believe that the logarithm of an exponential function is linear, regardless of the bases chosen for the exponent and the logarithm.]
log_a(b^x) = x log_a(b)
The base only affects the constant of proportionality: log of exponential is linear.
The only time I’ve seen a claim that temperature response should be exactly following the CO2 concentration curve is from deniers. This led me to assume tamino was making a strong claim that we should be able to detect a non-linearity. Now I see it was basically the opposite claim: obviously it’s not precisely linear, but it’s pretty close.
Emissions have been growing exponentially, but from a constant base of CO2 concentration preindustrial, so the formula is T ~ log(A + B exp(t)) which is quite different from T ~ log(B exp(t)) (T = temperature, t = time). The actual formula has positive curvature before flattening into a straight line after a long time period.
That reminds me, South Australia (and other places) had an extreme heat wave two weeks ago and another one is just starting now: http://www.bom.gov.au/jsp/awap/temp/index.jsp . Tomatoes are fairly cheap in the grocery stores at the moment because most of the tomatoes have been harvested because they’ll be ruined by the new heat wave. Once the harvested tomatoes run out, the price will skyrocket because there’s hardly any remaining on the plants.
“log_a(b^x) = x log_a(b)
The base only affects the constant of proportionality: log of exponential is linear.”
D’oh! Then I’m actually inclined to agree with you that it could be mostly linear without accidentally matching cancellations.
Chris O’Neill:
I’m not sure how the local orchardists have faired in the recent heat, but a related heat-damage just happended with one of my apple trees, where the unripe fruit half-stewed on the branches. This occurred to a serious extent in the orchards a few years ago just after the local summer pruning, which may have future regime implications for the commercial growers: unfortunately my trees are still young so the canopies aren’t fully developed.
It will be an increasing problem in the future though for both pome and stone fruit growers here and interstate, as we’re bang in the middle of the nor’westers that bring the summer heat of central Australia to the coastal regions.
Great remark. With your base interval choice, there is not only no pause, there is an acceleration.
I did a somewhat similar calculation with a carefully chosen shorter forerunner interval (19985 – 1998), and then the “pause” becomes visible. This shows, that the perception of any pause is completely dependent on the choice of the base interval – which of course comes to no surprise to the readers of this blog and skepticalscience.com.
(http://remarksandobservations.wordpress.com/2013/11/15/global-warming-hiatus-it-might-be-the-ice/ . The post is otherwise a bit questionable, but the juggling with intervals not.)
NevenA, the next decade or so could be really ‘interesting’ if we do see a constructive interference of a bunch of natural processes.
Seems like this is another way of looking at what Gavin already wrote about, no (see second bullet and its interpretation)?
http://www.realclimate.org/index.php/archives/2012/11/short-term-trends-another-proxy-fight/
I’ve used that approach in my own discussions with “skeptics”. I will refresh it with Tamino’s one. :)
If you truly had an open mind, you would have shown the satellite data with a model of two flat lines and a bump around 1998. Be glad, if not for global warming, you would be in an ice age.
[Response: Our little “thought experiment” consisted of predicting what would have happened after 1998, given only the knowledge of what happened prior to 1998. Are you saying I should have *predicted* a giant spike in 1998 followed by a flat line far below the spike?
And gosh, what could have caused such a spike? Would it be el Nino? Apparently you want to allow for el Nino when doing so makes warming look small, but not allow la Nina if doing so makes warming look large. My opinion: like most fake skeptics, you want to blame natural variation when it’s hot, ignore it when it’s not.]
Hey, that rhymes
“Sure ENSO-Lot”
— by Horatio Algeranon (with some help from Tamino)
Blame it when it’s hot,
Ignore it when it’s not
ENSO’s all we got
So better use a lot!
If you follow the criteria you established in “the bet” the data since 2004 is following right along the horizontal line, recognizing there is no winner or loser yet,
NevenA If warming speeds up the pseudoskeptics will just put more focus on how the temperature records are all being forget with unjustified adjustments, not taking urban heat islands into accounts etc for a while. Besides higher temperature are good and CO2 is the “gas of life”.
It’s all been done before. Back in the 90:s UAH showed a negative temperature trend due to a slight miscalculation, which the pseudoskeptics made a big issue of, only to change their tune in 1998.
How long do you think it will be before Bob Tisdale tries to refute tamino’s post over at LOL WHUT?! He’ll insist at starting from the 1998 data point rather than the trend line. In short: complete and utter lack of even the most basic statistical knowledge. That’s one of the requirements for being a fake skeptic, BTW. Their main tool is “eyeballing”.
Whereas our main tool is “eye rolling” :-)
Statistics is easy for a “skeptic” with just two simple rules to follow: You extend all temperature series forward from a local max and argue that warming has “decreased” or “stopped” and you extend all arctic ice extent/volume series forward from a local min and argue that there is a “recovery”.
So easy anyone, even a statistical idiot, can do it.
I was thinking along the same lines, the pseudo sceptics will accuse Tamino of some statistical trickery, believing their method of using a ruler to connect two dots is the obviously better method. Unfortunately there will be many who won’t see the problem with doing that.
Ah well, denial runs deep,
B Buckner: OK– I’ll bite. This is just another eyeball cherry pick.
The whole point of the methods being applied here is to see what the data say by using statistical analyses to distinguish noise from signal. If the widely discussed ‘pause’ disappears when we drop just one year from the analysis, that’s evidence that the apparent ‘pause’ is not a change in the trend, but a result of focusing on one exceptional year. One swallow does not a summer make.
The same goes (with even less significance for serious estimates of trends) for your pick of 2004…
I did not cherry pick, I referred to the brilliant, thorough and even-handed evaluation and bet conducted by our gracious host, on terms that he set, not me. I also made no conclusions as there are none to be made yet. I was not in any way critical of this post. You may want to click on the climate data links at the top of the page, go to NASA GISS, GISS Temp Figures, and look at the first one, Global LOTI. The 5-year running mean has been flat or declining for 9 or 10 years now.
http://vimeo.com/musicstore/track/178515/climate-septic-by-baba-brinkman
A good takedown of the septics (Stoat’s term, which remains useful).
“I’m a physics graduate, I’m a scientific advocate …”
Fun! But “leave the trash talk up to the rappers…”
Not that you don’t, Hank!
I’ve come to call them “skeptomaniacs”.
BTW: For many people the following explanation works better – take a look at the new paper from Jim Hansen, point them to Fig. 6 on page 4 and point out that temperatures have steadily risen on the southern hemisphere and in summer on the northern hemisphere. Just a cooling only in winter and only on the northern hemisphere – which can nicely be explained by the prolonged La Ninas – has ‘dragged’ the global average down a bit.
Plausible enough to have stopped the “it’s gotten cooler”-nonsense several times now.
“We’ve seen a *staggering* decline of Arctic sea ice”
I was looking at the Daily Sea Ice Extent Time Series chart at NSIDC this morning and thinking about what I learned from a statistics course. For the Arctic the chart depicts a current extent about ~1.5 sigma under the median. As a static data point, isn’t that quite normal? If so, how do we have a staggering decline if we seem to have a perfectly acceptable value in a normal distribution?
At the same time, the Antarctic extent is 2.0+ sigmas high but nobody seems to talk about it or describe a *staggering* increase in Antarctic ice.
[Response: The trend (which is so much bigger in the Arctic) adds to the *variance* in the data (sigma squared), so when you compute how many sigmas a given value is above/below average, the enlarged sigma due to the trend actually limits that value. Have a look at the graphs I’ve added to the end of the post.]
Besides Tamino’s response, you need to look at the geography. Right now we are getting towards peak ice–usually around Mar 1. The Arctic basin is pretty much frozen over. The only places ice even _can_ form, or not form, depending on the climate and year are the stretch from the Davis Strait around Greenland to the western Barents Sea plus the very northern Bering Sea as well on the other side. This limits possible variation.
That said, warm air being forced up the mid Atlantic has brought above freezing temps to almost 80N in the western Barents Sea over the past little while and so there is no ice there. The same is true in the Davis Straits. (Examine the NSIDC map and http://earth.nullschool.net/ on these points especially any time there is an arctic blast extending far south on the continent.)
If you go back through the years, you will often find “Arctic ice recovery” articles around Mar 1 as deniers take advantage of this necessary, and completely irrelevant fact.
For the foreseeable future, the arctic basin just _is_ going to freeze in the winter and there will be no great extent loss (volume is a different matter). But that is not the important issue re. “staggering”. That concerns the melt seasons.
Fiq,
The current ice area in the Arctic is at the lowest deviation from the mean that it will be all year. The high variations are at the end of summer. The opposite is true in the Antarctic, the deviation currently is at it’s highest there. Even with that, the deviations are not that different. When people talk of catastrophic loss of ice they mean during September and the rest of summer. Compare even this years deviation in September and you will see that the deviation is much higher in the Arctic than in the Antarctic.
Come back in August and read Neven’s Arctic Sea Ice Blog. We will see how big the deviations are then.
Predictably, when you link to this article on a site where there are a bunch of AGW deniers hanging out, they refuse to read it because it’s ‘warmist propaganda’ and just call tamino and yourself names.
It’s already happened on Slate’s Bad Astronomy blog. That’s why I gave up on Slate a few weeks ago. This article is a slam dunk, and you can’t even get the DK-inflicted morons to read it. Very much like Deep Climate’s excellent deconstruction of McIntyre via Wegman:
Replication and due diligence, Wegman style
They won’t even read it. So where do you go from there?
You counter claims made where they might convince ‘swing voters,’ and leave it at that. Refusal to look squarely at evidence is what characterizes denial–and what differentiates it from skepticism. So you’ll never convince a true denier. There will always be utter nonsense for them to take refuge in–even if only in their own imagination.
Technically the claim from skeptics is that there’s been no warming since 1998, meaning that 1998 was the last year of warming. So I think to address their claim, the initial line should be based on 1979 to 1998 rather than 1997. This doesn’t change the end conclusion but it does take some of those “14 out of 16 years above the red line” results and make them more like 11 out of 16.
Im confused. If 1998 is always picked because it is the warmest point, why does the next year increase in temperature in every comparative graph??
It looks like you are starting in 1997 to me.
[Response: The vertical dashed line marks 1997, which is the final year of the data on which the prediction is based. The hot year after is 1998, when the actual prediction begins. It probably adds to the confusion that the dashed line is actually at 1997.5, which is the mid-point of the “full year” 1997.]
I hope that somebody here can read french and give me some feedback on this attempt of “story telling” (to my neighbours or… my grand children.) It seems to me that…
[edit]
[Response: I’m sorry, but this is not the place to review unsolicited material. I suggest you find a place to post it on the internet, then if you want I’ll allow you to post a link where people can read it and offer their opinions.]
Thank you for the reply. I have learned to be cautious with time series data because I have fooled myself in the past and I think extra caution is warranted here because this is such a short time series.
When I look at your first chart, I note the recent volatility in the annual data and I honestly would not bet on either of those smoothed trends. If you were telling me that those were market returns for two different assets, I would honestly go look for a safer investment.
In your text response, I don’t follow that “the trend . . . adds to the *variance*.” Strictly speaking, one can calculate variance from observed data independent of trend (nobody has to plug trend into a spreadsheet to get the variance). I understand that increasing volatility will increase the variance, but it will also add to uncertainty.
So I am not quite sure that I understand your reply [“the enlarged sigma due to the trend actually limits that value”], but I think you were suggesting the idea that over time (relative to the starting point of the series) the mean has declined, so the absolute value between the current observation is not as large as it would/should be? Is that what you meant? I would agree with that if I had some reason to believe that the starting point held some special provenance over the other data points (it’s too bad that this series lacks history).
I would like to look at the data more closely, would you please share the URL for the series that you charted?
The second chart is more uncomfortable for me because it seems to emphasize the value of the trends. If trends were that easy and reliable, I think I would be a stock market millionaire. What makes me so uncomfortable with that second chart is that it makes a strong visual suggestion (precipitous decline of the red line, moderate increase in the blue) that actually contradicts what I can readily observe on the first chart; that the actual combined sea ice extent is the same or maybe even greater now than it was at the beginning of the period even as the trends diverge and the red trend in particular seems to accelerate. My occasionally painful forays into the market have taught me that I need to prefer actual observations to projected ones.
[Response: The recent “volatility” isn’t actually that at all. It’s a reflection of the fact that there’s a very strong annual cycle in sea ice data which should be removed (to compute *anomaly*) to look for overall trends, but that annual cycle has itself changed over time because summer/fall Arctic sea ice has declined faster than winter/spring sea ice. This is almost certainly, at least in part, due to simple considerations of geometry (see this). What you see as “volatility” is actually the difference between the recent annual cycle and its average over the “baseline period” used to define anomaly values. One can define “anomaly” in a more sophisticated way by using a time-varying annual cycle.
As for the trend increasing the variance, try this experiment: generate data with a linear increasing trend and no noise. Compute the difference of the final data value from the mean (or median) in terms of “sigma” units. Then extend the length of the time series — make it 10 times as long. You’ll note that even though the final value gets further away from the mean in absolute terms, in “sigma” terms it converges to a limiting value (the square root of 3). That’s because the trend not only increases the distance from the mean, it also increases the variance of the data.
The trend is what would be called in statistical parlance “robust.” Don’t expect momentary fluctuations to have the kind of “persistence” you may note in the Dow Jones. It’s not uncommon, but in my opinion it is a mistake, to conflate time series analysis as done in econometrics with how it should be done in physics. This isn’t the stock market, it’s thermodynamics, and as such is subject to some very fundamental constraints (e.g. conservation of energy) but is not governed by human psychology (rather chaotic).]
I saw the Climate Data Links above, this must be the series data source? It seems to stop at 2010? It seems to stop at 2012 and your chart seems to have more recent data.
ftp://sidads.colorado.edu/DATASETS/NOAA/G02135/north/daily/data/
[Response: They also provide a separate file of more recent data. You may find it easier to use the daily sea ice *area* data from the Univ. of Illinois. Northern hemisphere:
http://arctic.atmos.uiuc.edu/cryosphere/timeseries.anom.1979-2008
Southern hemisphere:
http://arctic.atmos.uiuc.edu/cryosphere/timeseries.south.anom.1979-2008
]
Its a shame that most “climate pseudoskeptics” will never see these graphs because that is the group which should derive the most information from them. Perhaps more unfortunate is that they would never do this analysis for themselves anyway. Admittedly, as a believer (Hmm, not a good word for a scientist to use), I wouldn’t do the analysis myself either, but then I don’t need to be convinced that we are responsible for warming world we live in. The real shame is that Tamino will be (has already been) accused of cherry picking his data when it wasn’t he who cherry picked 1998 in the first place.
This page is unbelievable. The entire article is about how skeptics cherry pick 1998 to show lack of warming, but you try to disprove it by showing a chart starting in 1979, the end of the mini ice age. I’m kind of wondering, do you think starting in 1979 is cherry picking or not? Because I think you probably don’t.
[Response: You need to improve your reading skills. I explicitly stated that I chose 1979 because I wanted to include satellite data. If you have a link to satellite lower-troposphere temperature data before that, do tell.]
I know this post won’t get past the “moderation” because you are much to Open Minded for that. This is science fraud, but you probably think this is science. The human mind is a terrible thing, that people can believe this bullshit.
[Response: Look in the mirror.]
“This page is unbelievable.”
Mr. Sanicola, you don’t realize it, but that statement is really speaking about your belief system, not about the analysis presented. Of course, Tamino already said that, in just four little words.
And actually, the article isn’t about how 1998 is a cherry-pick. That is self-evident, and long-standing. See, for instance, this:
http://hubpages.com/hub/When-Did-Global-Warming-Stop
It’s really about how the cherry-pick fails, in an interesting and surprising way. Too bad your preconceptions, maintained with such emotional force, won’t allow you to look at it.
KMcK This is the earliest “Global warming stopped in 1998” story I know of, by Bob Carter, published on 9th April 2006 in The Telegraph (UK):
http://www.telegraph.co.uk/comment/personal-view/3624242/There-IS-a-problem-with-global-warming…-it-stopped-in-1998.html
I remember reading it at the time and wondering how anyone could be so deluded. Here we are nearly eight years later and it’s still going on.
Indeed, Bob Carter was out there early and often. His cohort ‘s cherry-picking is certainly “self-evident, and long-standing.” They say it stopped in 1998.
What is a mini ice age?
Mike Sanicola:
So, from what year would you suggest Tamino’s analysis should have started?
As explained, 1979 was chosen because that is when satellite lower troposphere readings became available. But for the sake of argument, let’s forget about satellite measurements, and just use the surface series that go back much further in time.
Tamino’s analysis, as far as I understand it, is just a rather clear and elegant way of illustrating a simple fact: that the linear trend in average global surface temperatures from 1979 to 1998 has a LOWER slope than the linear trend from 1979 to most years after 1998, including to the present. So, we can roughly examine how changing the start year would change Tamino’s analysis by looking at the pairs of slopes (start year to 1998, and start year to present) of various start years earlier than 1979. (Using years much later make the time interval year to 1998 too short). Using WoodforTrees I looked at start years 1939,1949,1959,1969, and 1979, and also 1975 (since that is when the recent period of global warming kicked off), using HADCRUT4, see:
http://tinyurl.com/omrvq73
Here are the differences in slope, ie (Slope of Start Year to present) minus (Slope of start year to 1998) for the various start years I examined:
1939 +0.00381degC/year
1949 +0.00362degC/year
1959 +0.00345degC/year
1969 +0.00142degC/year
1975 -0.00040degC/year
1979 +0.00224degC/year
Thus, of the years examined, only starting in 1975 produces a marginally negative change (ie the slope from 1975 to present is marginally less than the slope from 1975 to 1998).
As far as Mike Sanicola is concerned, the irony is that he complained of Tamino starting at 1979, which he characterised as the “end of the mini ice age”. If we overlook that amusing hyperbole (it was merely a cooler period that followed WWII), had Tamino actually chosen that end, it appears he would have chosen the LEAST favourable year to illustrate the inexorable fact that warming is continuing.
I was simply going to say that I didn’t think he’d thought through the effect that choosing an artificially low starting point would have on this analysis, but I like your version too.
Since he is predicting what the next 16 years will bring, why not use the previous 16 years. When that is done, you’ll find that most of the current 16 years will in fact be well above the expectations line. It was a simple slight of hand trick.
Kevin ” why not use the previous 16 years”.
Because there is no reason to do so.
Would you suggest that if one wished to predict the next 100 years or 5 years, one should extrapolate the the trend of the previous 100 or 5 years? I hope not.
Let us remember the reason for the above article. It responds to the “No global warming since 1998!” nonsense. The agenda is set by those who have made such false statements.
In order to examine whether the trend after 1998 has changed it is necessary to establish what was the global warming trend prior to 1998. One does not do that by arbitrarily using the trend for the same number of years before 1998 as one is examining after 1998.
OT, but just read (over at Neven’s ASIB) that Walsh and co, at the University of Alaska Fairbanks, have done a massive data rescue, digitization and preparation job, to create an historical sea ice atlas of Alaskan waters.
http://www.alaskadispatch.com/article/20140125/new-sea-ice-map-offers-long-term-look-climate-change
Wish it could have been the whole Arctic, as Neven remarked, but perhaps others will now venture where Dr. Walsh and colleagues have already dared to tread.
“Cause for Pause”
— by Horatio Algeranon
A major pause since 98
In skeptophrenic thinking.
The cause for pause is very great:
The reasoning is sinking
I have a comment and a question, because I love statistics but can never quite get it right.
Comment: Imagine a homeopath who said “My concoction wasn’t significantly better than a placebo at improving your health, but that doesn’t mean health improvement wasn’t happening”. Would that be acceptable? If I were a skeptic, I would certainly jump on that statistical warming statement.
Question: When lines are drawn that are plus or minus 2 std. dev. from the trend line, my understanding is that point that falls between the 2 std. dev. lines is essentially (statistically) indistinguishable from being on the trend line. Based on that interpretation, while the conclusions would not change, some of the numbers would change.
For the HADCRUT4 data, I would interpret that as one outlier (above the plus 2 dev. line), all other points consistent a warming trend and approximately 6 points consistent with no warming.
The reason I bring this up is I’m sure to get into a “conversation” with some skeptics about the “end of the warming trend” and I want to be sure I understand this article.
So, where did I go wrong?
[Response: Points can be outside the 2-sigma limits just by accident — but it won’t happen very often.
If all the points fall within the 2-sigma limits, then no single data point is evidence of inconsistency. But if *all* the data points are within the 2-sigma limits but on the *same side* of the expected value, then their combined statistical influence might negate the null hypothesis.
When data are consistent with two different hypotheses, the choice one makes depends on what one considers the correct “null hypothesis” to be. Some would argue that it’s “no warming,” but I believe it’s “no change” (i.e., no change in trend). Others (myself included) might say that the quandary over which null hypothesis to choose argues for doing Bayesian (rather than traditional “frequentist”) statistics.]
Saying that there has been a “pause” or “hiatus” or “stagnation” (Curry’s latest brilliant contribution) in warming implies (at least from the dictionary definition) a “cessation” or “break” or “vacation(!)” in the previous trend, ie, ‘a change in the trend”.
I say implies because quite frankly, I have never seen a precise definition of any of these words in the present context. Has anyone else?
On the other hand “No warming” implies a very specific change, to a very specific trend: the flat-line.
Where is the standard (2 sigma) statistical evidence that the trend has changed from the previous 30 year trend? Where is the evidence that it has changed to a flat line?
Of course, all of this depends on what the meaning “pause/hiatus/stagnation” (and probably “is”) is.
The biggest problems with all the talk of “hiatus”,”pause”, “stagnation”etc, is that none of these terms is properly defined (if at all) in this case.
The people who use this terminology can’t even seem to make up their minds whether they are talking about the global temperature increase (ie, the overall temperature record ,which includes effects of GHG’s and noise) or just “greenhouse warming”.
Talk of a pause/hiatus/stagnation (break? vacation? coffee break? doldrum?) in “greenhouse warming” is just nonsense, given that CO2 molecules don’t take breaks or vacations (no matter how brief) from absorption, but Curry nonetheless used the “stagnation” terminology in her recent Congressional testimony: “stagnation in greenhouse warming observed over the past 15+ years”.
Brings to mind a CO2 molecule floating face down in a stagnant swamp with a knife in its back.
It is simply not possible to argue against something as ill-defined and unscientific as this and, in my opinion, it has been a huge mistake for scientists to even try UNTIL they had nailed these people down very specifically on what they mean (in a scientific sense.)
Nailing them down would have required them to bring in statistics and the rest and basically admit that they did not have a hiatus to stand on.
Horatio – thanks for your response. I am certainly not supporting the idea of a “pause”. The concept is obviously bogus.
What concerns me is that we could accept there has been “warming” even though there has not been “statistically significant warming”. How do we know that there has been “warming” if there has not been a statistically significant change in the measurements? You just know some alt-med quack is going to pick that up and use it as justification – “Well, it’s good enough for climate science it’s good enough for me”.
Of course the warming has continued and there are plenty of other measurements, but this particular phrase just bugs me.
I’m torn between a coffee break and a bummer, but that probably tells you more about me than it does anything to do with climate.
It’s easy to look for such evidence. Just use http://www.skepticalscience.com/trend.php
Whether you’ll actually find such evidence is another matter however.
Lynn, I find the best argument against any of the ‘pause, hiatus,’ types is to show a graph of ocean heat content – like NOAA’s.0 to 700m or 0 to 2000 m OHC products
‘Global Warming’ has come to mean in most people’s minds surface atmospheric temperature – but this is an improper definition. The globe does not consist of merely the atmosphere. For a complete picture we need to consider not just surface (atmospheric) temps but ocean and soil temperatures as well. They have far more mass than the atmosphere so they contain far more of the additional energy. SAT is an imperfect proxy for true global temperature; unfortunately it’s the most widely used and the easiet to understand.
Or, alternatively to ocean heat content, look at the global ocean temperatures (from which the ocean heat content data are derived) provided by NOAA.
http://climateconomysociety.blogspot.com/2014/01/no-hiatus-pausestop-in-global-ocean.html
The definition of global warming is the surface air temperature. That is the definition.
I am well aware that temperature is a different quantity than heat, and have no objection to people tracking the accumulation of heat, but ‘global warming’ is simply not defined in this way. This is not a ‘fundamental disagreement’, this is simply you redefining the term ‘global warming’. For me (and almost anyone else you care to ask) global warming refers to the increase in global surface temperature anomaly. (emphasis mine) … – Gavin Schmidt
It’s obvious that the “theory” claiming the warming of the globe has stopped/”paused” is placed in what I would consider dire jeopardy by the persistent increase in the OHCA.
Jan – thank you for producing an up-to-date OHC graph for relevant layers. In terms of the apparent pools of ocean water that are moved around by ENSO, versus the past, it looks like the next El Nino will be working with significantly warmer water, that the recent La Nina events have involved warmer water, and that the current phase of ENSO neutral is involving warmer water.
As I understand Trenberth, this is primarily what he meant by warming coming back to haunt us.
JCH,
small correction. The graphic I made from the NOAA data shows the global average temperature anomaly over time for three differenct ocean depths, not the ocean heat content, although both are closely related.
Lynn, re this:
“Comment: Imagine a homeopath who said “My concoction wasn’t significantly better than a placebo at improving your health, but that doesn’t mean health improvement wasn’t happening”. Would that be acceptable? If I were a skeptic, I would certainly jump on that statistical warming statement.”
The homeopaths statement would be accurate if they had done a small trial with low sample sizes, which would mean their statistical test had low power, and therefore was not useful. Seeing that their test had no power, you would probably weigh up the evidence from the small and inconclusive trial with the all of the other (prior) information about the efficacy of homeopathy, leaving you with a still strong (posterior) belief that the concoction does nothing (you could use a Bayesian analysis to formalise this natural “updating of beliefs”). You would probably also tell the homeopath to do a larger trial with sufficient power to detect the effects they thought their concoction produced – i.e. to get more data.
The lack of statistical significance in temperate trends since 1998 is at least partly a statistical power issue- there is not enough data (since 98) to achieve a statistically significant result, even if there has been warming. If we only had temperature data from 1998 it would be silly (but still technically accurate) to say “theres no statistically significant warming but that doesn’t mean its not warming”, but unlike the homeopath, we have lots of other data (and solid physical theory) that says the earth has been warming for decades and continues to do so.
Jim – thank you, that’s the answer I was looking for.
“The Hiatiuns”
–by Horatio Algeranon
The motto of Hiatiuns
Is common to stag nations:
“The Pause is just because,
And not subject to laws”
I think the best way to assess if it has warmed since 1997 to determine the temperature in
1998 and 2013 and compare them. It is not to estimate the rate of warming over that period.
The problem then is how to assess the two temperatures given that there is a lot of noise.
We will need to average many monthly temperatures around 1997 and 2013 to reduce the noise.
This will provide us with two means and variances to calculate the temperature change and
the significance of the result.
So how many months should we use. 1 month, 1 year, 5 years or 10 years.
I think the answer between 3 and 5 years.
Using a 5 year window I think the last 5 years (2009-2013) are significantly warmer than a window
17 years earlier (1993-1997) by about 0.20 C
——————————————————————————–
So what have those who see a 17 year pause done. This is what I think.
They have estimated a mean temperature and a slope centered on 2005 using a 17 year period.
They then use this mean and slope to obtain a best estimate of temperature in 1997 and 2013
by extrapolating their line backwards and forwards. Since the slope of the line is zero they find
that the temperature in 1997 is the same as 2005 and the same as 2013 and at every intervening year.
Since the temperature has not changed at all for 17 years it follows it has not warmed
and there has been a very long pause.
There is a major problems with this method. It is a poor estimator of the end-point temperatures
largely because the end point temperatures are independent of the path taken between them.
If the end points cannot be reliablely estimated then the method can not give a reliable answer.
In the specific case we are looking at here the estimate of the 1997 temperature is way off. Hence the
mistaken conclusion that it has not warmed when in fact it clearly has.
So I was able to spend a few minutes looking at the data this morning and I was thinking about your reply (and your non-reply to my comment about the second chart that you added).
[Response: Impressive! After “a few minutes looking at the data” you now know the truth about Arctic sea ice decline. How shall we worship your brilliance?]
I think there is a big difference between financial modelers and climate scientists. When financial modelers create models with no skill, they lose their money and their jobs. When climate modelers produce models with no skill, they keep their jobs and get more grants. I don’t think you should dismiss that distinction lightly.
[Response: You wanna go there? When climate modelers produce models with no skill they say so. If you think otherwise, it’s because you’ve been listening to idiots who are as full of shit as you are.
When financial modelers produce models with no skill, they make billions of dollars in profit while millions of hard-working honest people lose their jobs and their homes.]
I do not see the “staggering” decline you seem so certain about. Arctic sea ice extent is down about 15% from the *start* of the series. I don’t consider that staggering (its less than 2 sigmas out because the fact is, it just hasn’t moved that much). It’s also possible that the starting point on this short series was high relative to a longer baseline. If the middle of the series is more representative of a longer scale baseline there is not much of a decline at all. If the data is sampling annual measurements in a normal multi-decade cycle it’s simply foolish to be expressing certainty while we might be partway through the cycle.
Your talk of thermodynamics/economics is silly misdirection. The beauty of math and statistical inference is that they are uniform across domains. Variance is variance even if esoteric terminology changes from field to field. Domain expertise helps in modeling and explanation, but is not necessary for asking simple questions about the data.
To be honest, this quick look has angered me a bit. You are scaring the crap out of my in-laws. I don’t see the basis for it. If you were saying, “Wow, the magnitude of the annual thaw and the refreeze in recent years in the arctic looks unusual” I would be saying, “Right. What do you think is going on there?” But that’s not what you are doing. What I am going to say next will piss you off, because it holds the sting of truth. When I look at your claims relative to the actual limited data, and when I look at the fawning uncritical thinkers that seem to frequent your blog, the imagery that pops into my mind is one of a monkey, that, able to peer one foot deeper into the jungle than the monkeys around him, sees a short stack of bananas on the next tree and reports to the other monkeys that all the bananas are going extinct.
That is the essence of your second graph.
Your readership believes you without demanding evidence, and when you produce a chart like that, they don’t seem to understand that there were many possible variations you could have shown but chose not to show. Congratulations, you are king of the uniformed. Is it a heavy crown?
[Response: I had high hopes for you as someone who wanted to get at the truth without imposing his own perspective which comes from the wrong field, and *admittedly* unskilled background in statistics.
On the off chance that you might still be amenable to reason I’ll do a big post about sea ice. After you read it, I expect you to answer the question: is Arctic sea ice decline “staggering” or not?
If you say “no” then you damn well better back it up with some real evidence — but if it’s more of the same pure, unadulterated, grade-A, USDA choice, Iowa corn-fed bullshit like you’ve put in this comment, expect an earful. If you refuse to answer, choosing instead to simply “disappear,” then everyone will know you’re not just an opinionated arrogant fool — you’re also a coward. You’ll even know that yourself.]
Wow! Genuine weapons-grade stupidity!
Dude, do you really think that physics is irrelevant when talking about arctic sea ice decline? What fund do you work for so that I can be sure to avoid it?
You are incompetent, and an assclam, besides!
“It’s also possible that the starting point on this short series was high relative to a longer baseline.”
Er, no, it’s not. More than ‘a few minutes’ of attention to the question would have made that plain to you. There are estimates and reconstructions in the literature that make that plain–and a deep history of discussing them on this very blog, which means us ‘monkeys’ are well aware of something you didn’t bother even to look at.
Hint: try Googling “walsh fairbanks sea ice.”
“…you are king of the uniformed.”
Which leaves the title ‘king of the uninformed‘ to you.
Tamino has a weakness – he believes the best of people for too long. I think it annoys him a bit when people like fiq take advantage.
At the risk of slightly preempting Tamino, fiq, because Tamino has posted on this before, you seem to be taking the stance that all sea ice is created equal…and to those of us with physical science backgrounds this is entirely and immediately obviously wrong. (There’s a hint there for you).
Coverage of ocean with ice has an important effect of reflecting much of the incident visible light back into space, so that it doesn’t warm the earth. When you have open ocean the light is absorbed, thus contributing to warming the earth.
Antarctic sea ice grows in winter and always melts back to the coast in summer. During the winter, the sun is low on the horizon, and the days are short, thus changing the amount of energy the antarctic ocean absorbs from winter increases in ice extent is relatively small.
Arctic Ice on the other hand, in former times kept the Arctic Ocean covered with ice all summer long, reflecting light keeping things cooler. When large fractions of the total coverage disappear, during the summer when days are long It makes a big difference in the heat absorbed by the arctic ocean.
Tamino calculated the insolation effects in a prior post:
Study it.
Since you went on to make aspersions about climate modeling I’ll ask you to consider what you know about them in the form of two questions. For a given variable how far off are the models?, and for you to think the models are good, how close should they be? How did you develop these criteria? I don’t know if you chose to reply you’ll get through, but I’ll be interested. My experience to this point is that point criticizing climate models really have no standards that they are trying to uphold. They can’t answer these questions…which means that we can consider the possibility that they’re not asked in good faith.
I haven’t abandoned all hope that “fiq” is sufficiently open-minded to listen to reason. So: I suggest that rather than “piling on” (in spite of the fact that he insulted most of you as well as me), let’s wait for the post (in a day or two) and see whether — and if so, how — he replies.
With all due respect, Your Majesty, given that you are the “King of the Uniformed”, wouldn’t that make the rest of us “insulated” rather than insulted?
“I’ll do a big post about sea ice.”
And a politician answers the question they wished they were asked instead of the one that they were asked.
Let’s go back to my original post where I asked a VERY SIMPLE question:
— start —
“We’ve seen a *staggering* decline of Arctic sea ice””
I was looking at the Daily Sea Ice Extent Time Series chart at NSIDC this morning and thinking about what I learned from a statistics course. For the Arctic the chart depicts a current extent about ~1.5 sigma under the median. As a static data point, isn’t that quite normal? If so, how do we have a staggering decline if we seem to have a perfectly acceptable value in a normal distribution?
At the same time, the Antarctic extent is 2.0+ sigmas high but nobody seems to talk about it or describe a *staggering* increase in Antarctic ice.
— stop —
Michael Sweet seems to have understood the question. He provided a mitigating response about seasonal variability (that missed my point about the static value, but he does seem to have understood the nature of my question even if he didn’t provide the answer).
You responded with two charts and the idea that an artificially generated persistent trend will increase sigma. Yep. I agree. An artificially persistent trend would do that.
But my question was really very simple. I didn’t ask about thermodynamics, how to make seasonal adjustments to time series data, what a smoothed trend would look like overlayed on the data, or to get walked back through time where > 2 sigma moves occurred. I asked why you are characterizing a staggering decline in Arctic ice extent when the actual current value lies where it does?
So I welcome a post that answers my simple question — if the actual current data in the series appears to be within statistically normal boundaries why is it being characterized as staggering — using the relevant data (http://nsidc.org/data/seaice_index/ 1980-2010 average, +/- 2SD).
I do not welcome a Big Post that wanders all over the place answering questions that I did not ask.
[Response: How nice of you to suspect that my “big post” might wander all over the place answering questions that you did not ask. Before you even see it. Regular readers already know I don’t do that, but I quite understand that you choose not to rely on such “fawning uncritical thinkers.”
Here’s the deal: I’ll answer your question. Then you answer mine.]
I think I just gained a further appreciation for the ætiology of the global financial crisis…
Fiq,
Simply because you are uninformed does not mean that the rest of the readers at this blog are also uninformed about sea ice. You have included me as part of the uninformed. Before I came to his blog today, I looked at the daily sea ice map from the University of Bremin, the NSIDC map sea ice area map and the Cryosphere Today Sea Ice area map. I also checked the daily Canada sea ice maps. That is more than you know in total about the sea ice. Tamino knows way more that I do about statistics, but he cannot convince me about changes in the sea ice that are not happening. If you were not so uninformed, you would know, as Tamino and I do, that there is a graph of sea ice area at Cryosphere Today [Response: It’s the “Walsh & Chapman” data] that shows Arctic sea ice going back to 1901. I checked it and Tamino has not cherry picked the data as you accuse. You must retract your foolish comment. Cyrosphere Today also has a Global Sea Ice graph. The decline in Global Sea Ice is so dramatic that it is not even necessary to wait for Tamino’s post to tell us that there is a statistically significant decline in global sea ice. If you checked this readily available data, you would know that for the past 5 eyars the Global Sea Ice has been substantially under the average. It is only in the past 6 months that the sea ice area has gotten back up to average. Why do you call someone “King of the Uninformed” when you are completely ignorant of the facts??? You realize what that makes you look like? Look at this picture of data from Cryosphere Today. Then come back and tell us about catastrophic collapse.
Many of the posters at this blog also post at Neven’s Sea Ice Blog. If you have not read that yet you are simply ignorant of the facts. Unfortunately for you, Neven takes a break in the winter and will not gear up again until April or so.
Out of interest you state that we have warmed the deep oceans, how do we measure that?
Now this is just curious. I feel perfectly fine where I sit, but when I read the comments I realize that falling fast; “weapons grade stupid” yesterday and now a leveler of cherry-picking accusations (really Michael?): “I checked it and Tamino has not cherry picked the data as you accuse.” Time to hide the kittens, there is no telling where my depravity will take me today.
—
Now, from Tamino . . .
“…Here’s the deal: I’ll answer your question. Then you answer mine.]
“I’ll do a big post about sea ice. After you read it, I expect you to answer the question: is Arctic sea ice decline “staggering” or not?”
The old, “let’s trap the rube into my domain expertise so that I can school him, thus garnering praise of damsels and vanquishing my enemies trick?” How many Dave Burtons do you need?
I have asked a very simple question. I have repeated it. I welcome an answer to it. I don’t welcome a treatise on the question that you wished that I asked.
Again . . .
“The chart depicts a current extent about ~1.5 sigma under the median. As a static data point, isn’t that quite normal?”
[This is a yes/no question, one to establish agreement on the 1/30/14 data — the question would transfer to other data sets, it’s a question about statistical inference, it’s not a question about ice.]
“If so, how do we have a staggering decline if we seem to have a perfectly acceptable value in a normal distribution?”
[In other words, why are you using twenty dollar words to describe a data point that is 1.5 sigma from the mean (in a data set that describes two sigma as the range of moves that might be due to natural variability?)]
My hoped for response was, “Okay, you raise a good point. It is fair to characterize that data point as statistically normal and it does not constitute a staggering outlier on it’s own. However . . . .” Then I think we would have had an instructive exchange about recent ice volatility in the arctic and how to deal with statistical uncertainty in that data set (the latter part being my biggest curiosity). And my tacit question of whether or not your current language matches current conditions would have been up for fair debate. I honestly didn’t think it would be so hard to get to the starting point, an agreement that the data point in question does appear to be rather normal.
[Response: Read my response here]
Where do you get this 1.5 sigma from? And how do we know that it’s anything other than a strawman?
You really undermine the sophistication of your post with all the middle school level name calling of those who reserve the right to pose legitimate questions. Just stick to the science.
[Response: You really undermine your credibility when you characterize “fiq” as simply one of “those who reserve the right to pose legitimate questions.” That was possible until he decided to accuse climate modelers of institutionalized incompetence, liken me to a monkey, and refer to my readers as “fawning uncritical thinkers.”
I treated “fiq” with complete respect until he decided to get ugly.]
My comment was based on the original blog, not any of the other responses. All the snarking degrades the discussion. Goes for all sides.
Spare us the concern trolling.
+1
readers, note that Lisa didn’t use any specific example of the claimed ‘middle school level name calling’ in the original post.
The thing is, Lisa, this is Tamino’s blog. He can run it how he likes, and if he sees a legitimate reason for calling a spade a spade that’s he prerogative. Perhaps if the subject matter was one of who has the best yoyo in the school yard then there’d be some reason to recommend that the language be different.
The bottom line though happens to be the future habitability of the only planet to host life as we know it in the universe, including the continuation of a cohesive human society and the maintenance of the biodiversity on which we rely. The people who are the targets for such disparagement are those who refuse to accept the best evidence that humanity has at its disposal, and/or who refuse to allow us to move forward to mitigate against the damage to the planet that we are persisting with. This is foolish behaviour, and calling for what they are the fools who are resisting action to mitigate against further damage of the biosphere is hardly unreasonable. At least this way third parties have the opportunity to find out what those in the know think about the notions of the likes of Fiq.
Of course, if you can show where on the internet – or indeed elsewhere – the polite language, kid-gloves option has led to a satisfactory rate of enlightenment of these physics deniers, I am sure that everyone would be extremely interested.
Lisa Kelchner,
I am puzzled. What is your objection? Where is the “snarking” within the post?
Is it the use of the word (pardon my French) “damn”? Or the use of italics for emphasis, an aversion to the phrase “running off at the mouth” or is it calling a certain type of activity ‘fake skepticism’.”? This is all pretty mild stuff. I see nothing matching your description in the post.
Perhaps its objection to one academic being named in the post, that being Judy Curry. If so, I for one would happily take issue with you. When it comes to AGW, Curry has left science behind. Calling her a “fake skeptic” is letting her off very lightly.
“My comment was based on the original blog,”
That’s a “curious” claim, given that (as others have noted) there was no “name calling of those who reserve the right to pose legitimate questions” in the original post.
In fact, your second claim is simply not true. Everyone can see that.
Spare us the lecture. Tamino gives people more than a fair shake to everyone to ask legitimate questions and devotes a great deal of time and effort to answering most of them.
He gave “fiq” (the spitting image of a “boor”) a whole post, for goodness sake, even AFTER he had called Tamino a “monkey” and “King of the uniformed” (sic).
It’s Tamino’s blog and he is under no “obligation” to even allow such comments, to say nothing of just let them “slide.” The reaction of most people to being called a monkey in their own house would be to “throw the bum out”, quite justifiably.
The irony is that Tamino WAS sticking to the science until fiq barged in and started making his very rude comments.
Some people would obviously like to have it both ways. They wish to be rude in the extreme to others, but when it comes to themselves, they wish to be given a pass from the very people they were rude to.
I spent years as a teacher and know that making excuses for such rudeness does no one any good, not least of all the one who is responsible for the completely unacceptable behavior.
Hardly. It actually encourages more it.
“Responsibility” is a concept about which some people just seem to be utterly clueless.
Lisa,
Why is ridicule not an appropriate response to the ridiculous? Indeed, given your own ridiculous concern trolling, I think people are being remarkably cordial not letting you have it both barrels.
What adjustments are you making? GISTEMP does not show the same data. For example 1999 and 2000 are above .40, while you have them at .30
[Response: What graph are you looking at? The one in this post labelled “NASA GISS” shows 1999 and 2000 slightly above 0.4.]
Hi! Good post. Maybe worth noting that the steepest trendline you use appears to be the one on the NASA GISS graph, which shows an increase in anomaly from about 0.15°C in 1980 to about 0.54°C in 2010, totalling 0.39°C or about 0.13°C/decade. According to AR4 “Since IPCC’s first report in 1990, assessed projections have suggested global average temperature increases between about 0.15°C and 0.3°C per decade for 1990 to 2005.” So your very steepest “what you’d have expected” trendline actually falls about 15% short of IPCC’s real, contemporaneous minimum projections.
Nancy C.,
I would note that the period in question is too short for the system to come to equilibrium–as evidenced by the increased warming in the deep oceans. There is still warming in the pipeline from years past. We won’t stop warming until Energy out = Energy in. We ain’t there.
The trend calculator at http://www.skepticalscience.com/trend.php gives me a trend of 0.171+/-0.56 K/decade for the GISS data for the 30-year time period between 1980 to the end of 2009.
Nancy C, the GISS graph, as explained in the text, covers 1979 through 2013. You could shorten it to 1980-2010 if you wished, and then guess at the trend, as you’ve done, or you could go do some simple running of the numbers: http://woodfortrees.org/data/gistemp/from:1979/to:2011/trend/plot/gistemp/from:1979/to:2011
1979 through 2010: 0.171744 C per decade.
1979 through 2013: 0.157522 C per decade.
1980 through 2010: 0.171829 C per decade.
Oh nevermind – misread. Need more coffee.
Nancy
The above graphical exercise was really not meant to provide an estimate of the trend over the 1990 – 2005 period.
It was meant to show that the post 98 data is consistent with a pre-98 trend (trend taken on 1979-1997 data)
The calculated trend comes out steeper if you include later data, which is actually implied by the above graph, since nearly all the post 98 points lie above the pre-98 trend.
Probably the easiest way (no linear regression required) to compare IPCC projections to what happened over the period 1990 -2005 is to take averages (eg over 5, 7, 9, or 11 years) centered on 1990 and 2005 and use the difference to calculate the trend over that period.
The answer is about 0.18C/ decade for NASA GISS data, which actually does fall in the 0.15 to .3C/decade range.
Nancy C
If it is the period 1990-2005 that is of interest, it is not difficult to calculate a least squares trend for those years. GISS yields a value of 0.24°C/decade (+/- 0.1°C) which sits pretty squarely in the 0.15°C – 0.3°C range. And just in case you feel that this is unfair as GISS appears to have “the steepest trend line,” the value for HadCRUT4 is a meager 0.23°C/decade. So the earlier projections cited by AR4 look to have been pretty prescient, as the AR4 SPM pointed out.
The projection in AR4 SPM was “For the next two decades, a warming of about 0.2°C per decade is projected for a range of SRES emission scenarios.” So do come back in 2027 and tell us how that projection fared. I’m sure we’ll be all ears.
How do you get those figures? The GISSTemp anomaly figures in http://data.giss.nasa.gov/gistemp/tabledata_v3/GLB.Ts+dSST.txt are 0.23°C in 1980 and 0.67°C in 2010. But as others have pointed out, picking individual years gives inaccurate estimators.
All, thanks for the replies, and I’m sorry if I wasn’t clear about my point. Speaking as if to Tamino, I said “the steepest trendline you use…”, which means I was talking about the linear trend line shown on his specific graph, not one from wood for trees or giss or anywhere else, the one shown on his graph that he used to make his point. Please examine the points I specifically mentioned on Tamino’s giss linear trend line graph above, and I think you’ll see that its slope is 0.13C/decade as I stated, and I think you’ll also see that this represents the steepest decadal trend line he used to make his point. This is the slope of the line that most of the last 15 years’ data points fall above. Those who pointed out that other sources indicate a steeper trend are absolutely correct to do so. Such was my point, really. The steeper trend you all have argued for would also put correspondingly more of the data from the last decade below, or at least closer to the 0.13C/decade line than Tamino has used here, which would weaken the conclusions of the original post.
In other words, IPCC projected a trend of 0.15-0.3C/decade prior to and toward the beginning of “the pause”, but in order to demonstrate that “the pause” doesn’t exist, tamino relies on trends exclusively lower than this range (I said the steepest was 0.13, but I might have been wrong…the main hadcrut graph’s line looks to go from about .04C to .44C over the same 3 decades, so about 0.133/decade there). In other words, “the pause” doesn’t exist if, as tamino’s done here, you take a curry style “luke warmer” view of the trend. If you use a trend a little bit more in keeping with IPCC projections, then “the pause” actually does start to look a little more like a pause.
Nancy C.
You present the oddest approach to determine whether the “pause” does or does not exist – your quoting of the IPCC citing past projections of temperature rise that had already happened in 2007 when the IPCC cited them – all this palaver when surely the question is not whether the “pause” exists but its significance.
(Or perhaps ‘significance’ is what you mean when you ponder “‘the pause” look[ing] a little more like a pause.”)
To keep it simpler, I will stick with GISS data.
The graph in the post above does indeed show the trend 1979-97 of 0.13°C/decade. If the trend is calculated for later 19-year periods, it quickly steepens to values above 0.2°C/decade and is still above 0.2°C/decade for 1992-2010. It has dropped well below 0.2°C/decade in the last 3 years, and that is reassuring. It shows there is a “pause” as even the likes of Jim Hansen has been telling us. And it also reassuringly fits the analysis in the post here which, because most of the data points are above the red projection line, suggests there has been an acceleration since 1998 (rather than it being flat for 15+ years as denialists like Lindzen & Curry are wont to tell folk).
Indeed, my own analysis of GISS data (usually 2 clicks to ‘download your attachment’) shows acceleration followed by a “pause” which appeared on the global temperature record in mid-1997 (ie when the red trace peaks).
But what of the significance of the “pause”? Foster & Rahmstorf (2011) show it disappears if the ENSO wobbles (along with volcanic & solar wobbles) are smoothed out, and that remains so as of 12-months ago.
Denialists such as Lindzen & Curry who cite Wyatt, Tsonis or Zhou&Tung in front of senatorial & parliamentary committees are entirely wrong in suggesting the “pause” is a repeat of the 1940s wobble. If ENSO smoothing is repeated using the available data (see main graph in KKTung comment here), unlike the “pause”, the 1940s wobble remains. There is thus no evidence that attributes the “pause” to Stadium Waves, Synchronised Coupled Events or the AMO, or any other daft denialist flight of fancy..
Corrigenda – “mid-1997” should read “mid-2007”
Al, I largely agree with you. What it “looks like” is just what I meant to say, because the only significance of any of this is “what it looks like”. The original post by Tamino, I think, was to some extent making that point as well. But I thought it was a little sketchy that while possibly trying to make hay of how a well placed trend line can make an effect appear to come into being (the flat line of “the pause”) or disappear (as it does here), he neglected to mention that the trend he used to do his work was so shallow that, in any other context, he or any of his regular readers would instinctively argue against it, which actually happened in responses to my original comment. Also, while he couched his argument in the form of “what you would have expected”, we all know few people at the time were projecting or expecting anything like that shallow.
In any case, the data is the data regardless of what line you put through it, and it’s certainly warmer now than it was in 1980. I guess there’s a semi legitimate point to looking for a trend though, if you want to try to use it to make statements about what the future might bring about, so let’s talk about the future. I’d say that, if you expect the trend to quickly revert back to something like 0.2 or more per decade, then in 30 years, looking back at the data, the last decade or so will in fact look an awful lot like “a pause” (as even Jim Hansen says, though Tamino argues back above), with the last several years dipping significantly below the general trend line. On the other hand, Tamino’s point could remain valid into the future only if the trend continues at a shallow slope. In that case “the pause” will keep looking like it fits right into the trend or possibly you’ll even see a little bulge above the trend in the early 2000’s, just as you see in Tamino’s graphs. But if Tamino’s un-pause turns out to be real, he won’t be getting the future warming I think he actually “expects”. You can’t have your cake and eat it. Either the trend is high with a pause, or pauseless but lower.
If Tamino had more explicitly couched it that way and mentioned that the trends he used were lower than you’d realistically expect, the post could have been focused on how a bunk trend line can make date “look like” something it may or may not be. Instead, I think it reads like about third that and two thirds a literal attempt to say there’s no pause. I think he shoots himself in the foot a little with that second thing.
[Response: Look at the second graph in this post (recent data, but with no adjustments for el Nino southern oscillation/volcanic aerosols/solar variations). The cutoff for making the extrapolation is set at the year 2000.0 (no cherry-pick, no “to illustrate” pick, just because it’s a nice round number). The extrapolated trend is 0.016 deg.C/yr, which is slightly less than, but statistically indistinguishable from, the trend when one includes data up to now (0.017 deg.C/yr).
A similar result follows from using the deniers’ choice, using data through 1998 for the trend calculation and extrapolating that from 1999 through to the present.
Consider this: when you add the data since the supposed “pause,” but doing so makes the estimated trend larger (albeit not with statistical significance), what does that say about the “pause”? Because that is the real “post-1998 surprise.”
Let’s also be clear that the existence, or not, of a genuine “pause” has nothing to do with warming rates forecast by the IPCC reports.]
Nancy C,
I see no ‘shooting in the foot’. The “pause” as wielded by denialists is poorly defined to the point of being non-scientific. When they do define it, they stray from reality. Curry’s 15+ year ‘no significant warming’ is nought but a fantasy. Yet she happily tells an official enquiry there is such a thing. And that is what this post is about. Perhaps you should read the title.
The fantasy 15+ year “pause” can also be confused with the ‘no statistically significant warming over 16 years’ that Lindzen/Watts got the BBC’s Roger Harrabin to throw at Phil Jones. The lack of statistical significance is, of course, matched by the lack of significance of the question itself. (Jones got the answer wrong. The proper answer is “Yes but so what?”)
This post is not about the real “pause” as can be seen in the global temperature record since 2007. Nor is it about symptoms of that “pause” that can be spotted earlier using other evidence. It is about a fantasy “pause” as alluded to by the denialist Curry.
Nancy C:
Whatever you mean by “significantly below”, it’s certainly not statistically significantly below. Statistical significance calculator here: http://www.skepticalscience.com/trend.php
This article appears misleading because it cherry picks the starting point from 1979.
[Response: The point 1979 is not a “cherry-pick.” It’s when the satellite data begin.]
If you examine the entire HADCRUT4 data it is clear there has been a trend change since about 2000. See the real source data from HadCRUT at:
[Response: Moving averages (as shown on that graph) do not necessarily reflect the “trend,” and certainly cannot be used to establish trend changes with statistical signficance.]
Separating the northern and southern hemisphere ice anomaly is also misleading, just as it is misleading to say global warming isn’t happening because the USA is very cold. If you look at the global ice coverage, it has generally bounced back and forth and is currently dead flat for the last 35 years. See:
[Response: Have you taken leave of your senses? The linear trend rate in global sea ice extent is downward at a rate of 36000 km^2/yr, and is unquestionably statistically significant.
And by the way, just because you claim that separating the two hemispheres’ sea ice anomaly is misleading, doesn’t make it so.]
[edit]
[Response: The “Gish gallop” makes you look bad. So does referring to the opinions of Judith Curry.]
Wow! What a pity you are too dim to appreciate the irony of your picking a handle that starts with the word “Reality”.
The only clear thing is that there has been no statistically significant change in trend since 2000 (or since at least 1974). Refer to the calculator at http://www.skepticalscience.com/trend.php for determining statistical significance.
What is the meaningful difference between an average and a trend?
[Response: That’s about all we need to know about your interpretation of the data.]
[edit]
Oh, ouch!
Reply to basicstats (not sure if this post will nest properly).
Yes, I am sure about the calculations. If you go back to the chart I posted earlier and scroll ahead one, you’ll find another chart where I compare the OLS trends for the two different period lengths. The slope is certainly steeper, but the fact remains that the more recent data fall within the projected 2 standard deviations. Compare the location of my 1979-97 line relative to the data points with the chart Tamino posted. Or you could run the regressions yourself…
This might be the shortest first time poster discussion ever on this site. I’m done with your site. It is clear that there is no real discussion about the science here – delete my valid points and execute ad hominem attacks. Of course, if you can’t argue the data then delete it and argue the person. I have more important things to do. Bluster all you want, but remember, reality truly does have a persistent voice. With a super quite sun and negative PDO cycle, there will mostly likely be another decade or two of cooling, and “reality’s voice” will be screaming “there is no AGW.” But at least you all have “true courage!”
http://www.theonion.com/articles/true-courage-is-knowing-youre-wrong-but-refusing-t,33742/
[Response: Here’s your chance to learn something.
When you have to ask “What is the meaningful difference between an average and a trend?” we all know that you aren’t qualified to talk about trends. That’s fine, most people don’t know about that. But instead of asking questions or just raising issues, you came here and made pronouncements as though they were fact, including some rather ridiculous ones (like global ice coverage being “currently dead flat for the last 35 years”). You are in way over your head.
When rebuked for your nonsense, your reaction is to become entrenched in your mistaken notions.
Maybe it’s time for you to show some “true courage.”
As for your departure, so long as you remain entrenched in nonsense beliefs you won’t be missed.]
Tamino: “As for your departure, so long as you remain entrenched in nonsense beliefs you won’t be missed.”
Tut tut, Tamino: you invited these idiots to show up. ;)
C’mon, RHAPV, show us what ya got, buddy!
“With a super quite sun and negative PDO cycle, there will mostly likely be another decade or two of cooling, and “reality’s voice” will be screaming “there is no AGW.””
No, reality’s voice would be screaming exactly what climate scientists have told us for decades:
There are multiple forcings which drive climate, and the climate includes natural variation. The fact that greenhouse gasses like CO2 lead to a warming forcing in no way causes solar forcing to disappear, or natural variation due to influences like ENSO to disappear.
Nor would a quiet sun or a negative PDO cause the increased forcing due to increase CO2 disappear.
Now, why do you think it would?
BTW, if “Reality” believes that claiming that a quiet sun or negative PDO cycle would disprove “AGW” (i.e. much of modern physics) is a “valid point”, thank you for deleting much of his nonsense …
Okay, I’ll continue to discuss things with you all if you agree to discuss facts. Some of you “fired the first shot” with ad hominem attacks, and I just fired back. But if you want to discuss some facts, I’m open to the discussion. I did not come in and kick sand in everyone’s face. I just pointed out that this article is misleading and why I think it is and I backed it up with data. You denied the data but didn’t provide alternate data to disprove my position.
What do you guys want to discuss — linear trends versus moving averages? General data smoothing? Least squared curve fit to an N-th order polynomial? Kalman filters, covariance matrices, and uncertainty propagation? I’m game. But I really don’t think those technical details really matter much as the real question is whether or not there is a pause in global temperatures. Any 5-grader looking at any of the temperature data sets can see that the temperature profiles have significantly changed. I can show either warming or cooling using moving averages or linear trends just by changing the duration of the data. This means a trend line and a moving average are both unimportant since they are so dependant upon the duration. Cherry pick the duration and you can say whatever you want.
The important question is what is causing the current pause in temperatures, both global air temperatures and global sea surface temperatures, and whether or not the 15 year pause is meaningful or not. I believe the pause does show the errors in the climate models and perhaps some weakness in the AGW argument. After all, all of the warming identified by the IPCC as being likely man-made, occurred from 1975 to 2000 – a scant 25 years. The pause is almost as long, so something is not well understood by climate scientists.
As for global sea surface ice, I provided the link that clearly shows that global sea ice is the same as it was 35 years ago. Your position that is decreasing by 36,000 km^2/year is for the Arctic area only. Globally, sea ice has been very consistent, varying by no more than 10%. Even this site shows that the Arctic region has decreased and the Antarctic region has increased. Add them together and you see that global sea ice is the same today as it was 35 years ago. Don’t accuse me of “becoming entrenched in mistaken notions” especially when you do not back it up with hard observational data.
Finally, claiming that disproving AGW means disproving much of modern physics a just plain false. Physics is mathematical models of observations. There is nothing about AGW that is defined in physics, but instead we use physics and mathematics to try to describe AGW. As a case in point, what laws of physics define cloud formation? Given the various cloud types, show me an equation or some laws of physics that describes their impact and how various factors influence them. It should be entertaining to watch dhogza try.
[Response: I work very hard — hell, I put in a tremendous amount of effort here — to (among other things) disavow people of misconceptions. That doesn’t mean I don’t have misconceptions of my own … but I do have genuine expertise, some think I have a gift for explanation, and helping people gain insight is just plain worth doing. Lord knows I ain’t gettin’ paid for this.
But you are so strongly attached to ideas that are wrong, on topics that are so fundamental, that just to get you to “square one” is more work than I’m willing to expend. If other readers want to try, good luck.]
Reality: “Physics is mathematical models of observations. There is nothing about AGW that is defined in physics.”
To put the two together, “There is nothing about AGW that is defined in mathematical models of observations.”
HITRAN much?
Reality: “global sea ice is the same today as it was 35 years ago.”
No, for a brief moment, global sea ice area adds up to nearly almost the same total. The character of the sea ice is radically different. What conclusions do you draw from this brief moment? More importantly, will the logic you use to reach those conclusions hold when global sea ice once again drops way down? You must have gone to the Steve Goddard School of Statistical Mayhem.
Reality: “But I really don’t think those technical details really matter much as the real question is whether or not there is a pause in global temperatures.”
So trends and averages don’t matter, but the “pause” does? How do you manage to define “pause” without determining trend? And what do you mean by “global temperatures”?
I’m guessing that “reality” is an electrical engineer, as he professes familiarity with a number of concepts he doesn’t really understand.
OK, “reality”, let’s play. Probably THE fundamental physics wrt climate change is thermodynamics–specifically the first law or conservation of energy. I hope that you would agree that if the energy in the system–the entire system–is changing, then the system is NOT in equilibrium. The climate system has a number of components–the cryosphere, the atmosphere, the oceans, etc. Picking any single component and looking for a trend is cherrypicking if the same trend is not found in the rest of the system. Would you not agree?
So the fact that temperature in the atmosphere–about 2% of the thermal mass of the climate system has been slower in its RISE (not fall, not stagnation) even as the temperature rise of the oceans has actually accelerated in no way indicates the warming has stopped or even slowed down.
In addition, we have Cowtan and Way (2013) and Foster and Rahmstorf (2011) that show us that it is not a matter of the energy into the system decreasing, but rather where the energy is going. That is interesting–very interesting–for those seeking to understand climate. It has zero bearing on the severity of the crisis we face.
Might I suggest that you ought to look at ALL the evidence, rather than one graph.
The very first thing you have to establish before you can discuss “what is causing the current pause in temperatures” is that there IS in fact a “current pause”:
–HOW have you established it?
–Have you examined the distributional characteristics of the various temperature series?
–How does this “pause” compare to, oh, say, the probability of getting 3 or 4 heads in a row?
–Do you know how to control you alpha level when you start your analysis from a post hoc CHOSEN point?
–Have you done so?
I could go on, but Tamino can go much farther, much more clearly.
If the entity calling themselves “Reality Has A Persistent Voice” is still on planet Earth, it would be worth its while explaining the first bold assertion it made in this comment thread. We were told to “examine the entire HADCRUT4 data [where] it is clear there has been a trend change since about 2000″ and were pointed at this graphic. Could this Persistent Voice Of Reality say when exactly “there has been a change of trend”? How long ago it was, to the nearest year? That shouldn’t be too much to ask, should it?
And then that Persistent Voice could then tell us what is written in the comment that my statement here is replying to, where the Voice writes about whether some pause or other is meaningful or not, the bit where it mentions a number of years.
And that done, even if the Voice is incapable of basic arithmetic (and that does seem likely), we will be able to calculate how accurate (or not) the data is that this Voice presents to us here.
This is the same Voice that writes “something is not well understood by climate scientists.” If this quote is not a typo, I myself wonder whether it might just be a case of the dirty old pot calling the squeaky-clean & shiny electric kettle black!
“Virtual Reality is Insistent”
— by Horatio Algeranon
The Pause is real
But trends are not
And averages, I feel,
Just don’t mean squat
Don’t ask that “Pause”
Should be defined
That physical laws
Should always bind
Oh dear. It really doesn’t get it.
There is no hiatus, no pause in global warming.
http://www.sciencecodex.com/pacific_trade_winds_stall_global_surface_warming_for_now-127569
http://www.nature.com/nclimate/journal/vaop/ncurrent/full/nclimate2106.html
The surface temperature record reflects the noise inherent in climate, and the impacts of that noise affect the surface temperature record more than other measures, and by different amounts over time, but the implacable physics remain.
The planet is inexorably warming, human carbon emissions are the cause, and these days it’s only ignorants and inactivist denialists who claim otherwise.
Take your pick.
“… what laws of physics define cloud formation?”
Start here.
“Reality Has A Persistent Voice” …
Looks like we have another self-declared expert more knowledgeable than an entire field of science on our hands …
“I can show either warming or cooling using moving averages or linear trends just by changing the duration of the data. This means a trend line and a moving average are both unimportant since they are so dependant upon the duration.”
You’re a casino’s slot machine parlor’s ideal customer …
” Don’t accuse me of “becoming entrenched in mistaken notions” especially when you do not back it up with hard observational data.”
The mistaken notion is that scientists expect the artic and the antarctic to react to global warming in the same way, i.e. declining sea ice. That has led you to an even greater mistaken notion that reasonably accurate long-term predictions by science means that the underlying science is wrong. That is a concept I’ve never been able to wrap my head around.
Why don’t you explain to us here idiots, using that big brain of yours, why reasonably successful predictions represent failure on the part of science?
And while you’re at it, after looking at a map of the globe, explain to us why *anyone* would expect the two regions to react in the same way to warming temperatures? Everything else imaginable about weather and climate conditions differ between the two regions, after all …
I’ve never understood this expectation. Can you explain, in your own words, why I should expect the same sea ice trends to arise in the two regions?
I think we’re making some progress on understanding, but I think it will take a little more effort on all of our parts to close the gap. You do have mathematical expertise and write very well, so all we need to do is see if we can understand each other’s point. I think I understand yours, but clearly you do not understand mind. I’ll accept the blame for less than perfect communication. Furthermore, I am not trolling to whip up an argument for trolling sake; I am arguing against specific points about this article, namely appropriateness of linear trends, and that global sea ice extent (not just the Arctic region) is dead flat.
Liner trends are fine when the data is mostly linear. Climate temperatures are not linear, they are cyclic, or at least they have been for millions of years. Proof: see the cyclic periods of ice ages. They come and good very regularly. See the annual seasonal cycles, they come and go regularly. See the 11-year solar cycle. Observe most anything in the universe and it has angular momentum and is spinning, which is a cycle. You have a sleep cycle, women (and men) have hormonal cycles. Most everything is cyclic. Trying to fit a linear equation to cyclic phenomena is simply not appropriate. If you fit a line through sin(theta) where theta is from pi/6 to pi/4 you get a nice line with a steep slope. If you fit from 0 to 100pi, then the equation is Y=0. Clearly the fit from pi/6 to pi/4 is wrong because it is too short. In smoothing temperature data to reduce signal noise then a moving average is better than a linear trend because it responds more quickly to changes (which are not linear!!!!). A least squared curve fit of at least a 3rd order polynomial would be better than a moving average.
Global sea ice extent: Look at this chart from Cryosphere:
See the red part at the bottom, this is the anomaly from the 1979 to 2000 mean. Today it is zero! In 1980 it was zero! That is 35 years of dead flat. The anomaly has been above and below the zero line since 1979. There is no global sea ice loss! If you disagree you have to show me some data and you source. There is loss in the Arctic region but there is huge gain in Antarctica. Together, the global sea ice is fairly stable.
Finally, as for the side argue about physics baited by dhogza – I have a physics degree so I understand physics. Let me just try to say it this way: the trajectory of a flying object follows a parabolic arc (in a vacuum) and we use the mathematics of a parabola to describe it. The object doesn’t follow the parabolic because of the math (y = x^2). This equation is very good at describing the path of a thrown object on the moon, but not very good on earth because of atmospheric effects. This lack of “completeness” of the physics is my primary issue with AGW predictions – I am certain that climate models (at least the source code I’ve examined in GISS ModelE) do not capture very important parts, namely clouds and evaporation effects as they are exceptionally dependent upon many factors that are too small to model. The climate models run on huge grids in excess of 150km by 150km, and the small and medium effects are “parameterized” with as Dyson Freeman say, by “fudge factors”. These effects can’t be modeled in a GCM, so they do the best they can using parameterization, but that, in my opinion, is the problem with their predictions. The average and parameterization in these areas are simply not accurate, and this is why the climate model forecasts did not forecast the pause and are departing observations.
Reality,
The value for today on the ice graph you link is -0.24 mkm2, that is less than zero (you claimed the value was zero). It has substantially declined the past few weeks and the resolution of your graph is difficult to read. Using my eyeball, for the past 5 years about 80% of the time the anomaly has been below zero. For the first five years 80% of the time the anomaly was above zero. The trend is obviously declining. I suggest that you take Tamino seriously when he runs the data and says it is declining at 36,000 km2 per year, and is statistically significant. Deniers like to eyeball this graph incorrectly. Perhaps you should read Tamino’s post on tiny graphs.
Do you realize what you look like when you claim Tamino’s calculation is not as accurate as your eyeball estimate? Perhaps it would be better for you to ask how Tamino did his calculation (which you do not understand), rather than claim he made a mistake. Perhaps the problem is not Tamino’s calculation but your understanding of basic statistics.
Really Pestilent Voice,
You tell us you are not trolling. May be you felt your startling grasp on things climatic would amaze us. May be you’re a born show-off. But definitely you are either truly courageous or exceedingly stupid.
Shall we put the global sea ice extent to bed. Now I know you have an aversion to linear trends but do bear with me here as this is the NSIDC – the horse’s mouth. Over the entire satellite record, Nov 78-Dec 12, the Arctic Sea Ice Extent anomaly has decreased faster than the increase in the Antarctic Sea Ice Extent anomaly. As these two quantities are added together to obtain the global Ice anomaly, and as is one decreasing over twice as fast as the other is rising, what do you think the global ice anomaly is doing?
And what of your cycles? Yes, a sine wave from 30° to 45° is reasonably straight. And so is a sine wave over 1800°. However I see you disagree. You want to leave the little bumps even though they are just bumps along the way. Cycles are indeed common. But they are not everywhere.Once they have been identified and accounted for, snip, they can be done away with. Or do you disapprove of climatologists using annual anomalies?
And your pronouncements on GCMs: if you have difficulties coping with the stuff in the two paragraphs above, likely you won’t have a clue with GCMs so I shall take you there.
BTW, global ice area is currently 11th lowest in the satellite period. For this date, 1979 was 35th lowest.
And after 2013’s Goddardian Recovery, Arctic sea ice area is now 2nd lowest for this date.
Good Lord! You define a trend as “flat” when one of the lower points in the early part of the distribution matches one of the highest points in the latter part of the distribution???
You need to consider establishing trends by calculation rather than by your magical calculating eyes.
Your physics degree really, actually led you to this form of reasoning???
Reality Has a Persistant Voice,
I know next to nothing about statistics, I couldn’t tell a least square curve from a Kalman filter if you slapped me arounnd the face with them.
However even I know that when you point to that Cryosphere chart, the red part at the bottom is full of information about sea ice area and that if you want to say anything about sea ice area over the last 35 years you can use that information.
You however have chosen to pick two tiny bits of information that help your argument and throw out all the rest of the information, I can but assume because it doesn’t help your argument.
Now if you really know anything about statistics you would know this, so either you are even more clueless than me, or you are knowingly trying to pull the wool over people’s eyes.
To put it more bluntly you are either very stupid or very dishonest.
I would love you to tell us which it is.
Fred
“Finally, as for the side argue about physics baited by dhogza – I have a physics degree so I understand physics.”
You didn’t address my point regarding geographical differences between the north and south poles at all, nor did you answer my question, “why would you expect these two regions to respond equivalently to global warming in the first place?”, nor did you answer my other question as to why a reasonably good fit to scientific predictions dating back to the 1980s serves as evidence that the science underlying those successful predictions is wrong.
Typical denialist …
“Liner trends are fine when the data is mostly linear. Climate temperatures are not linear, they are cyclic”.
There’s no reason why cyclic data, over many cycles, can’t be fitted with a linear trend if, indeed, the underlying trend is linear.
More to the point, suggesting that a linear trend isn’t a good approximation to temperature changes over a couple of centuries because of Milankovich cycles which are tens of thousands of years in length is simply stupid, physics degree aside (mine is in mathematics). Our host himself has pointed out that climate data fits a linear trend only over relatively short timeframes (in geologic terms), but is a good approximation over the length of time covered by the instrumental record.
Geez, one look at the hockey stick history of paleoclimate is enough to show that 1) linear regression isn’t appropriate over all timescales and that 2) climate isn’t nearly as cyclic as you appear to believe.
Regarding climate models such as NASA GISS Model E (I’ve looked at the source code and underlying technical papers, too) yes, they are not able to model clouds directly due to the large grid size they must work on in order to generate results in reasonable time (runs measured in days and weeks rather than months and years of ocmpute time, even on the largest of supercomputers).
This is the one reason why it has been difficult to pin down climate sensitivity to a range narrower than 1.5-4C or so.
Climate science 101, you’re not stating anything new. You don’t need to read the model sources nor underlying papers to realize this. It’s not a hidden dirty secret.
“The average and parameterization in these areas are simply not accurate, and this is why the climate model forecasts did not forecast the pause and are departing observations.”
Individual model runs do show lengthy runs of flat and even declining annual temperature which fits natural variation quite well, so I really don’t know what you’re talking about. I will be gracious and rather than claim that you’re lying, will suggest that you’ve never bothered to look at the output of a large suite of individual runs, but have only looked at model ensemble output.
The model outputs are generally presented as an average of an ensemble of individual runs (and even ensembles of individual runs from multiple models), in order to remove this variability from the overall picture, because among grownups it is understood that 1) the long term trends are what we’re interested and 2) the coarseness of our measurements of initial conditions combined with a finite modeled grid size means that models can not predict precisely when and how temps will vary around a trend in the real world (they can, however, by being run many times, give us a good idea of the *magnitude* of that variance, including how many years of flat or declining temperatures we might expect to see pop up from time to time).
“The average and parameterization in these areas are simply not accurate, and this is why the climate model forecasts did not forecast the pause and are departing observations.”
1) Temperature trends over the long term fit within the 95% envelope of model predictions which has been shown by many people, many times.
2) Earlier this century, there was a solar minimum. Models don’t incorporate any prediction of variance of TSI in projections because a) solar science gives no guidance here and 2) it’s not of interest given the problems the models are built to explore for reasons that should be obvious.
3) We’ve been in a period of extensive La Niñas, which serve to transfer heat from the atmosphere to the oceans. The surprise, if there is any, is that the last decade is the warmest in recorded history *despite* continued La Niñas, and that 1998 is no longer the warmest year on record despite its being a year for a monster El Niño and the year that broke it being a La Niña year.
Our host has co-authored a paper showing that when ENSO, volcanos and TSI are taken into account, warming has been taking place just as we expect from theory.
“pause blah blah blah pause blah blah no CO2 warming blah blah” can be boiled down to a single misstatement of fact that’s never been part of climate science:
“CO2 is claimed to be the only driver of climate (false) therefore any slowdown in warming disproves climate science”.
Regarding parameterization of cloud effects, yes, Dyson and you and others claim that the parameterization is wrong, and since it is wrong it must be wrong in the wrong direction (i.e. exaggerating sensitivity). It escapes your attention that it could be wrong in a way that minimizes sensitivity, or that while wrong, it could be minimally wrong in a way that doesn’t really matter. Best evidence is that it doesn’t really matter, and best evidence is that cloud feedbacks are at least neutral and most likely somewhat positive, which destroys denialist claims about cloud feedback.
There are too many things going at once (dog piling), so I’m going to address only one at time. I tried to address several things in my last post and that just stirs up too much at once. My bad. Let’s cover global sea ice extent first: I stated that in 1980 the sea ice extent was zero and today it is zero, which is 35 years of dead flat. I stated nothing about a trend line through the data. I only talked about the amount of global ice in 1980 and the amount today.
Examine the zero line and note that it is the average from 1979 to 2008 (as stated on the chart). For the entire year of 1980 the average is about zero. It started at about -0.5 went as low as -1.2 and as high as +1.5 and ended near zero again. The years from 2006 to 2012 were unusually low, down to -2.5 at the lowest, and there was tons of press about the end of all the ice. All the AGW/CAGW people were making a big deal out of it. From the fall of 2012 to the beginning of 2013, the ice came roaring back. For all of 2013 the ice ranged from about -0.75 to +1.0.
The amount of ice for all of 2013 is essentially the same as the amount of ice for all of 1980, and both years are average with respect to the mean from 1979 to 2008.
I understand why you want to use a trend line, and that’s because the low years from 2006 to 2012 skews the fit downward. Even if the ice returns to normal for a decade or two, the linear fit will remain negative – that’s just the nature of a linear fit to non linear data. This means that a linear trend really is not meaningful because it is very slow to respond to changes in the data. That’s my whole point linear trend lines, and that’s the reason AGW people want to use it. Even if the data returns to normal, you can claim the trend is down for ice.
Al Rodger, I see your chart ends Dec 2012, and is out of date. Here is the most up to date data.
The southern hemisphere is building up massive ice. Currently it is +0.879 from the 1979 to 2008 mean. See:
In the northern hemisphere the ice has stabilized and appears to be returning. Currently it is -1.119 after lows that were way down to -2.8. See:
The very first value listed in the data file is +0.624. The very last value listed in the data file is -0.299. Therefore global area has decreased by 0.923 million. End of discussion.
Reality, since you are arguing that arctic sea ice has truly recovered to normal levels and nothing remarkable has occurred over the last thirty years, you must be confident sea ice volumes are looking equally rosy. So far you’ve ruled a line from data point to data point on only the extent anomaly graphs. Shouldn’t we try that technique on the volume chart?
See here:

Or do you think the volume of ice, the thickness of the cover, is irrelevant when it comes to the summer melt season?
Your ability to divine–and I mean that word literally–the state of a noisy system by referring to a few selected points is utterly amazing.
More amazing would be to look at all the data collected, but I doubt you will amaze us to that degree.
I will agree–since I live near the edge of the ice pack and sail in the North Atlantic in the summers–that in the height of winter in the north, the value for the amount of ice largely “stabilizes” most every year (and we see this same comment year after year about this time). Since you are a physicist, see if you can come up with an explanation for this. Hint: Compare the magnitude of the effects of the annual cycle in a mostly bounded basin to the magnitude of the observed trend.
Hey unreality while we’re at it, why are you starting at 1980? What did you do with the year 1979 data? Looks like you just made it disappear because you don’t like the result. I call that dishonest.
When somebody is in true denial like our Voice here, they will tend to show a certain behavour that creates a characteristic form of argument. They will, for instance, insist that climate science is total pants because evidently (1) there has been a 15 year pause in global temperature and (2) the global sea ice area/extent anomaly is positive – there is more ice not less.
In reply to this nonsense, the denier will be given (with varying levels of snark) any number of reasons why these assertions are complete codswallop. And that should be ‘end of argument’ but denialists are in denial.
So the denialist will pick up on one tiny thing to hang on to. They may decide that a graphical representation has yet to be updated with last year’s data and so this makes it entirely invalid as evidence because it is out of date. And they may then point to a spanking up-to-date graphic or two that, well, they don’t show what the denialist said but they do show, say, that on one of the graphs the lowest point is lower than the most recent data point. So the denialist proclaims this proves the point. The most recent data point is higher which sort of shows the type of thing they were trying to argue. For the denialist, the harsh reality of the 12-month-old data has thus evaporated in a soothing fuzz of the cherry-picked moment of today. Happiness has been restored as it always is. Bless.
So is it cruel to jolt the fool from his deluded state?
Or perhaps we should ignore the fool who does admit he has difficulty in explaining himself (to the point of fault, apparently) and instead examine what Deny-o-sphere Today is getting so exercised about. That might be more interesting.
I do have a history of saying this – “This sea ice graph sucks.” And indeed that Cryosphere Today global anomaly graph is pants. The global anomaly has annual characteristics and their graph is mixing the long-term anomaly trends onto those annual characteristics and creating a right mess.
So here is the data as a 12-month rolling average (Usually 2 clicks to ‘download your data’).
I suppose the most prominent feature of that graph is the trend that shows over a million sq km of ice lost, mostly in the last 15 years.
But what do I know. If you live on Wattupia the big big feature staring you in the face is that most recent peak (yes it peaked a few days back) that was the highest peak for over a whole decade. Golly, that’s more than 10 years. It got back to the values commonly seen in 1980s dips. That’s got to be worth something. That’s got to be proof positive that climatology sucks. And it likely shows physics is not all it’s cracked up to be. At a squeak it might even give those smug mathematicians with all their poncy numbers and iddy-biddy eekwazions something to think about. “Long live stupid!!”
Thank you for entertaining us with world-class idiocy.
And here for a moment I thought you were going to at least *try* to make a serious argument.
“I found two points with equal values, therefore nothing has happened”.
Sheesh.
So basically you think 2013 was a “recovery.” A single year. And no discussion whatsoever of physical mechanisms. No discussion of why you think the ice could possibly “return to normal.”
You also claim that the Arctic has stabilized. No, unless you mean it continues to deteriorate. Despite 2013’s “recovery,” Arctic area is on the verge of becoming lowest in the satellite period for the date.
Extreme Arctic + extreme Antarctic = normal
I love that argument. It’s like saying there’s no hunger in the world because there are more obese people than hungry people. :-D
The important question is what is causing the current pause in temperatures, both global air temperatures and global sea surface temperatures, and whether or not the 15 year pause is meaningful or not.
What do you think is causing it? Could it have something to do with La Niña dominance, low solar activity, negative PDO, BRIC countries spewing large amounts of aerosols? Why have all these factors combined only caused a slowdown in warming, instead of a clear cooling? What if these factors flip to the other side again?
So, Reality, you have taken last year, looked for a year that seems about the same as it, thrown out 33 years of data and then said “35 years of dead flat”. Do you really think that standard of analysis is going to cut much ice on a blog hosted by a statistician?
Fred
The logic behind (Arctic decrease + Antarctic increase) = no change/problem reminds me of the old joke about a recent statistic survey showing that the average person has one breast and one testicle….
Reality says,
” … the trajectory of a flying object follows a parabolic arc (in a vacuum).”
Uh, no. In the ideal case, a flying object follows an arc that is a segment of an ellipse, because the Earth is not flat. In addition, the Earth’s gravitational field is neither uniform nor static. Hence, the GRACE satellites.
Geophysics is hard.
“Scepticycles (2)”
— by Horatio Algeranon
The argument’s sceptilliptical
And comes back to it’s start
It’s really quite predictable
Can graph it on a chart:
“It hasn’t warmed…
The warming’s small…
It’s stadium-formed…
Not there at all.
As of today Global SIA is -0.3657747 million km2.
OMG, it’s CAWG! :-P
Wow, you guys are impressive, mostly no substance and lots of insults. If you can’t argue the data then argue or insult the person.
First off, I fully admit I can be dead wrong about many things, and I admit I may be wrong about AGW. Personally, my position on the matter is that most of the warming is natural and that CO2 has caused some warming (about 1W/m^2). The cause is uncertain since determining causality is extremely difficult, but in the end I think the true cause of the recent warming will be shown to be amazingly complex, solely because the climate is extremely complex. Causality requires tight controls to isolate variables, repeatability, and often requires double or triple blind statistics to attempt to reduce researcher bias. None of these controls are possible with the climate.
Again, my original statement was:
“Separating the northern and southern hemisphere ice anomaly is also misleading, just as it is misleading to say global warming isn’t happening because the USA is very cold. If you look at the global ice coverage, it has generally bounced back and forth and is currently dead flat for the last 35 years. See:
http://arctic.atmos.uiuc.edu/cryosphere/IMAGES/global.daily.ice.area.withtrend.jpg”
I have shown that to be correct. Some of you knit pick things and try to put words in my mouth, but you cannot refute the data. Hence, reality has a persistent voice. Catchy, eh? I do like it, and it is completely true.
Just look at the beginning of the chart – Jan 1st,1979. Global sea ice was +1.0. On Jan 1st 2014 it was +1.0. How is that not dead flat over the last 35 years? The total amount of sea ice today is the same as it was 35 years ago. Just accept it and move on. I understand it doesn’t fit your CAGW meme, but my statement is 100% true. Arguing otherwise is idiotic. Sure you can try to argue trend line or spin it this way or that, but my original statement is 100% ironclad true.
Jpcowdrey, what is your background? I think you may be trying to say that the earth is an ellipsoid, which I agree, and it is commonly represented by the WGS84 ellipsoid (http://en.wikipedia.org/wiki/World_Geodetic_System). In spherical geometry the shortest path between two points on the surface of a sphere is called a great circle (http://en.wikipedia.org/wiki/Great_circle), but on an ellipsoid the shortest path along the surface is called a great ellipse. As for an object’s trajectory on the earth without an atmosphere, the arc would in fact be a parabola. The projection of the arc on to the ground would be a great ellipse, but the actual flight path would be a parabolic arc. For the purposes of my discussion, a local level coordinate system is more than adequate and the changes in the gravitational field can be ignored over short distances (a few kilometers). For long range ballistics, the gravitation changes may have a very small effect, but the corilis force (http://en.wikipedia.org/wiki/Coriolis_effect) would dominate any gravitational variance.
Some of you ask fair questions, and I will address those tomorrow.
[Response: First, warming isn’t measured in W/m^2. It’s measured in deg.C (or K or deg.F). W/m^2 is usually used to measure climate forcing, and the climate forcing due to CO2 increase since pre-industrial times is not in dispute, it’s around 1.8 W/m^2. There are a lot of other forcings besides.
Second, go look at this. I expect you to reject it, in fact I’d bet on that, but at least you can’t say we didn’t show you.
Third, the trajectory of a ballistic object moving at less than escape velocity on a spherical (no ellipsoid required) planet without atmosphere is an ellipse. It’s called a “Kepler orbit.” It’s only a parabola if the object is travelling exactly at escape velocity, while if it exceeds escape velocity the trajectory is a hyperbola.
And by the way, the “coriolis force” isn’t a force at all, and has no effect on the trajectory — none, zip, nada — it only influences the perceived trajectory of an observer rotating with the planet.
Some might think me unkind to allow you to continue embarrassing yourself. But my regular readers haven’t been treated to so much amusement in quite a while. If you choose to regard that as an insult, I can live with that.]
“Some of you knit pick things and try to put words in my mouth, but you cannot refute the data.”
Dude, you’re having that data thrown in your face, like egg. Global sea ice area is currently 11th lowest. Arctic sea ice is currently 2nd lowest. Are you Tim Curtin in disguise?
“As for an object’s trajectory on the earth without an atmosphere, the arc would in fact be a parabola.”
This explains why your beliefs about climate science are so off target…
OK, “Reality”, you say it’s all too complex. Meanwhile, the actual scientists are piecing together the puzzle. You may not like the answers they get, but nature doesn’t really care what any of us like. Now you can either keep opposing the scientists or you can learn how they are doing what they are doing. Your choice.
RHAPV: “Personally, my position on the matter is that most of the warming is natural and that CO2 has caused some warming (about 1W/m^2).”
RHAPV: “The cause is uncertain since determining causality is extremely difficult.”
And said with a straight face. No reference to the existing literature. Shorter RHAPV: “I think that I feel my position is personally that most of the warming is natural, maybe 1W/m^2. I don’t know why, and it doesn’t matter because climate is too complex for me to understand. However, you people are so wrong.”
Hey RHAPV, how can there be warming if the Arctic isn’t melting? Does “natural” warming have a special deal with the Arctic? Your physical model, extrapolated from what you feel must be reality (at least in your public comments), is incoherent.
Just look at the beginning of the chart – Jan 1st,1979. Global sea ice was +1.0. On Jan 1st 2014 it was +1.0. How is that not dead flat over the last 35 years?
But if you look at the latest date it’s 15.54 million km2, whereas in 1979 on the same day it was 16.68 million km2. How is that not a difference of over 1 million km2? Just accept it and move on. I understand it doesn’t fit your CAGW meme, but my statement is 100% true. Arguing otherwise is idiotic. Sure you can try to argue trend line or spin it this way or that, but my original statement is 100% ironclad true.
—
Haha, this is so childish. Tell me you’re just joking, RHAPV. :-)
Your problem is that you DO “look”. And, you “look” at a graph which hides the “look” of the vertical trend with a very small y range.
Try using math instead. You say you have a physics degree after all–though so far what you’ve shown suggests you ought to ask for a refund. Or, at least “look” at the more appropriately scaled graph tamino suggests.
BTW: Could you specify why one would try a triple blind experiment in any area of physics or are you just throwing out big words again to look smart? Blinding is commonly used in physics but certainly not any classic triple trial that I know about anyway. And of course you know that according to recent best practices (CONSORT), terms such as single, double and triple blind are not considered appropriate in any case by those who actually use blinding in trials.
JGarland, I must have missed something. Where did “Meat” claim to have a physics degree?
This claim is made in this comment (ist sentence, last paragraph). With the evidence here for such a profound failure in teaching, I would suggest asking for a refund of the fees.
Snarkrates, see here: https://tamino.wordpress.com/2014/01/30/global-temperature-the-post-1998-surprise/#comment-85144
“Finally, as for the side argue about physics baited by dhogza – I have a physics degree so I understand physics”.
About one second before making his trajectory gaffe.
Where he makes a statement in which he shows he knows no physics as known since Newtron:
“…Finally, as for the side argue about physics baited by dhogza – I have a physics degree so I understand physics. Let me just try to say it this way: the trajectory of a flying object follows a parabolic arc (in a vacuum) and we use the mathematics of a parabola to describe it…”
Reality knows no bounds, although the causation is evidently stupidity. Consider the following:-
“…but I think the true cause of the recent warming will be shown…”, a statement closely followed by “Causality requires tight controls” of which “None of these are possible with the climate.”
So the causes of recent warming will be shown even though requirements to achieve such a knowledge are considered impossible.
And the “original statement was:” actually to do with alleged cherry-picking of HadCRUT4 data. Perhaps the memory is a bit hazy – too much blather, too little attention.
The statement described here as the “original” and said to be “100% true”, dear me, does it merit such a descriptor?
“If you look at the global ice coverage, it has generally bounced back and forth and is currently dead flat for the last 35 years.”
That we look must surely imply that the ice coverage under discussion is the 35 year record presented. So how can it have both generally bounced back and forth and also be currently dead flat for the last 35 years? For this statement to mean anything it must be that the ‘bouncing’ is ‘dead flat’ which is certainly not the case.
If the currently dead flat for the last 35 years assertion is considered in isolation and is referring specifically to today’s daily anomaly, or some other day’s anomaly, being thus equal to a day 35 years ago (as appears to be the case – 1/1/79-1/1/14 being offered as such a comparison), it is difficult to see how the statement bears out. For 1/1/79-1/1/14, the value at the start of the 35 year record is +0.88 & the equivalent 2014 value is +0.63. As these values are in millions of sq km, “dead flat” it is not.
Thank you, gents. If this guy has a physics degree, my ass chews gum. Good fricking lord, the dude doesn’t even realize it’s Freeman Dyson, not Dyson Freeman.
Dyson Freeman is Freeman Dyson’s enantiomer.
One is a world class physicist, the other a disarmchair climatologist.
I will leave “which is which” as an exercise for the reader.
Another reason not to consider the Antarctic Sea Ice gains as a balance for Arctic Sea Ice loss is suggested by a new paper by Holland et al (Abstract). Modeled volume increases down South are but 30 cu km pa, which is 10% of the Northern losses.
That claim has been criticized because ballistic trajectories are elliptical, but actually, “flying” objects (like birds and airplanes) need not follow ballistic trajectories. Normally don’t in fact, unless they have just run into something (building, car etc)
But on the subject of ballistic trajectorieshere’s a paper that analyzes the conditions under which a parabola can be used as a reasonable approximation for the elliptical trajectory.
Therein lies a poem?
hi did you see this Horatio?
[edit]
[Response: We’ve wasted enough time on you. Either you’re not able to learn, or you’re not willing, or both. In any case, your entertainment value as a laughingstock is yesterday’s news.
I suggest you become a regular commenter at Anthony Watts’ WUWT blog. You’re perfect for each other. Then again, some might say that sending you in his direction is the most unkind thing I’ve ever done to Watts.]
“That claim has been criticized because ballistic trajectories are elliptical, but actually, “flying” objects (like birds and airplanes) need not follow ballistic trajectories.”
Not even in a vacuum?
It occurred to me after I posted that that I should have used rockets as the example, but with regard to the trajectory of a bird in a vacuum, there is this
I could be wrong, but I don’t believe that was a ballistic trajectory (though the bird does seem to have gone ballistic)
A ballistic trajectory is defined for objects without propulsion, which would seem to exclude functioning rockets … or bullets inside a rifle barrel.
In other words, a rocket is an example of a flying object that does not follow a ballistic trajectory (not even in vacuum).
No disagreement there.
To pick an entirely inconsequential nit, were the bird or airplane, traveling in a vacuum, tumbling, might not micro-gravitational effects cause slight deviations in their trajectories?
You get a parabolic trajectory if you’ve got a constant force, i.e. you’re assuming a flat Earth model with no atmosphere. While that’s obviously no the world we live in, the parabolic approximation is generally close enough for horse shoes and hand grenades.
“In other words, a rocket is an example of a flying object that does not follow a ballistic trajectory (not even in vacuum).”
Until the rocket motor runs out of fuel, of course …
How typical. You know I’ve made an excellent point, and you refuse to let it through. [edit]
[Response: You’ve had plenty of opportunity to make your “point.” But you’re unable or unwilling to learn. Apparently, you’re not even willing to learn that you are no longer welcome here.]
Btw, RHPV, global sea ice area is currently the 7th lowest in the satellite period.
I got it now. At least you’re saving me a lot of time. You can silence me on your site, which it completely fair — it is your site — but you cannot silence reality — reality truly does have a persistent voice.
As do the voices in your head, apparently.
First you have to listen to it.