
While looking around for tornado data, I found a fascinating page by Harold Brooks in which he builds a model of the likelihood of a “significant tornado day,” which I’ll call an “STD” (yeah, it’s a funny choice). This is defined as a day with at least one tornado of Fujita scale F2 or stronger.
He was interested in studying runs of consecutive STDs. At first, he simply used the bare probability of an STD (which depends strongly on the time of year) to estimate the likelihood of consecutive runs, but it utterly failed to mimic the observed data.
Let’s explore such a model — that the probability of any given day being an STD is simply some constant which might depend on the time of year, but doesn’t depend on what may have happened on other specific days. In fact, let’s start simple by ignoring the time-of-year dependence, studying the model in which the probability of an STD is the same constant for all days of the year. Let that probability be 


Suppose yesterday was not an STD. If today also isn’t, then it completes a “run” — in this case, a run of zero consecutive STDs. The probability of that happening is simply the probability today isn’t an STD, i.e.:

What’s the probability of a run of 1 day (but not longer)? That’s the probability that today is and STD but tomorrow isn’t, which is

The probability of a run of 2 is the probability that both today and tomorrow are STDs, but the day after isn’t:

You probably see the pattern: the probability of a run of
i.e., 

as it must be (whew!).
That gives the complete probability distribution for the lengths of runs of consecutive STDs. But — how many runs will we observe in a given number (
Since a “run of

I’ll leave out the details (feel free to indulge yourself!), also mention that there’s a clever way to get this without any computation at all(!), and just state the result:

Since the average run length is 
Out of those 


runs of length
Example:
Let’s compute an example. Suppose the single-day probability of an STD is 


In a 100-year span, we expect nearly 18000 runs of zero, 5400 runs of one, 1600 runs of two, 483 runs of three, and 145 runs of four. The chance of a run of ten is only 0.11, so only about one year in a thousand will have a run of ten consecutive STDs. The chance of a run of nine is just 0.35, so we might well get one in a century (or we well might not), but the chance of two such runs in a century is less than one out of twenty — ’tain’t likely.
Just for giggles, I ran a simulation of this procedure and observed 17,851 runs of zero, 5428 runs of one, 1635 runs of two, 477 runs of three, 133 runs of four, 33 runs of five, 11 runs of six, and 5 runs of seven. I didn’t get any runs of eight (you’d only expect 1) or longer (you wouldn’t expect any), and all the simulated counts are well within theoretical expectation.
Observed Data:
For actual counts of significant tornado days (STDs), the bare probability of an STD depends strongly on time of year. Here’s Brooks’ estimate:
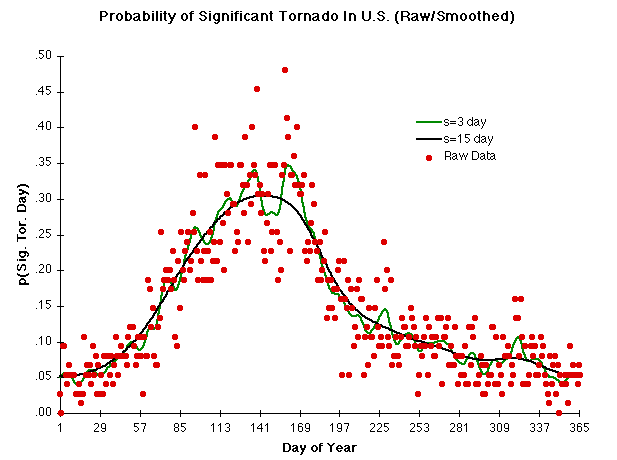
He based this on data from Tom Grazulis’ book Signficant Tornadoes 1680-1991 combined with other data through 1995. I estimated the same thing using data from NOAA-NWS and got this:

Using Brooks’ estimate, the bare probability never really gets much above 0.3 and is well below that for most of the year. Using my estimate, it never gets above 0.4 and is well below that for most of the year. The bottom line is that we should expect long runs of consecutive STDs to be even more rare than indicated by the simple constant-probability model with 
But the observed data show otherwise. In spite of the small bare probability of an STD, in the Grazulis data (used by Brooks) over the last century there are two runs of nine in the data record (15-23 May 1949 and 6-14 June 1967). This is too unlikely to be plausible if the simple independent-probability model is correct.
Incidentally, in the NOAA-NWS data there are even longer runs of consecutive STDs. In fact there are three runs of 12 in the record (May 23 to June 3, 1954; June 7 to Jun 18, 1962; and May 9 to May 20, 1982). Of course, the higher bare probability estimated from the NOAA-NWS model means we should expect longer runs. But using those (time-of-year dependent) figures, the observed number of long runs is still well above what’s expected from the bare-probability model.
We are led to the conclusion that the probability of an STD on any given day isn’t just dependent on the time of year, it depends on something else as well — something which increases the likelihood of long runs of consecutive STDs.
Markov Chain Model:
Brooks was able to mimic observations of long runs of consecutive STDs, by using a 1st-order Markov Chain model. In this model, there are two different probabilities of a significant tornado day (STD) — one which applies if the previous day was not an STD, another which applies if the previous day was an STD. Brooks uses standard notation and calls the probability of STD if the previous day was not “


Both these probabilities are time-of-year dependent, and here’s Brooks’ estimate of the probabilities throughout the year based on the data from Grazulis:
![]()
Incidentally, the other two probabilities are just 

I estimated the same quantities using the NOAA-NWS data, which does seem to give somewhat higher bare STD probabilities. It also gives somewhat higher transition probabilities:

Armed with these estimates, it’s straightforward to run a simulation which estimates the number of runs of any given length
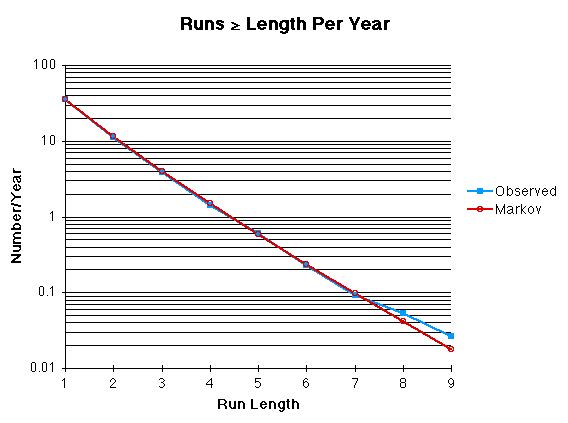
I got this comparison of expected vs observed runs of length

The match is actually quite good. The large visual discrepancy for very long runs is due to two factors: first, the y-axis is logarithmic so small numbers show exaggerated differences; second, long runs are rare so their random fluctuations are larger in proportion to the number of events.
The Markov Chain model actually does give realistic values, but for both estimates (Brooks’ using Grazulis’ data, and mine using NOAA-NWS data) the observed frequency of very long runs is a bit higher than the theoretical estimate. In particular, three occurrences of a “run of 12” in the 58 years of NOAA-NWS data is more than is plausible. It is remotely possible that this is just a statistical fluke, but it’s more likely that the 1st-order Markov Chain model, while an excellent approximation (which the bare-probability model is not), is still incomplete.


Very very awesome- and a nice way to illustrate that an environment that favors an event is also an environment that might favor additional events, and that probabilities are not independent of actual physical considerations.
I don’t find this surprising. It’s obvious that STDs don’t happen randomly – they are triggered by specific meteorological conditions that are conducive to tornado formation… large temperature gradients, vertical wind shear. If those meteorological conditions persist for more than one day, as when a large storm front forms between a large Canadian air mass and a mass of warm humid air from the Gulf of Mexico… well, we might expect to see STDs on consecutive days.
So the fact that the prior day was an STD doesn’t causally affect the following day; the underlying causal factors, which may well persist for more than one day, result in consecutive STDs. It seems to me this is exactly what we might expect from a weather pattern of the kind we’ve seen in the midwest this week.
Interesting. While reading my experience as a weather watcher led me to guess the real data would show less long runs than the Markov Chain. This is under the expectation that while a weather pattern will certainly persist over a few days there is a tendancy for severe weather patterns to build, peak and then collapse. Perhaps this explains the dip around 5 or 6 days which feels about the right time for say a strong bulge in the jetstream to pinch off and then blow itself out.
But the longer than expected tail? Perhaps thats when a blocking pattern becomes established for a week or more, and it has a higher daily probability of the pattern staying in place for the next day and producing another tornado.
Hardly a shocking result, given that the classic example for Markov chains involves weather prediction.
An excellent post, all the same.
Very well explicated, Tamino.
Whilst reading this I started to wonder about the spatial distribution of tornadoes. The only places I ever hear about them are in the US (although we did have a deadly one in Edmonton when I lived there). I suspect there are lots of places with good long-term tornado records, but I dunno ’bout them.
Steve, given the number of items I’ve read recently on tornadoes I can’t recall exactly where I got this. The US tornado phenomenon is strictly a matter of geography. The combination of the Rockies being where they are and the Gulf being where it is means ideal conditions for the collision of the different warm/cold, moist/dry bodies of air.
Elsewhere, even in Adelaide suburbs, we have infrequent events, let’s be honest, rare would be a better word, that meet the technical definition of tornado, but they’re usually very, very small and transient.
Britannica online elaborates on this–the US is indeed #1 in tornado frequency and severity, but they do occur worldwide (well, not quite–there’s never been one in Antarctica, as far as we know.)
http://www.britannica.com/EBchecked/topic/599941/tornado/218356/Tornado-occurrence-and-distribution
Steve L: as I understand it, the geography of the US is particularly favourable for tornados – a warm body of water to the south, cold land to the north, with flat land in between that sits right under the jet stream (I believe that’s the critical ingredient, introducing rotational shear). The terrain promotes the generation of large supercell thunderstorms, while the jetstream gets them spinning.
Tornadoes do seem to be much more rare in other parts of the world, but they are by no means unknown. There was the deadly twister that hit Auckland, New Zealand, just a few weeks back. I’ve seen (and have shaky-cam video of) rotation in storm clouds directly above my house (luckily nothing eventuated of it!)
This page has a photo of an F4 in Australia, just a few hundred kilometres north of where I am. Curiously, I have no memory of any mention of this storm & tornado in the mainstream media at the time, which is particularly odd because I was probably on vacation at my parent’s house at the time, which is only 25-30km away from where this storm hit. Luckily for us, most of Australia is very sparsely populated, so the majority of tornadoes here go unnoticed.
I forgot to add: the media here in Australia have managed to turn the phrase “mini tornado” into a synonym for “storm with strong winds”, which confuses the matter even further for those interested in actual tornadoes.
Thanks Adelady — I wondered about Australia, and sort of figured the tornadoes must be in the Outback, where population density was low. I guess I shouldn’t assume and actually look this stuff up, instead.
Finland has ~14(mostly F0-F1)/year, peaking when the waters are warmest, http://ilmatieteenlaitos.fi/suomen-trombi-ilmasto, peak time of occurence is late afternoon, but waterspouts are more evenly distributed throughout the day. I believe in Europe they’re the commonest (but nowhere near as common as in Tornado Alley) near the Black Sea (Ukraine, Belorussia), and Poland, but I don’t know where to find hard data on those countries…
It’s interesting that tornados in the US appear to be a late doing phenomenon, rather than a summer phenomenon. This would appear to suggest that it can become almost too hot (perhaps because it gets too dry) to produce large numbers of tornados.
This in turn suggests that one might expect the time of year when tornados peak to have shifted earlier as temperatures have increased, even if there might be no clear trend in the number of tornados per year.
Is there anyway to analyze the data for such a trend? Or is the data too noisy?
The first sentence should have read:
“It’s interesting that tornados in the US appear to be a late SPRING phenomenon.”
Temps in the northern Plains and well into Canada get quite warm in midsummer–Prince Albert, in central Saskatchewan, has a July mean maximum of around 24 C, for instance–so perhaps it’s harder to get the differential temps along a frontal boundary.
The main reason for spring peaking is the northward movement of the jet stream. It’s just one data point, of course, but this April’s all-time monthly record number of tornadoes was a month earlier than the average annual peak.
Records in other countries aren’t as good as in the US, mostly depending upon someone collecting data not as part of their job. The intensity distributions are discussed in Brooks and Doswell 2001 and an effort to look at the spatial distribution of favorable environments for the most severe thundersorm and tornadoes is in Brooks et al 2003. I’ve added more years to the analyses and tweaked the parameters a little from Brooks et al. 2003, but the general picture of the distribution is similar-severe thunderstorms occur mostly downstream of high terrain, poleward of moisture sources. Tornadoes are in similar places, with North America dominating somewhat more. Southern Brazil/northern Argentina may get a greater distribution of large hail than the US, and a number of tornadoes. Bangladesh and southeastern South Africa get a reasonable number of tornadoes, as well as southeastern coastal Australia. There’s also quite a few tornadoes from northwestern Europe through central Russia and in northern Italy. Better data is starting to come out of Europe (see the European Severe Weather Database.)
[Response: Thanks for the information, it’s nice to hear from a real expert. BTW, I think your application of the Markov Chain model was quite ingenious and very well explained. I have found some evidence that a 2nd-order Markov model might give a better fit — maybe I’ll post about that too.]
Thanks to everyone who replied to my comment — I learned a lot, both from comments and from you spurring my interest further.
I’ve been thinking more about my own experience too. My parents drove me from Edmonton to Calgary for a sporting event back in 1987. The sky darkened, and seemed very low, black, heavy (I didn’t see any funnels, though). As we got to the highway it felt as though the sky was going come down and swallow us up. I’ve never seen anything like that before or since. It wasn’t until we got to Calgary that I learned the sky actually did swallow up some people. Apparently almost F5.
http://en.wikipedia.org/wiki/Edmonton_Tornado