
Shortly after it became clear that April 2011 broke the U.S. record for the most April tornados, the Washington Post reported that it was not a “legitimate” record … yet. That’s because earlier years’ counts are adjusted upward in an attempt to compensate for our increasing ability to detect tornados in the U.S. However, it didn’t take long for April to shatter, not only the actual record of observed number of tornados, but the adjusted record as well.
I retrieved archived tornado data so I could count how many tornados were reported for each month from 1950 through 2007, then added counts for recent years to bring the record up to date. For the month of April only, I get this:

The preliminary count for April 2011 is 875 tornados, which is more than three times as many as the previous record of 267 back in 1974. Yeah, more than three times as many. This year’s April count is only preliminary, and may well be revised downward as duplicate reports are identified. But it’s still one hell of a hockey stick.
Even after the dust clears, this April is overwhelmingly likely to be a record-smasher. This is shown by a similar graph from NOAA which includes an “error range” to indicate possible final counts. Incidentally, my numbers seem to be the same as those in the NOAA graph except for 1971, for which the NOAA graph shows a higher count than I got:

Any way you slice it, it’s still a hockey stick and 2011 will still be a new record.
Total tornados in April isn’t the only record broken this year. According to NOAA reports of 2011 tornado information, this April also broke the record for most tornados in any month, the previous record being 542 in May 2003 (May is the most active month for tornados in the U.S.). An unfortunate record-tie happened on May 22nd, when a tornado hit Joplin, MO, killing 116 (by latest count) and tying the record as the deadliest single tornado to strike the U.S. since modern recordkeeping began in 1950. But the actual deadliest single tornado on record was on March 18, 1925, an F5 twister which covered a path 291 miles long and killed 695. Also, the death toll from tornados so far this year (estimated at 481) is the highest ever through May in the NOAA-NWS official record (starting in 1950).
It’s especially disturbing because tornado deaths in the U.S. have trended downward:
The decline is even more pronounced when adjusted for population increase to give fatalities per capita:
The decline is almost certainly due to improved early detection and warning, giving people enough time to take protective measures. But this year has been especially deadly.
Let’s hope this is just a freak event. But let’s not count on it.
Although none of this year’s tornados has come with a label tag saying “caused by global warming,” and many have dismissed any thought that there could be a connection between man-made climate change and the recent onslaught of tornados, the statistics alone scream that this year isn’t like what we’ve seen before. Ever. The connection with global warming is at least plausible, and is certainly evidence that man-made climate change can have deadly consequences. It’s foolish to dismiss the possibility.
2011 is already the “year of the twister,” and it isn’t over yet. It also follows hard upon an onslaught of extreme weather events over the last year. Heat waves, floods, droughts, storms, wildfires, have inflicted heavy casualties around the globe, and the U.S. has not been immune to the plague. It’s long past time that we should take global warming seriously, not just as a scientific fact but as a genuine threat to health and safety. Forewarned is forearmed — unless the warning is ignored.


inGored? Interesting slip :-)
[Response: Fixed.]
Roy Spencer has a post on this. His conclusion, as it has warmed, the tornado count has gone down. Having spent almost my entire life in tornado alley, I would say 1950 to ~1980 is probably irrelevant. ~1980 is when we started feeling the transition in arctic weather. From 1980 to recent years, my hunch is the Northern part of tornado alley was warmer during tornado season, and that contributed to lower numbers. Recently the arctic switched, and my hunch is the Northern part of the alley has been colder: tornado alley back in business.
While looking for an old post on the stepwise jumps in hurricane frequency (if I remember correctly, Tamino found a neat division into three different periods) I found another Open Mind post on tornadoes that might be relevant. For those who don’t know about it, there is an archive of many of the older posts here:
Open Mind Archive
http://www.skepticalscience.com/Open_Mind_Archive_Index.html
The following was said with regard to trends in tornado reporting in one post:
… then with regard to 2004:
The earlier post I was thinking of regarding hurricanes was specifically on tropical cyclones. It identified a stepwise series of regimes indicative of nonlinear dynamics. The step-wise behavior has reminded me in the past of chaotic behavior involved in water drops from a faucet as one gradually increases the water flow.
Please see:
The tornado count is up as is their ferocity. 4 F5/(EF5) in April and May so far. That is the most since ’74 (7, all in one ay throughout the country) and third most since ’50 (there were 5 in ’53) which I believe is how far back they go in rating these events.
http://en.wikipedia.org/wiki/List_of_F5_and_EF5_tornadoes
There were some severe storms last night throughout Texas, Arkansas and Kansas but it seems they did not reach F5 though one apparently made F4.
http://www.wunderground.com/blog/JeffMasters/article.html
I was living at my grandparents’ at the time of the May 15, 1968 Oelwein, IA F5, but I wasn’t quite 2 at the time. I didn’t know it was an F5 until now. As they tell it, my grandfather was painting out back and the tornado started to form right above the house. They took me and my cousin down into the basement in our high chairs. My mom was there at the time and struggled in vain to close the window while taking a bath. The house was completely demolished and my grandfather’s church destroyed.
Back in 1929 my grandfather received a scholarship for college which he planned on using to become an architect. The Great Depression made the scholarship not worth the paper that it was written on. After the tornado and nearly forty years after the Great Depression hit he decided to draw up the plans for his own house, the one to replace the house destroyed by the F5. It was to sit in the same spot. He then had an architect and friend look at the plans to see what needed to be changed. “You don’t have to change a thing, Dale.” That was the house that he built.
A little over six years later he was dead due to a heart attack. My grandmother remarried years later and moved to Waterloo. But last I heard the house was still standing and being used as a dentists’ office. I still have memories of the ice tea he would make me, his Old Spice shaving cream that I now use, the toy wood boat he carved in the garage, the garden in front and the fireflies I would chase out back at dusk. My grandparents raised for the first three years, while my mom tried to straighten things out for herself by going to college. I always had a strong bond with them. My grandmother would call me “Bruce – Wayne – Tim” after two sons she lost years before.
A lovely, lyrical reminiscence!
A poignant tale indeed Timothy Chase.
“The house was completely demolished……..”.
The instantaneous changes these events bring to people’s lives just cannot be comprehended no matter how no matter how I try to imagine it. 10 minutes before lives normal as normal can be then in a few minutes, nothing left of what it takes years to build. Arbitrary, objective reduction to nothing in a matter of minutes.
Your grandfathers resilience is admirable. I don’t know what I would do in a similar circumstance. I mean 6 years recovery time…..
Thank you both. As for my grandfather’s heart attack six years later, that sort of thing runs in the family. He was dead at age 62. I had two uncles that died in their early 40s. I and a cousin had heart attacks in our early 30s (mine at age 33) and I have a younger brother who had one at age 28. High cholesterol runs in the family. So I don’t think that the tornado necessarily had anything to do with my grandfather’s heart attack.
Heart disease seems to be happening earlier and earlier with the younger generations — something Darwin noticed happens with certain diseases. I suspect that we have a triple repeat disease, where repeats tend to be subject to hypermutation after ten or more repetitions of a given motif and become more unstable with more repetitions. But I am not an expert. It may be nothing more than the increased availability of fast food.
Found this great site http://www.spc.noaa.gov/faq/tornado/
Another interesting chart with a record spike at the end is for SOI, averaging the 8 months Sep-Apr. Why 8 months? It excludes the ENSO transition around mid year, and includes the peak around Dec/Jan in the middle. It is interesting that this record upward spike follows (by a good decade) an unprecedented period in the 80s and 90s of consistently low SOI.
A lot of the natural disasters of late can be linked in some way to ENSO. The Russian heatwave and Pakistan/Indian flood occurred during the El Nino prior to the current La Nina. El Nino usually increases heating over Asia, but not so sure about the floods. Then many of the floods worldwide and the droughts in North and South America fit the La Nina pattern.
So what caused the ENSO variation? Is it just an unprecedented natural variation? Or has Co2 had a hand in driving more extreme behaviour in ENSO. If Co2 has driven ENSO to more extreme behaviour then recent extreme weather has a fairly obvious and significant link with Co2 warming.
I’ve had a look at SOI statistics from the Australian Bureau of Metereology, which go back to 1876. Using a moving standard deviation on 10 years (like moving average but standard deviation) it is interesting to note that the periods of higher variability in ENSO (since the 1980s and prior to 1930) roughly correspond to periods of increasing global temperatures.
From the main essay:
I saw a Joplin death toll of 124 at one point but then it dropped to 122 and now it has risen again:
To be fair to Jason Samenow’s post, that was made on the morning on 26 April. At the time, the preliminary count was only 432 tornadoes and we knew that >75 of those from 16 April had already been eliminated. Thus, the estimate at the of writing that the final total through the morning of the 26th was 350, less than the inflation-adjusted numbers from 1974 or 1957. In effect, April was right at the top of the historical numbers and then there was one of the biggest days on top of it. The final count will probably end up around 600 for April.
While the inflation adjustment referenced in the post is based on a linear regression, it’s clear that the increase (except for the 2011, which we don’t know about yet) is entirely in the F0 tornadoes. The F1 and stronger daily tornado count for April and may is shown at
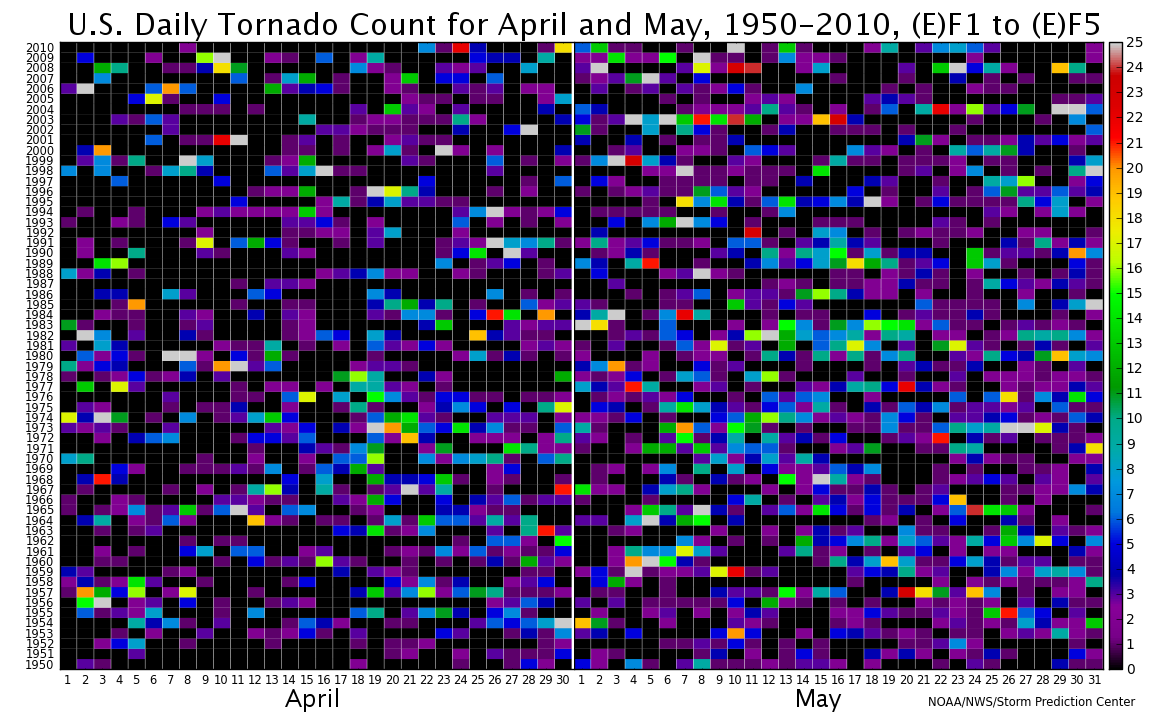
The April number for each year starting in 1954 (the 1950-1953 data is not as good as that starting in 1954 because the forerunner of the Storm Prediction Center started operations in the spring of 1953 and that’s when the better data collection started) is given at the bottom of the post. The linear trend for 1954-2010 is -.4 per year and not even close to being statistically significant.
That said, Roy Spencer’s point showing a decline in F3-F5 tornadoes from March-August is also an artifact of reporting. There are a number of papers in both the formal and informal literature that changes in damage assessment over the years have led to a decrease in the reported intensity of the strongest tornadoes over the years. (As an aside, I have no idea why someone would look at March-August and ignore the rest of the year.)
One of the real problems with associating tornadoes with a warming planet is that tornado numbers and intensity are highly dependent on vertical wind shear, which all of the climate models that have looked at the issue indicate will decrease over the US as the planet warms. One of the main characteristics of April 2011 was the very high values of vertical wind shear over the southern US.
Year F1+ tornadoes
1954 94
1955 82
1956 74
1957 151
1958 62
1959 22
1960 58
1961 62
1962 33
1963 75
1964 108
1965 111
1966 61
1967 122
1968 85
1969 54
1970 102
1971 68
1972 88
1973 136
1974 242
1975 76
1976 78
1977 64
1978 73
1979 94
1980 104
1981 56
1982 117
1983 48
1984 97
1985 76
1986 50
1987 9
1988 42
1989 47
1990 70
1991 122
1992 21
1993 37
1994 77
1995 37
1996 83
1997 23
1998 87
1999 90
2000 75
2001 68
2002 54
2003 46
2004 32
2005 44
2006 114
2007 66
2008 83
2009 110
2010 62
NOAA’s CSI team recently looked into potential connections between warming and increased tornado threat. They found no discernible trend in the southern US or over the Gulf of Mexico in the individual ingredients—instability, shear, and moisture—needed for severe convection and thus tornadoes, but they did not discount the possibility in trends in the correlations of the ingredients, given that all three need to be present to get large outbreaks.
There has been some research on whether we can expect said ingredients to come together more often in the future, particularly from climate model downscaling: this article discusses a few studies. It does appear plausible to expect increases in severe convection over the central US as atmospheric moisture and instability increases.
There is another interesting possibility, albeit just speculation on my part. As the tropics expand due to warming, the jet stream is expected to move poleward, which could mean fewer storms over the southern plains and possibly fewer tornadoes. However, fewer storms means less rainfall, and would lead to more frequent and more severe drought. Drought doesn’t grab headlines or inspire bad movies or reality shows, but it is just as dangerous as are tornadoes.
Lucas,
Good post and links. In addition to the point about trends in correlations of key parameters, one should also keep mind in this kind of analysis presented by NOAA’s CSI document is that monthly means do not tell you much about what is happening on the same temporal scale as the storms producing the tornadoes.
Monthly means wash out the details, and in the case of tornadoes, details are important. So one should, ideally, be looking at the number of days per month when all the ingredients are occurring at the same place and time. Maybe one way of doing this is looking for statistically significant shifts in the tails of the PDFs, or something similar, but now I am probably pontificating. Tamino?
Correction to the 2010 number. It should be 57. I forgot to account for those tornadoes that cross state borders in 2010. I didn’t have the 2010 data attached to the file on the home computer until yesterday.
Dr. Brooks,
Thank you for dropping by.
A problem with associating this years spike with GW is that you wouldn’t expect this kind of behaviour. GW isn’t a sudden jump. Something must have changed this year to cuase this, but who knows what it is?
although he is citing high Gulf sea surface temps in the context of flood rains in the Midwest and and high temps in Texas and Louisiana, a possible connection to the the extraordinary tornado season we are experiencing stuck me as an interesting possibility:
From Jeff Masters blog:
Midwest deluge enhanced by near-record Gulf of Mexico sea surface temperatures
The deluge of rain that caused this flood found its genesis in a flow of warm, humid air coming from the Gulf of Mexico. Sea surface temperatures (SSTs )in the Gulf of Mexico are currently close to 1 °C above average. Only two Aprils since the 1800s (2002 and 1991) have had April SSTs more than 1 °C above average, so current SSTs are among the highest on record. These warm ocean temperatures helped set record high air temperatures in many locations in Texas yesterday, including Galveston (84°F, a tie with 1898), Del Rio (104°F, old record 103° in 1984), San Angelo (97°F, old record 96° in 1994). Record highs were also set on Monday in Baton Rouge and Shreveport in Louisiana, and in Austin, Mineral Wells, and Cotulla la Salle in Texas. Since this week’s storm brought plenty of cloud cover that kept temperatures from setting record highs in many locations, a more telling statistic of how warm this air mass was is the huge number of record high minimum temperature records that were set over the past two days. For example, the minimum temperature reached only 79°F in Brownsville, TX Monday morning, beating the previous record high minimum of 77°F set in 2006. In Texas, Austin, Houston, Port Arthur, Cotulla la Salle, Victoria, College Station, Victoria, Corpus Christi, McAllen, and Brownsville all set record high minimums on Monday, as did New Orleans, Lafayette, Monroe, Shreveport, and Alexandria in Louisiana, as well as Jackson and Tupelo in Mississippi. Since record amounts of water vapor can evaporate into air heated to record warm levels, it is not a surprise that incredible rains and unprecedented floods are resulting from this month’s near-record warm SSTs in the Gulf of Mexico.
ttp://www.wunderground.com/blog/JeffMasters/archive.html?year=2011&month=04
It is a shame when alarmists seize upon historically typical events and misrepresent them while people are suffering in order to, in effect, shake them down for more money.
This is not really any different than those ill-mannered extremists who blamed the victims of the Alabama tornados for their suffering due to their political beliefs.
[Response: It is a shame when deniers lie about shockingly unprecedented events by calling them “historically typical.”]
No, it’s a shame that we no longer have the time to politely ignore paranoid anti-science ideologues.
The looming crisis means we have to ask you directly to take your delusional fantasy and get out of the way.
Ok, I agree that we should look at historically typical events. For instance, in the Mid-pliocene, it appears that the global average temperature was 2–3°C higher than today – pretty much in the CO2-doubling range.
Sea levels were ~25m higher.
Personally, I’m hoping that we don’t see historically typical sea levels any time soon.
Bill McKibben and I both anticipated this response –
http://davidhortonsblog.com/2011/05/25/dont-mention-the-weather/
Dang, that was good. Thanks.
In some ways there are very sudden changes that can be expected. One is ice pack changes. Arctic ice has changed fast enough to drive the jet stream further south.
The jet stream explanation is found on mainstream media.
Ice and other rapid changes mentioned by Hansen, et al in the latest paper. http://www.columbia.edu/~jeh1/mailings/2011/20110505_CaseForYoungPeople.pdf
William, tornados require an interaction of hot air with cooler air. This La Niña’s been a strong one, and the jet stream’s been pushed south for much of winter/spring (which is why Portland, Oregon – my home town – experienced a record 21 straight days of rain in March and an extremely rainy April and May, the jet stream’s been like a firehouse aimed straight at my house).
Some of the professional speculation (speculation by professional meteorologists like Dr. Jeff Smith of Wunderground, as opposed to speculation by professional speculators) have centered around this combination of near-record gulf SSTs and almost summertime temps in the south combined with abnormally cool weather to the north brought on by La Niña.
Last winter I spent a lot of time in both South Dakota and Texas. On one trip I was stuck for five nights staying in motels because blizzards had closed South Dakota roads. I’ve never been unable to drive straight to my destination, and I’ve been making these trips since 1980. They had a good, old-fashioned Laura Ingalls Wilder winter. When I would go back to Texas, the cold weather followed me. My home in Dallas was about to get blasted by the Super Bowl storm, so I fled to our house in Houston. I was sick of snow. Once in Houston, an ice storm coming off the Gulf collided with an Arctic front. There was ice on the Galveston side of us, and ice in North Houston. None where we live. Back to the Dakotas, and more winter weather late into the spring.
In February I called and told my wife we needed needed to make certain our son in college in Lubbock had a through tornado plan. So nows he knows what to do. Just an uninformed hunch, but I’m glad we made him think through a plan.
Roger that–but I know what it has ‘felt like’ in Georgia: It has alternately felt like June in Georgia and June in Northern Ontario–that is, alternations of warmer, moister conditions, and cooler, dryer conditions. And it has seemed to me that it is more marked than usual.
If so, that would be consistent with the idea that the Jet Stream has indeed been bringing more cool dry air south, even as the Gulf air continues warm and moist. That’s a possible avenue to explore–or so I would think.
I can’t do it–apart from insufficient skills, I’m distracted by trying to deal with the oak-tree damaged house left as a gift by the thunderstorm outbreak of April 4.
Then there’s the question of objectivity. . .
In Houston we were getting arctic fronts in April. Very weird.
I got sunburnt in both Swansea and Stoke-on-Trent.. normally that would be a 3-sigma event if it was in the same decade, never mind the same April..
As the high cumulonimbuses involved in tornadoes are through the whole troposphere, there could be a link to stratospheric temperatures, I’d imagine. Anyway nowadays there is pretty constant monitoring of weather patterns on many levels of the atmosphere so this could be a test case for trying to make seasonal predictions on the amount of tornado occurrences, if a connection to some phenomenon can be found.
I have to say that I am with William, here. One year is weather. The jury is still out on whether climate change will have any effect on events like tornadoes.
Gotta look at this NOAA satellite animation of April tornadoes.
http://www.nnvl.noaa.gov/MediaDetail.php?MediaID=731&MediaTypeID=2
One can see the whorls of vapor throwing, exploding, dispersing. Seems to me like more energy and more water vapor being integrated into our breathing planet.
While the weird extremes – tornados, hurricanes, and the like – are unique that is hardly an excuse to excluding them from the total record.
Somehow people seem to have been bamboozled into thinking that because they for one reason or another don’t think one way they are incapable of thinking another way. “no single event can be attributed” does not in fact cancel the overall record by excluding all events.
Pretty simple graph
http://www.cnn.com/2011/US/05/24/chart.tornadoes/index.html
Anthony Watts has weighed in:
He also implies a downward trend in F3-F5 tornadoes from March through August. And he calls tamino “nefarious.”
Compliments, compliments. . . well-deserved, of course!
The March-April thing sounds like cut-and-paste from Dr. Spencer.
WHATever.
A rather elementary “tools” question, involving Google Docs –
From the NOAA Storm Prediction Center data, I’ve got data for #tornados/yr for California, 1950-2011(so far), here (link).
Now, obviously, I’d like to use Google’s handy Charting feature; but it doesn’t seem to grasp the concept of dates so the result is an abomination. And I haven’t been able, yet, to figure out how to de-abominate it, and to be honest the frustration’s been getting to me.
Help?
[Response: I haven’t used Google docs or their charting feature. Maybe someone else?
Aren’t the years just numbers?]
I think I got it, more or less, so carry on…
(I’d wanted to do a histogram, turned out it wanted me to do a scatter plot)
Anna, don’t know if you had a chance to look at this. Hardly a scatter plot, but IMHO an incomparable visual. I know it’s a repeat, but it’s just so great, April tornadoes with satellite animations for April.
http://www.nnvl.noaa.gov/MediaDetail.php?MediaID=731&MediaTypeID=2
Still can’t get it directly via google search, don’t know why, had to use enviroguy, click through, and then choose animations and the item. Lots of other good stuff there. Must have some fancy internet protections somehow.