
The Paris accord set a lofty goal: to prevent Earth’s average surface temperature rising more than 1.5°C above “pre-industrial,” i.e. its value before the industrial revolution. The choice was made not just because every tenth of a degree makes the impacts of global warming worse, but because 1.5°C seems to be the point at which there’s genuine risk of collapse of the great ice sheets in Greenland and Antarctica.
Of course that raises the question, “What was Earth’s surface temperature before the industrial revolution?” That’s hard to pin down with precision, because “before the industrial revolution” coincides with “before thermometer records over much of the world.” The scientific community has settled on a practical compromise: to represent “pre-industrial” temperature by the average global temperature between 1850.0 and 1900.0, i.e. from January 1850 through December 1899.
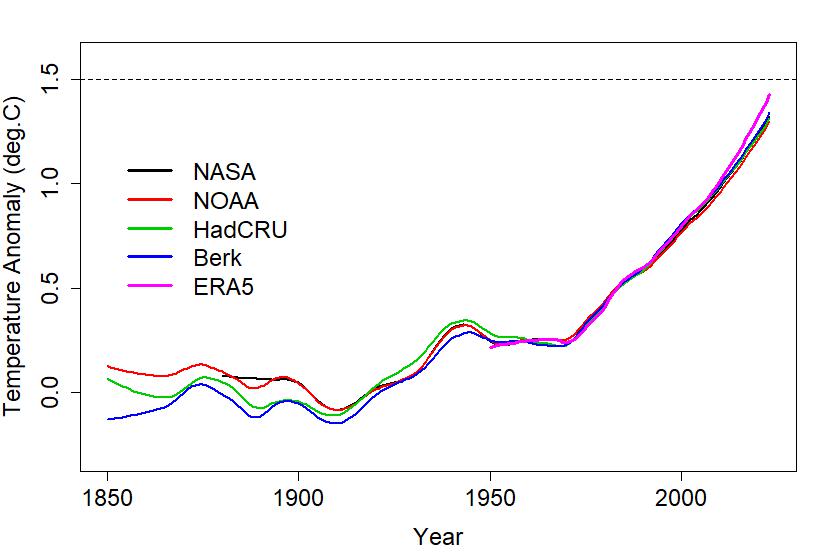
Modern temperature data sets are global temperature anomaly, which is the difference between temperature at a given time, and its average during some baseline period. The warming “since pre-industrial” will then be the anomaly at a given time, minus its average during the 1850.0-1900.0 period. And here are those values, yearly averages according to four major data sets, namely NASA (from NASA’s Goddard Institute for Space Studies), NOAA (National Oceanic and Atmospheric Administration), HadCRU (Hadley Centre/Climate Research Unit in the UK), and Berk (the Berkeley Earth surface temperature project):

All four data sets are aligned as well as possible to zero during the 1850.0-1900.0 “pre-industrial” period, but after that, they don’t tell quite the same story. By the time we get to the present year (2023), the NOAA data indicate 1.32°C warming since pre-industrial, while the Berkeley data suggest a full 1.53°C — a noticeable difference of 0.21°C. Also, the NASA data aren’t really based on the 1850.0-1900.0 baseline because there’s no NASA data until 1880; it’s really based on the 1880.0-1900.0 baseline. And, this graph doesn’t include the ERA5 data (from C3S, Europe’s Copernicus Climate Change service) because that doesn’t begin until 1950 so there’s no data from the 1850.0-1900.0 period to define “pre-industrial.”
Some might think the Berkeley data are telling us we’ve already crossed the 1.5°C threshold — after all, 1.53 is greater than 1.5. But the limit isn’t crossed when a single year goes that far, only when the long-term average does, which is far better represented by the smooth value from a good smoothing method (on a time scale of 20 years or so) — such as I used in the last post for smoothing both the raw data from HadCRU and its adjusted version. I smoothed all four data sets by the same method, giving this:

None of them, not even from the Berkeley data, has yet gone past the 1.5°C limit, but is has come uncomfortably close at 1.4°C. Meanwhile, the smoothed curve from NOAA data indicate only 1.21°C of warming since pre-industrial. In between these extremes are the smooths from NASA at 1.26°C, and from HadCRU at 1.31°C.
Most of the difference between these data sets now, has been present throughout most of the time span. This is because their biggest disagreements are prior to 1900, so they are aligned with each other using that, their most imprecise sections. We would get better matching between different data sources if we used, not the 1850.0-1900.0 period, but the 1950.0-2000.0 period, but then the average won’t represent “pre-industrial.”
However, if we take the 1950.0-2000.0 average, and subtract 0.4 °C, then for the HadCRU data this will be almost exactly the same “zero point” as using the 1850.0-1900.0 average. For the other data sets, the 1850.0-1900.0 average minus 0.4°C will be slightly different from 0, but by just the right amount to bring them in best alignment with HadCRU during 1950.0-2000.0, the new reference period. And, we’ll be able to compute this for the ERA5 data beccause it only requires data from 1950.0 to 2000.0, and ERA5 has that. With this definition, the data look like this:

During the 1850.0-1900.0 period, the different data sets no longer agree so closely, but they are well aligned during the new 1950.0-2000.0 reference period. That agreement persists into the 21st century, except for the ERA5 data which seems to be a bit, but noticeably, higher than the others from 2015 until now. This becomes even clearer when comparing the smoothed versions using this new reference:
With the new way of computing “pre-industrial,” different data sets are in much better agreement after 1950. I suggest this will be a distinct advantage when evaluating “where we stand,” both now and in the future. And where do we stand? Using the new reference, the 2023 yearly averages (January through November, except ERA5 which has already released the December value to complete the year), are:
NASA: +1.43 °C
NOAA: +1.41 °C
HadCRU: +1.44 °C
Berkeley: +1.47 °C
ERA5: +1.56 °C
Meanwhile, the 2023 smoothed values are:
NASA: +1.32 °C
NOAA: +1.30 °C
HadCRU: +1.31 °C
Berkeley: +1.34 °C
ERA5: +1.42 °C
The ERA5 dataset is the “odd man out” in this gang of five. Not only does its 2023 average actually exceed 1.5°C, even the smoothed value is 0.1°C warmer than the others, though not yet past 1.5.
And what, you deserve to know, is my answer to the original question, “How far to the 1.5°C limit?” Using the current smoothed values calculated with my new definition of “pre-industrial,” I’ll say we are now 1.32°C above pre-industrial, so another 0.18°C will bring us to the limit. At the rate we’re going, I expect that to happen in the early 2030s.
You can help this blog:
donate at my wee dragon


There is something odd about how the ‘warming since pre-insustrial’ is discussed.
Like this:
Imagine that we know precisely how warm it is _now_. And we think we know that disaster will strike if it gets 0.2 °C warmer. And we think we know that pre-industrial was 1.3 °C cooler than now. So that disaster will strike if it gets more than 1.5 °C warmer than pre-industrial. And we have 0.2 °C margin.
Then further imagine that we get new better data about pre-industrial so that we learn that it was not 1.3 °C cooler than now but 1.5 °C cooler. Then there are two (at least) ways to view this new situation:
A. Oh no! We are already at +1.5 °C. Disaster will strike NOW!
B. Aha. The limit is not +1.5 °C but +1.7 °C. We of course still have the 0.2 °C margin to disaster.
Alternative B makes some sense. Alterantive A is mostly dumb – I think. But everywhere I read about the uncertainties of the pre-industrial temperature the reasoning goes like in A. Someone has missed something. If it’s me, what is it?
[Response: In truth, there is uncertainty about both when things get *very bad* and what’s-pre-industrial. To me, a choice of 1.5°C above the HadCRU 1850.0-1900.0 average, is as good a choice as any, and what’s important is to agree on how we’re going to measure things.
But I don’t think there is any point at which “disaster” strikes … it just gets worse and worse and worse until you can call it a disaster. I think the point is that 1.5 is very bad, and 2 is super-crazy-bad.]
Response to the response:
Yes, I agree to all that. But none of that was my point.
But this: We know how warm it is now and we can figure out at what temperature we get some unwanted effect, e g polar ice caps will melt away if the temperature exceeds a certain limit. The polar ice caps won’t care if we find out that pre-industrial was, say, 0.2 °C cooler or warmer than we believed before. That won’t change the temperature that melts ice. But I get the impression that it is most often described as the 1.5 °C limit is magic so that if pre-industrial is, say, 0.2 °C warmer than we thought then the ice caps will melt also at a temperature 0.2 °C warmer than we thought. That’s what I tried to illustrate with my ‘reaction A’. But the temperature at pre-industrial shouldn’t determine the melting temperature of ice. And then ‘reaction B’ is more appropriate.
In discussions of “how bad will it get”, it’s important to point out that “disaster” is surely in the eyes of the beholder; and for the victims of sea level rise or newly-extreme weather, anthropogenic climate change is already a disaster.
Any lukewarmer (not saying Ignorant Guy is one) who insists that climate change won’t be a disaster, is dismissing the cost already being paid by involuntary third parties to the lukewarmer’s private transactions on the energy market, often out of proportion to their own contributions to the problem. Denying the evidence of the costs in money and grief already paid, in an attempt to justify socializing one’s private marginal climate change costs, is transparently selfish IMO.
Ignorant Guy
I don’t think any climate scientist ever said
“at +1.5 °C. Disaster will strike NOW!”
What they have said is it will be too hard to reign in the warming once it passes 1.5 C, leading to disaster down the line.
No, but that was not my point. I just tried to make an illustrative example.
My point was that bad consequences of climate warming should not be dependent of the exact temperature at pre-industrial. E g, the temperature that melts ice depends on characteristics of ice. It does not depend on the exact temperature at pre-industrial.
FWIW, I take your point. I’ve always considered the 1.5°C target to be more or less arbitrary on a continuous damage function, but that it’s as good an aspirational goal as any, and although we’ll probably overshoot it, better than a higher value for the purpose of motivating collective action to decarbonize ASAP.
Thanks for this contribution.
ERA5 has now been extended back to 1940, not that that changes anything.
Also, arguably, Berkeley’s spatial stat’s are/were superior, which ought to matter most in the ‘scarce data’ 1800s … but then its 1850-1900 is a bit of an outlier, so I can understand why you’d shy away from adopting it.