
I often think how much I enjoy data analysis, and how much I view data collection and organization as a tedious chore. It’s one of the reasons I consider myself so lucky; I usually don’t do the tedious stuff, instead I swoop in after others (often, a host of others) have done the hard part while I get to do the math (which, in case you haven’t noticed, is the part I love). But I acknowledge the truly astounding amount of work required to get me that data. The effort required, the time required, the hours upon days upon months upon years upon centuries of work, is the raw material for my fun time.
One of the best examples is glacier data. Measurements of glaciers began in earnest in the 19th century, and the collected work is truly that of legions of researchers. Some have even pored over historical records and geological data to extend our knowledge back before they themselves were born, and that’s a lot of work in itself. Now imagine taking all that data, from over a century of diligent efforts, on tens of thousands of glaciers around the world, and putting it all into a useable form so guys like me can work our statistical magic. Just thinking about how much work that all is, makes my head spin.
But that’s what the hard workers have been doing. The pinnacle of their achievement is the collected data holdings of the World Glacier Monitoring Service, headed by Michael Zemp in Switzerland. The thoroughness, the care, the diligence of their efforts are truly impressive.
Zemp and a host of others have just published a new paper reporting analysis of all that data. The results reveal just how different the last few decades have been, not just compared to the preceding hundred years or so, but probably compared to all of recorded history.
The data fall into three broad categories. Glaciological data result from measurements taken of individual glaciers at individual locations (often, a large number of individual locations), primarily based on “stake and pit” measurements in which researchers put a stake in the glacier to use as a marker to measure over time how much the glacier grows or shrinks. Geodetic data estimates glacier volume changes (and by deduction, mass changes) from repeated mapping from the ground, the air, and space. Front variation data records the changes of the front of the glacier, which can be extended to remote areas by remote sensing, and even back in time by the study of clearly dated historical documents. Some front variation data extend as far back as the little ice age, i.e. the 16th century.
One of the results is the extent of glaciers, organized into 19 regions spanning the globe:

Clearly the global average is at its minimum, as are most of the regions of the world. Another is the ratio of advancing glaciers to retreating ones:
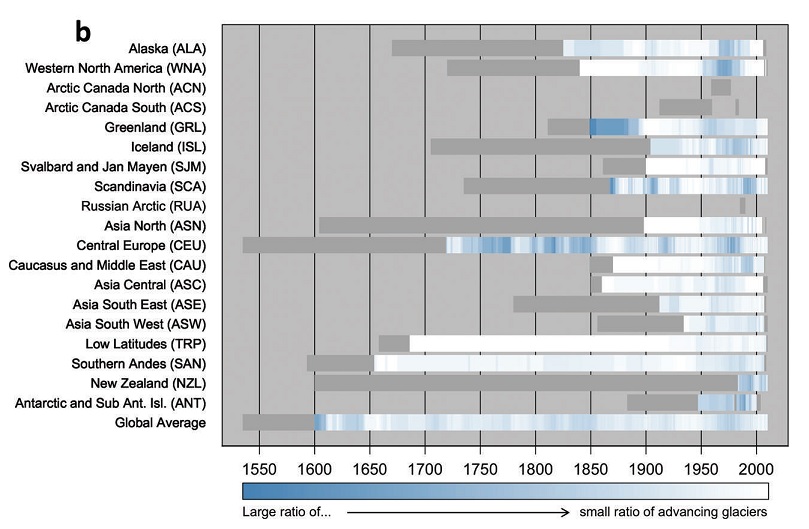
Again, the global average is at its minimum, as are most of the regions of the world.
The main result is that not only are the world’s glaciers shrinking overall, the rate of glacier retreat was significantlyl higher in the 1990s than in preceding decades, and significantly higher in the first decade of the 21st century than in the 1990s. The problem isn’t abating, it’s getting worse. There’s certainly been no “pause” or “hiatus” in the wasting away of the world’s glaciers. But perhaps the overall result is best summarized by quoting from the paper itself:
The worldwide retreat of glaciers is probably the most prominent icon of global climate change. The causality of global warming and melting ice is obvious and well understood, at least in principle, by the general public… In this regard it is noteworthy that the global glacier sample shows a largely homogeneous retreat both at the centennial timescale and also over the past few decades. This homogeneous change in a sample covering a wide range of response times is also strong evidence that these changes are not the results of random variability but of globally consistent climatic forcing (cf. Reichert and others, 2002; Roe, 2011)…
To re-iterate that this isn’t just “natural variation”:
Recently, Marzeion and others (2014) showed that glacier mass changes in the late 19th and the first half of the 20th century can be explained satisfactorily by natural variability, whereas the ice loss of the past few decades requires that anthropogenic forcing be included.
They also emphasize that we can expect more glacier loss to come:
With a view to climate change scenarios for the end of this century and corresponding studies related to the modelling of future glacier changes (Church and others, 2013, and references therein), we must anticipate further glacier loss far beyond historical precedent.
I repeat that the amount of work required to collect and organize this much information on this many glaciers, over such a wide-ranging area, over such a long span of time, is amazing. It’s not usually thought of as the “glorious” part of science, but it is the foundation, the bedrock on which science is built. All those who contributed have my thanks.
But from deniers, they only get derision. Anthony Watts posted about the paper, simply quoting the press release but not before the snide comment “From the UNIVERSITY OF ZURICH and the “lets ignore some of these other growing glaciers” department.” Nothing could be further from the truth. They didn’t ignore any glaciers at all, least of all the growing ones, in fact they tallied how many were growing and how many were shrinking. These days, the shrinking ones so vastly outnumber the growing it’s getting ridiculous. But for Anthony Watts, if he can find one growing glacier then he’s willing to dismiss the results of those who have spent a lifetime of hard work, organizing the many lifetimes of work of many others who came before them, just so he can persist in his make-believe world where glacier melt isn’t one of the iconic signs of global warming. Truly, his ignorance knows no bounds.


And that is why I view him with nothing but contempt.
And of course, in a world with a seriously disrupted hydrological cycle, there must be somewhere where increased precipitation has lead to glaciers getting bigger.
Precipitation changes are exactly the problem. Changed weather patterns means it doesn’t fall in the same places.
I’ve done three volunteer vacations that mapped glaciers, twice to Denali Park in Alaska and once to Glacier Park in Montana. It’s hardly “glorious” in terms of scientific achievement (IANAS) but very rewarding.
Collecting the data can be difficult though. It can be hard to decide if your’re standing on the edge of a retreating glacier that’s underneath a pile of rocks, or if you’re just standing on a pile of rocks and the glacier edge is somewhere else. Even when you can see the ice it could be a stagnant ice mass that’s separated the active glacier and taking years to melt. The mapping is still a judgment call.
Also, you have to keep an eye peeled for grizzlies. We couldn’t get one glacier because of a mom and cubs in the way. I argued that we could circle around them but I was outvoted.
The hard work of man-centuries collecting empirical data so often goes unnoticed. But it does happen and the records remain.
The work of deniers will remain as well. For well deserved eternal damnation.
Hundreds of person-years of observational work dismissed by A.Watts five minutes of dimwitted narcissism…that’s some stats!
Anthony Watts loves to insult the people at GISS and elsewhere who analyze things without leaving their computers and looking at the real world, which would clearly overturn all their theories.
But he equally insults the people who go out and measure real world data from behind is own computer, because they clearly don’t understand the big picture the way he does.
Data analysis! Yaay!
Data collection! YAAY!!!
Data organization! *crickets*
Of course, His Willhardness, the Grand Muppet of Wattsupia is lucky that the task of finding a glacier that is advancing despite AGW is no great interllechal exercise. So the “some of these other growing glaciers” he refers to are the Hubbard Glacier and the, er um, the Hubbard Glacier and the, mmm er, did I mention the Hubbard Glacier? Hubbard is an interesting glacier and the big climate question is less why it has been advancing since 1895 but more why it was where it was back then.
[Response: The new paper motivated me to track down glacier data, which I’ve retrieved. I’ve only begun to explore it, but last night I ran a quick-and-dirty “what fraction of glaciers are advancing now” estimate. Of course it’s only my first pass analysis, and needs much improvement.
If only Anthony asked me for a list of growing glaciers… I could have sent him the names of some of the 3.6% I found.]
Of course, tamino, all great scientists learn to focus on the truly important observations and to ignore the unimportant ones. Watts is just one more in a long, illustrious line stretching from Galileo to Einstein to do this.
“3%”? Oh no!!! That means there must be a 97% consensus amongst glaciers about climate change!!!
“3%”? Oh no!!! That means there must be a 97% consensus amongst glaciers about climate change!!!
R Tol sez: 100 – 3.6 = 96.4 =/= 97%, so no consensus at all, QED. And the bus you rode in on…
Metzomagic: You forgot to change the sign and get some gremlins in, and then cite your salary as an authority. Sorry, butt it *is* such a waste of time when people can’t or won’t learn or just don’t want to tell the truth.
btw, in the late oughts I looked up the glacier list and found it was around 10%, so that would indicate it is now somewhat worse. But I would put my 10% at +-2 or 3.
From the discussion in this blog on the conjectured exponential melt in Greenland I was interested in finding SMB time series data for it and Antarctica but was never quite able to get it. NSIDC has SMB data for glaciers outside of Greenland and Antarctica.
As the linked article indicates and your comment suggest length changes (frontal changes) are an important factor in assessing climate-glacier dynamics. Here are a couple of other papers on the topic:
Click to access tc-6-1339-2012.pdf
and
Click to access Leclercq-2011_glacier-contribution-to-sea-level-rise-1800-2005.pdf
Professor David Archer of the University of Chicago, who we all know, gives a course on climate change also offered through Coursera. He has an interactive map of world glaciers with a display of their relative length time series that was used in the course.
For anyone interested in this or in other climate models he used, here is a link to his webpage:
http://forecast.uchicago.edu/
in the upper left there is a tab for on line models. He gives a video presentation for each one there is a fair amount of documentation that accompanies each model. It’s a bit easier to get to if you go here:
http://climatemodels.uchicago.edu/models.html
you get a listing of the models from the class (plus a new one on permafrost). Scroll down to GHCNM click in it and it brings up the Climate Time Series Browser which includes met stations, forcings, and records. If you click Forcings|records it brings up among other things a large number of glaciers in the world. The display on the right contains an interactive map which shows the glaciers in the list and a data plot below it. He describes how to use it in “About this Viewer” seen in the upper right which has a link to his video introduction, well worth a look.. If you click on a glacier in the list the data plot shows the time series for the glacier advance or retreat. If you click and drag the map to Greenland say, then magnify it with the slider, glaciers start falling off the list leaving only glaciers in the display. You can then click on each glacier in the list to see the advance or retreat of glaciers in Greenland and a visual idea of the extent of the nonlinearity. The plot does not show the time axis but if you put the mouse on the plot it will show the year and length data point values. The data can be downloaded and and can be read as text. (wordpad)
The interaction for this type of data display seems to work well. During the course it could a a bit vexing at times particularly if you wanted to bring other data in like temperature.
I am not sure of the exact source of this data but I believe it comes from data sources used to produce the AR5 Report.
What was surprising to me is that many of these glaciers show retreat since the early 20th century.
I look at the data presented and all sorts of questions arise! (You, of course [with our gratitude], grab the data and answer some of your questions.) One of my questions is: Are “global averages” count based (each glacier gets one ‘vote’), region based (each region gets one ‘vote’), volume based, or something else [my guess]?
The global average extent bar for 16th century glaciers doesn’t look exactly like 16th century Central Europe, although Cen. Eur. provides all the data for most of that period. The global average bar for ‘advance to retreat ratio’ for the early 17th century similarly doesn’t look like the regional data it averages. [There might be a count threshold under which a grey bar shows.]
The other thing about the WattsUp post is that they don’t spend a second thinking about the implications: what if glaciers _weren’t_ receding on average? Well, sea level is rising… that means that more of the sea level rise would be coming from the ice sheets and thermal expansion. Which honestly are more worrisome than land-glaciers (ice sheets because they are the potential source of big sea level rise numbers in the future, thermal expansion because that would mean that more heat was going into the ocean than we thought, so therefore climate sensitivity is likely higher than we thought).
“Truly, his ignorance knows no bounds.”
It’s not ignorance with these people – not even *willful* ignorance. It’s entirely conscious and calculated dishonesty. You can argue about the motivation, whether it’s for money or adulation or ideology or whatever, but there is absolutely nothing innocent about it.