
A recent post at WUWT is titled “Needed: Accurate climate forecasts.” My opinion: the authors, Paul Driessen and David R. Legates, give us a stunning display of false and/or misleading claims.
Being mistaken about something, and therefore making false claims, is only human; in most cases we should correct, but not indict. Yet there are cases in which such behavior is genuinely culpable. When false claims come from those who really should know better, who indeed would know better if they were more interested in the truth than in pushing some agenda, ignorance becomes willful ignorance and therefore culpable. When those who really should know better make statements that are technically correct but clearly misleading, it becomes dishonesty. Is that what Driessen and Legates have done? You make the call.
Here’s some of the “evidence” they provide:
Moreover, there has been no warming since 1995, several recent winters have been among the coldest in centuries in the United Kingdom and continental Europe, the 2013-14 winter was one of the coldest and snowiest in memory for much of the United States and Canada – and the cold spell could continue.
Let’s consider these claims. In this post I’ll address #2 and #3 (I’ve often addressed #1 and will do so again in the future). First up, therefore, is the claim that “… several recent winters have been among the coldest in centuries in the United Kingdom and continental Europe, …” Is that true?
The best-known, and probably best, temperature record for the U.K. which extends back centuries is the Central England Temperature, or CET. It provides data for 355 U.K. winters, a season which I define in the standard climatological sense, December-January-February. Since the CET data are easily available as monthly data, it’s straightforward to compute the Dec-Jan-Feb average for each winter.
That still leaves open two questions. First, what does “recent” mean? In a vague sense, we all agree — but if we’re going to make claims about temperature data we need to quantify that somehow. My first instinct was that “recent” referred to the last decade, perhaps even two. To be generous, let’s go further than that and include in “recent” the last 30 years. To call “recent” what is, in this context, more than 30 years ago, I suggest would be misleading.
Second, what does “among the coldest in centuries” mean quantitatively? My first instinct was, that it should mean among the coldest 10 in the data record, or perhaps the “frigid dozen” coldest 12 in the record. But again, let’s be generous and include all winters in the coldest 10% — that amounts to 35 out of the 355 complete winters covered by the CET data.
Here is the average wintertime temperature in the CET data, and I’ll circle in blue the coldest 35, i.e. the coldest 10%:

It turns out that the number of winters in the CET record from the last 30 years, which fall into the coldest 10% of the data record, is equal to zero. This we can all agree on: that “several” — however you quantify it — does not include zero.
You might wonder, which of those winters fall into the hottest 10%? Here they are, circled in red, and I’ve also added an extra circle in blue to indicate the hottest 5 winters (click the graph for a larger, clearer view):

None of the recent winters has been “among the coldest in centuries,” but quite a few have been among the hottest in centuries. Even if you restrict “hottest” to include only the hottest of the hot, it turns out that 2 of the 5 hottest winters on record have happened in the last 30 out of 355 winters.
Now let’s consider the claim that “the 2013-14 winter was one of the coldest and snowiest in memory for much of the United States and Canada.”
I haven’t studied the data for all the states of the U.S. and provinces of Canada — nor shall I, because even if it’s true (perhaps you can understand why I don’t take Driessen and Legates’s word for it) it’s irrelevant. There are always extra-cold spots and extra-hot spots; to highlight only the extra-cold without even mentioning the extra-hot is, in my opinion, misleading. Are there areas in the U.S. or Canada which were extra hot? Here’s the average wintertime temperature for the most populous U.S. state (and one of the geographically largest), California:
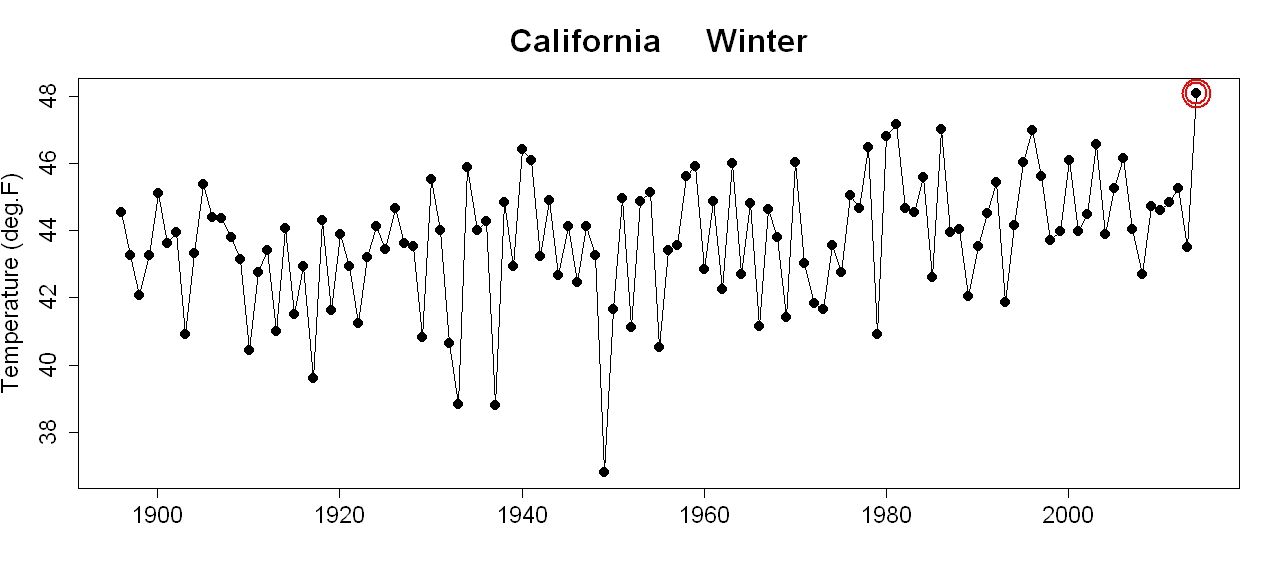
The 2013-2014 winter in California wasn’t just “one of the hottest in memory,” it wasn’t just “one of the hottest on record,” it was the hottest on record.
My opinion: Driessen and Legates used a false claim (about U.K. winters) to cast doubt on global warming. They used a claim which might be technically correct but is clearly misleading (about U.S. and Canada winters) to cast doubt on global warming. They really should know better, indeed would know better if they were more interested in the truth than in pushing some agenda. And they did it all in a post highlighting the need for accuracy.
Does that amount to culpable ignorance? Dishonesty? You make the call.


Across the continental United States the average ’13-’14 winter temperature was probably on the cold side, but according to NOAA’s map (below) there doesn’t appear to be a state that had temperatures within the 4-coldest winters. California indeed had a record high temperature winter. Even precipitation was rather “meh” in terms of records, probably about average *on* average, though very dry in the SW/W.
Reblogged this on Hypergeometric and commented:
Yes, specific definitions matter.
Well, Paul Driessen, and David Legates.
What would you expect?
“Cold” is a relative word. It seems you did not notice that the CET data is biased towards colder winters in the past.
So, you should compare each year with the average winter temperature in the previous 30 years. If you do that, I am sure the 2008-09-ish local low will become one of the coldest winters relative to how it felt to locals at the time, which is what really matters: how it feels relative to what you are used to.
[\tongue in cheek]
Missed the blog, glad to see you back!
Excellent work as always. I thank you.
Yay! Very Glad to see you back. Your blog has remained a useful reference even you were not “minding the store”. A body of work that has already proven to be of lasting value.
Thanks for all you have done already.
…and yes, of course they are lying… as much to themselves as anyone, because they have invested so much in their errors that they cannot deal with the inconvenient truth.
Huh. Alex C’s comment shows California is the most extreme example, with none of the other 48 states shown having set a temperature record this winter. That is the only state this post discusses. Isn’t that cherry-picking? I mean, you say:
If it is misleading to “highlight only the extra-cold,” isn’t it just as misleading to highlight only the extra-hot? Isn’t the right thing to do what Alex C did, and show how things were, overall?
[Response: You have really missed the point. If I had proposed the record warmth of the California winter without any context as being evidence of global warming, maybe. But I didn’t — I used it to illustrate the lack of context in the aforementioned post.]
Alex C’s first graph shows If you had “studied the data for all the states of the U.S. and provinces of Canada” you’d know temperatures the 2013-14 winter really was one of the coldest in memory for much of the United States. Something like half the United States had a winter in the bottom 1/3rd of cold winters. Only a quarter of it had a notably warm winter. That’s a meaningful point and Paul Driessen and David R. Legates were right to highlight it.
[Resopnse: No, it’s not, and neither are you.]
Nice to see a new post from you — it’s been a while.
While I agree with your analysis (as usual), I can’t help but wonder why you would bother with these people? What makes them worth your time? (I’ve never heard of them, but that may be a reflection on me).
I would think that a key concept to understand when thinking about global warming is the meaning of the term “global”, as in “not necessarily in my back yard”. These people seem to be ignoring that. So, for example, the north central and northeastern part of the U.S. had a pretty cold winter in early 2014 — the coldest in quite some years. Other parts of the world (and indeed other parts of the U.S.) were relatively warm, and 2014 globally seems to be on track to be possibly the warmest on record (http://www.ncdc.noaa.gov/sotc/global/2014/10). I would think it ought to be sufficient to point that out rather than focusing on a detailed data analysis of one small part of the world.
This xkcd cartoon comes to mind: http://xkcd.com/1321/
But, I don’t mean to be critical. If you think it’s worthwhile to take these guys apart, go for it.
Welcome back, indeed!
Since you left the statement that “there has been no warming since 1995” as an ‘exercise for the student’, I’d say that that is both false and misleading.
1) Average (mean) UAH anomaly prior to and including December ’94: -0.14; average UAH anomaly from January 1995, 0.143.
2) Since UAH doesn’t give annual anomalies, I calculated them as the mean of the monthly anomalies for each year tom ’79-‘2013. Of the anomalies up to 1994, 13 were negative while only 3 were positive; the warmest was 1992, at 0.02C. From 1995, there are 14 positive anomalies (of which 13 were warmer than 1992, and most by a large margin) and 5 negative. Of the negatives, the coolest was 1997 at -0.075 C; that compares with the coolest of the early years, 1984, at -0.3525.
So, the period since 1995 has obviously been much warmer than the period before–not what anyone would expect, if they were naive enough to believe Driesen and Legates. That makes their claim misleading. But it could still be technically true, if there had been warming prior to 1995, and then the temperature stayed elevated in some sort of, oh I don’t know, “pause” or “hiatus” or something. The mean value in such a case would be lower in the earlier period than the later, since the earliest ‘cool’ values would bring down the mean for the first portion of the record.
However:
3) Using woodfortrees to calculate OLS linear trend for the period since 1995 gives a yearly warming trend of better than a tenth of a degree per decade:
http://www.woodfortrees.org/plot/uah/from:1995/trend/plot/uah-land/from:1995/mean:13
So, there’s substantial warming since 1995, regardless of what happened earlier.
Clearly, the ‘no warming’ claim fails egregiously.
Ignorance? I’m not sure. Culpable? Unquestionably.
Actually–and ironically–if you use UAH to examine the record *TO* 1995, you do find a ‘pause’:
http://www.woodfortrees.org/plot/uah/to:1995/trend/plot/uah-land/to:1995/mean:13
So a better-supported claim (for the UAH record, at least) would have been, “Warming has accelerated drastically since 1995…”
Of course, it’s still ‘ballocks,’ as our British friends might say: for one thing, the earlier record is heavily affected by a couple of rather well-known volcanic eruptions, which would need to be taken into account.
Looking at your CET chart it looks like two of the post 2000 Winters are the #7 and #17 coldest since 1900. If my eye (cataract in one) is accurate, how does that make “among the coldest in Centuries” (20th and 21st) misleading? Cherry picking perhaps, but your interpretation of centuries as 355 years was too. I’ve often seen “centuries” being used to denote from 1900 on to the present.
[Response: I’ve never seen “centuries” used to denote “from 1900 to the present.” It’s nonsense. Look up the definition of “plural.” Using all the available data (that’s what is in the CET record) isn’t charry-picking. All you’re really doing is grasping at straws in the vain hope of justifying their claim by casting doubt on the facts.]
Likewise “one of the coldest in memory in much” is sufficiently qualified enough that if it was in a commercial the FTC, wouldn’t even blink. “One of” is a very elastic term, “in memory’ reduces the time frame, as the average person in the United States, is 37, and “much” is so elastic as to be nearly meaningless.
[Response: Now you’re applying “in memory” to the claim about U.K. winters, when that’s not what they said. They only applied “in memory” to the claim of U.S/Canada temperatures. Again, you’re grasping at straws in the vain hope of justifying their claim by casting doubt on the facts.]
Looking at Alex’s chart, even without the Canadian Provinces, it looks true to me. For eight states to have had their Winter be in the top 12 coldest in 119 years and 10 more in their top 25 coldest in 119 years, how could you argue otherwise? Is 18 much of 50? If those states’ residents average only 35 years (37-2) of Winter memories, isn’t it also highly likely that the residents of the 26 states in the chart whose winter was in the top 50 coldest out of 119 would consider last Winter to be amongst the coldest in memory? If the average aged person in that majority of states views it as amongst the coldest in their memory why is to write that misleading?
[Response: More of the same. Thank you for illustrating, better than I ever could, the lengths one must go to to justify their claims as relevant.]
I won’t argue the 1995 warming, though I assume they are cherry picking some limited dataset that makes their statement defensible, if misleading. Which is pretty close to how I’d summarize your blog post.
[Response: I won’t argue further with you. But I will tell you this: you could be part of the solution rather than part of the problem — but you’ll have to abandon this kind of thinking in order to do so.]
Decemeber 2010 was very cold in the UK- ice half way up the windows and strange crystaline frosts I’ve never seen before. That was a century record.
Late winter 2013 was also unusually cold. March was the 2nd coldest on record. We built a snowman and the body just sat there for weeks- a week or more into April. Snow usually turns to slush here the next day, often the same day that late in the winter. Again, something I can’t remember, and I’m half a century old. To rememeber weeks of frozen conditions, I have to think back to the 80s, and that was mid winter.
Both of these cold periods were associated with Arctic inversions. They are unusal enough to have pushed down the CET record, which was showing a warming trend. I’ve seen denial web sites try to use this as evidence of global cooling- but it’s a new phenomenon in the UK- at least in my memory. Possibly linked to warming in the Arctic, of course.
Good to see the blog active again, by the way.
Donald –
Same here – March/April 2013 was just bizarre, I remember it being freezing for weeks on end, Problem is, I don’t think people realize quite how far north the UK is and how dependent our winter weather is on heat transport (or lack of) from elsewhere.
Ernst K, you’re channelling xkcd, right?
Yes, hard not to think if that xkcd when “winter of aught-14” arguments are made.
For more context I looked up the GISS global temperature record for DJF 2013-14 and it shows that globally that winter was warmer than any winter from 1880-81 to 1996-97. Since then, it’s anomaly of +0.80 deg C makes it fairly average (one of 9 winters between +0.76 and +0.86).
Re D&L’s “… there has been no warming since 1995…”
According to the SkepticalScience ‘Trend Calculator’, the GISS trend is now statistically significant since January 1996:- ( 0.105 ±0.102 °C/decade (2σ)).
Re CET: November figure just published today. Dec 2013 – Nov 2014 far and away the warmest such period on record: https://twitter.com/?lang=en-gb
PS, I’m not ‘that’ David R.
Good point, and thanks for the update! But D & L don’t say ‘statistically significant,’ leaving one with yet another one of those ‘culpable/ignorant’ judgment calls to make. Did they conflate the ‘warming’ with ‘statistically significant warming’ maliciously or ignorantly? I dunno…
Good points (not that) David and Doc.
Pretty darn rare I’ve ever seen a denialist with a “statistically significant” claim (like Tamino might make), but then again, it has happen every once in awhile.
Rarer yet I’ve seen one that can hold up over the test of time and more data. Can’t think of one right now. Perhaps someone can jog my memory?
Welcome back
The denialists are rushing to get out their “no warming since” articles as it is clear that they will only be able to make such claims using the statistical dregs of the data barrels in the future. Likely they will all be back on the “we can’t trust the data” bandwagon next year.
“There has been no warming since…” is misleading because that would be only true if the argument is restricted to the warming of the *atmosphere* and then only if the argument is restricted to the *global mean* of the atmospheric warming and then only if calculation of said global mean starts in a narrow window before 1998.
Since 19 years it’s getting warmer again… ;-)
BTW: I find fig. 6 on page 4 in the following paper from Hansen et. al. more convincing for the layman that statistical arguments.
Click to access 20140121_Temperature2013.pdf
It shows that temperatures have risen steadily on the southern hemisphere in summer and winter. That temperatures have risen steadily in summer on the northern hemisphere. Only winter on the northern hemisphere has seen a decline in temperatures – mostly attributable to La Nina events in the pacific.
Three times up and one down – that’s a situation where a global mean does not make for a good indicator.
That’s a simple argument, based on beginner’s arithmetics, that has never failed to make the point so far. Even hard-nosed deniers had to resort to bailing out of the discussion or general venting.
It somehow puzzles me, that Hansen’s point hasn’t been made more publicly and more consistently in debunking the ‘warming pause’ myth.
Nice to see you back and blogging again.
Robert: Driessen & Legates:
Check the URLs I included in earlier post. There is a relatively small group of folks who churn out misleading material about climate, which then gets propagated around. It is worth being able to recognize them, and the database there has a pretty good list .
Indeed, and a database that is always worth checking to get a sense of someone’s past record and affiliations.
John — thanks for the prod to go back and read about these people. I am familiar with some of this group, but had not encountered these two previously. I don’t think these people will be moved by data or science, and are probably not amenable to the kind of rational, data-based arguments that Tamino presents in his blog — they seem to have another agenda. So on the one hand, one could argue that Tamino is wasting his time with these people. On the other hand, there are lots of others who are looking for more information and analysis, and could be influenced by this blog (and others), so I am hoping Tamino will continue to be active. I had some concerns about that based on his long silence since July 18. As for myself, I have been doing some data analyses (there is lots of data available) and sharing the results with family and friends. On this scale (much smaller than you or Tamino operate on) I believe I have had some impact. Tamino’s blog has been helpful to me in this regard.
Wether the winters in UK and the United States are somewhat warmer or colder was not the topic the post at WUWT, was it? It was not even an important premise and the authors spent a whopping four lines on this before they moved on to the real topic: the climate forecasting business.
I sometimes find the analysis on this blog convincing, sometimes I agree, sometimes I disagree, but this time I just got the feeling “yeah, so what?”.
[Response: When their post makes false and misleading claims in order to cast doubt on man-made climate change, you think “yeah, so what?” I too am not the least bit surprised by it. But I prefer not to let it pass unchallenged.]
Thanks for this.
It’s good to see you posting, Tamino.
Now that you are back, and badder than ever, how about that artic sea ice bet?
Reblogged this on Michael Trogdon's twenty fourteen blog.
It’s nice to see that the King has returned to the throne. I missed your insight.
For those interested, Ed Hawkins has bulked out the latest CET observations and compared them to the global record: http://www.climate-lab-book.ac.uk/2014/cet-2014/
Coldest and snowiest in memory is accurate. For the appropriate definition of memory….
Welcome back.
I’ve seen a couple attempts to portray the U.S’s cold as refuting the “2014 on track to be hottest on record” stories starting to appear, so I suspect your post here will get some hits. Good timing!
Best,
D
Thank you for taking the time to answer. I realize the time you have to run this blog is limited. Still, I can not help wondering what is you issue with the post at WUWT, scientifically. Much of what D&L writes seems political and I am not surprised you disagree. You may call their politics misleading and dishonest. That may be the nature of politics in the US.
Judging by the title their main gripe with *climate science* is the lack consistency of model projections with temperature data from the last two decades. On this topic, there seems to be disagreement in the climate science community. I remember a short paper by some climate scientists pointing to this inconsistency, I think it was last year.
Do you think the statements of D&L on climate modeling are dishonest or misleading? Can you show this by analysis? If not, then I would say they are not not culpable.
[Response: Let’s see if I’ve got this straight: according to you, when they make false and misleading claims in order to discredit global warming, I’m not allowed to call them on it? I’m supposed to just let them get away with it? They’re not culpable?
That sounds like a weak attempt to draw attention away from their culpability by changing the subject. When people get called on stuff that, their usual tactic is to divert attention by talking about something else — although it is somewhat unusual to be told that I’m not supposed to say so.]
Thanks for the nice post. I think Brandon Shollenberger actually does have a point, though: if you want to show that someone has been cherry picking, it’s poor form to respond by also cherry picking — it just muddles things, rather than clarifying them. (I think, really, that I learned this point from you.) It would have been better form not to address the point than to address it in this way. Probably the more compelling response is to note, as firstdano does, that focusing on North America is itself a form of cherry picking; the global picture makes this very clear.
[Response: Let’s get one thing straight: I did not cherry-pick. I showed a counter-example to THEIR ridiculous claim to illustrate how easy it is to find. Am I to be accused of cherry-picking no matter what counter-example I select? Do I have to do all the work to quantify every region of the U.S., or the entire world, just to counter their falsehood? No.
Don’t let Shollenberger poison the your mind with a ridiculout accusation, only to have the idea take hold.]
Your final sentence takes a fairly minor point and blows it vastly out of proportion. We both agree that you chose a single example to illustrate a reasonable point. We both agree (I think) that you chose the most extreme possible example. You did this without commenting on the method by which you chose your example. I think that was poor form. I also happen to think that in another context you would agree that it was poor form.
(I think you should consider reading my post again, calmly. Note, for example, that you ask rhetorically what you should have done, but in fact I already addressed this in my first comment: I think it would have been better to let the point pass unchallenged than to challenge it poorly.)
[Response: I didn’t choose California because it’s the most extreme example, but because I’m already familiar with its recent climate, having taken an interest in the threat of drought there, and the fact that it’s not just due to low rainfall but also due to recent hot temperatures. I really don’t know, but I suspect that perhaps Alaska is the most extreme example among U.S. states — but it’s not included in the NOAA statewide data.
You might also consider, calmly, whether your criticism was actually a case of “nit-picking.”]
(Of course, it’s totally fine for you to disagree with me: I am just a random person on the internet.)
[Response: And it’s fine for you to disagree with me.]
“You might also consider, calmly, whether your criticism was actually a case of “nit-picking.””
Yes, certainly it was! :-)
Mr. Gnatepink is a bellwether of arguments about weather. Suggest the acquisition of a globe, in order to get a general idea of the size and shape of the earth relative to certain landmasses subject to polar incursions (which themselves are likely consequences of Arctic warming and that same globe’s circulatory troubles).
I join the hordes in being glad to see something here again.
Let’s see. A commenter says Tamino cherry-picked California. His evidence? California is the only state that set a record last winter. How does he know this? He has access to a map that shows all the 48 continental states. Where does this commenter get this map? From Tamino’s post. If Tamino had said “California set a record” without providing any other information, then perhaps the commenter would have a point. But he used Tamino’s graph to imply that Tamino was hiding something.
That is hubris, chutzpah, or whatever else you want to call it, as long as you don’t call it honest.
[…and, glad to see you back. I hope all is well. I was getting the DTs waiting for another post.]
[Response: I think the map actually came from a reader’s comment.]
If Tamino had posted the map in question, I would certainly not have made the complaint that I did.
Although the map was not Tamino’s, the graph was.
Sometimes you’ve just got to fight cherry-picking with cherry-picking if you want to emphasize the pits.
[Response: Hmmm… I don’t like the idea of deliberate cherry-picking, even to fight cherry-picking (unless one makes explicit that it’s been done, and for illustrative purposes).]
Tamino, I did not say anything of that sort and you know it. Of course you can say whatever you like on your blog.
Technically you are right about the insignificance of cold winters in US and UK, so there you score a point. From this you make a straw man argument that the entire D&L post is misleading and dishonest.
[Response: I did not say anything of that sort and you know it.]
For those who care to check, the D&L post is not about winter temperatures – it’s about the recent discrepancy between model projections and real world measurements. That discrepancy is real. You know this.
[Response: If their post is so totally not about winter temperatures, or “no warming since …”, then why did they say it? As for whether the discrepancies that exist have any meaning or relevance, you don’t know this. You ought to learn, if you don’t already know, that they and others take any difference and exaggerate its meaning and significance. But that was not the topic of this post. You know that.]
Maybe it’s not a topic you care to discuss. If you say that this off-topic, we can leave it at that.
[Response: It’s off topic. But the perennial misrepresentation of model-observation differences might be a good topic for a future post. In the meantime, you could take a look at this.]
Petronius Knipetang,
Allow me to try. When you make a claim that there is a discrepancy between model and observation, it is incumbent upon you to show that the discrepancy is significant and relevant. D&L do not do this–quite the contrary. In point of fact, there is no significant discrepancy. In fact, we can point to many model runs that show a similar plateau behavior to what we have seen since 1998. We can even look at the reasons why the temperature rise in the past decade was lower than that seen in the 90s. Tamino has in fact done this (see Foster and Rahmstorf 2011)–showing that the anomalous series of La Ninas, volcanic eruptions and solar irradiance are sufficient to explain the discrepancy. In fact this analysis showed that when corrections for these 3 forcings are applied, that the slope of the temperature rise is consistent across 3 decades. Unless they are total ignoramuses, D&L know this. So we are left with the choice of ignoramus of charlatan. You pick.
BTW, another way of looking at the temperature data series is that a normal year is now as warm as a record-setting El Niino year 16 years ago. I wouldn’t take comfort in that if I were you.
[Response: Continued discussion of model-data comparison really is off topic for this thread.]
I pick … charlatan. There, that wasn’t so tough. Mashey has the goods. I have a background in wind power, and by an amazing coincidence, Driessen has also authored some asinine anti-wind articles.
Thanks for the link, Tamino, and thanks for the explanation, snarkrates. I look forward to a post on this topic.
[Response: I’ve got several ideas “in the queue,” but I think it’s a good topic. I’ll try to get to it before too long.]
Petronius, further to snarkrates advice to look at Foster and Rahmstorf 2011, (see https://tamino.wordpress.com/2011/12/06/the-real-global-warming-signal/ ) also see the current post at Skeptical Science on the cooling impact of multiple smaller volcanic eruptions or the recent past (rather than larger eruptions like Pinatubo).
Regarding the quote:
The claim is completely false for the UK, as shown by Tamino above. It’s completely false for Europe too –
http://www.eea.europa.eu/data-and-maps/figures/annual-winter-december-january-february-and-summer-june-july-august-mean-temperature-deviations-in-europe-1860-2007-oc-the-lines-refer-to-10-year-moving-average-european-land-6
Every single winter since 1990 has been above the pre-industrial baseline, and warmer than many of the winters in the preceding 150 years. None of the UK and European winters since 1990 are anomalously cold – they are all anomalously warm, compared to the pre-industrial baseline.
Even if we had seen several anomalously cold winters here, it still wouldn’t constitute a “cold spell” as the mean winter temperature could still be rising (which does indeed seem to be the case) and in any case winter temperatures tell us nothing about mean annual temperatures, which since 2000 are the highest in the instrumental record.
So everything about that first claim is completely false, and the argument is a complete non-sequitur. Far from having a “cold spell”, we’re actually in the hottest years in the instrumental record, as the WMO have just pointed out.
If I can find this out so quickly and easily, the WUWT authors most assuredly know it as well, so they’re lying. Simple as that.
Pete DuPont is best known for supporting a Houston think tank of great churnalistic service , The National Center for Policy Analysis, which has contributed staffers to The Heartland Institute.
But Pete was also Governor of Delaware and Legates was, after all, Delaware’s State Climatologist, back when Pat Michaels invented the institution of politically appointed State Climatologists.
The number of recursive loops to the same PR platoon seems nearly infinite- as befits Advertising 102 B, The Art of the Testimonial – across the political board, the nation’s climate communications and environmental journalism programs are scarcely less incestuous