
In the last post we looked at the extent, area, and volume of Arctic sea ice. We also mentioned that we can derive other quantities from these, namely the average thickness as the volume divided by area, and what I called the “spread” which is the extent divided by the area. I’ve also been looking at the difference (rather than ratio) of sea ice extent and area, which I’ve dubbed the “split” (for lack of a better term). I’ll take up spread and split in another post, at the moment let’s see how thickness has changed over time.
Note that thickness can decrease even when total ice (i.e. its volume) increases, if the ice is spread over a larger area so the average thickness is smaller. Likewise it can increase even when total ice decreases, especially if the thin ice melts away much more than thicker ice.
Therefore, although extent, area, and volume all tend to be greatest around March and smallest in September, the annual cycle of average thickness will peak and trough at different times of year. Here, first of all, is the monthly time series of thickness computed as sea ice volume divided by area:
If we “fold” this data with a period of one year (i.e., plot it as a function of month rather than of time) we can see the annual cycle (click this, or any, graph for a larger, clearer view):

For individual months, I’ve plotted thickness values in time order so this is actually 12 “time series plots” (one for each month) squeezed into a single graph. I’ve also plotted (in red) the average value for each month in order to highlight the average seasonal cycle.
Averaged over the 34 years of data coverage, the thickness cycle has peaked in July and reached its minimum in December. Note also that average thickness has decreased over time in all 12 months of the year, the decrease has been much greater during summer and fall months. It has also been most severe quite recently, since 2010. All this has changed the shape and the timing of the annual cycle of thickness. We can see this even more plainly if we compare the average annual cycle for times prior to 2010, to that after 2010:

Averaged over the last three years, the annual thickness cycle has peaked in May and bottomed out in November, shifting its timing by about 2 months. It has also changed its shape. Prior to 2010, the cycle showed a slower rise to maximum and faster drop to minimum, but recently the rise and fall have been at about the same rate so the cycle is more symmetrical about its peak (and is more “sinusoidal”).
It’s also worth noting that the annual maximum thickness is now about equal to the pre-2010 average annual minimum. The decline in sea ice thickness has combined with the decline in sea ice area to bring about the amazing decline of Arctic sea ice volume.
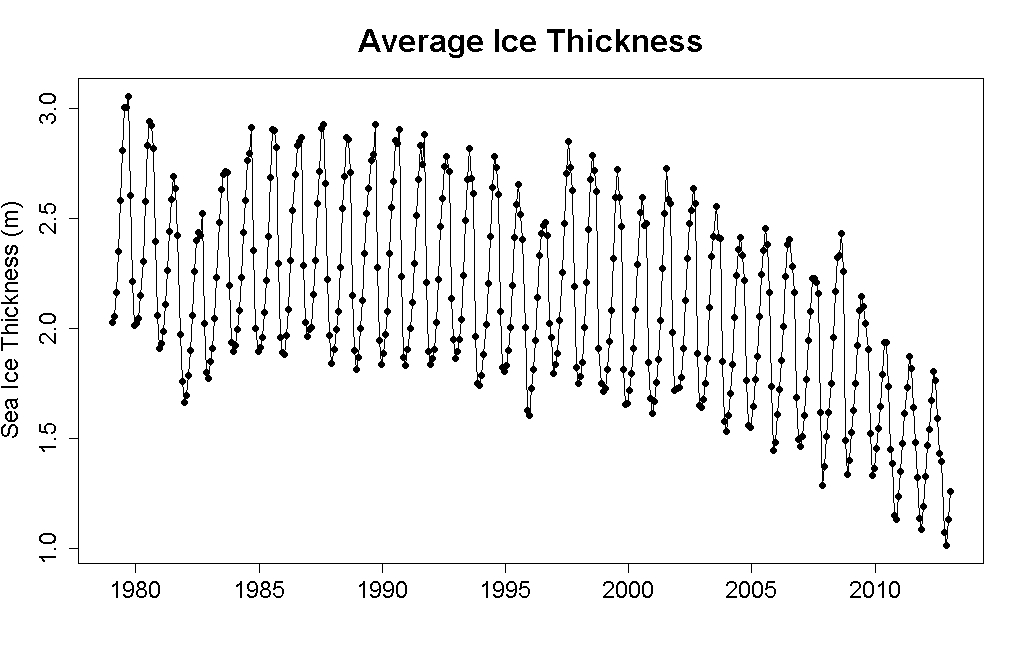
The overall decline is clear from a time series plot of anomaly values:

This also reveals that 2010 was the year that the “bottom dropped out” of sea ice thickness. Lest anyone suggest that thickness has stabilized since then, here is the time series plot of annual average thickness (not anomaly):

Even since the precipitous 2010 drop, sea ice thickness has continued its decrease, and is now more than 40% below its 1979 value.
Windowed Fourier analysis shows the changes in the annual cycle, which identifies 2010 as not only the year that the “bottom dropped out” of average value, but also the year that the annual cycle underwent dramatic change. The cycle’s amplitude decreased:

So too did the relative phases of the 3rd and 4th Fourier components (shown here in red and green with the relative phase of the 2nd component in black):

The change in the timing of the 3rd and 4th Fourier components relative to the 1st (the fundamental) is related to the pronounced shape change of the annual cycle. The timing of the annual cycle also showed extreme change in 2010:

All in all, the thickness shows a consistent downward trend throughout the satellite era combined with a sudden and extreme change in its character in 2010, when it decreased sharply and the size and shape of its annual cycle altered.
We usually think of 2007 and 2010 as the “banner years” in Arctic sea ice change. For extent, area, and volume, they are, especially since the annual minima in those years were such extreme record-breakers. Also, it was in 2007 that their annual cycles changed, increasing in amplitude. But when looking at thickness data, it’s 2010 which stands out above the crowd. I’m not sure why, but it occurs to me as a possibility that it was then that much of the older, multi-year ice disappeared, leaving behind nothing but much younger, thinner ice. I’m not sure where to get data for the amount of multi-year ice (perhaps someone knows?).
This much is clear: even after its banner year 2010, thickness has continued to decline. So have extent, area, and volume. The one thing we can say for sure about the most recent changes in Arctic sea ice is that it is most assuredly not “stabilizing.”
In part 3 I’ll look at the sea ice “spread” and “split.”


It’s numbing how often I reread this type of material, and find myself to be still as scared by it as the first time I came across it.
Humans have managed to destroy one of the largest geophysical features and ecosystems on Earth, in just a few generations. Next stop: the global ocean.
Recovery? Stabilization? Where and why? I’m just back from Patagonia, Chile, it’s not stabilizing or recovering there. The temperature goes up; ice melts. People who look for magical trends to attempt to prove that ice (sea ice, glacial ice…) anywhere is stabilizing or recovering need to get out more.
Denial disappears when there is money to be made.
http://www.smh.com.au/environment/china-plans-shipping-short-cut-across-arctic-ocean-20130313-2fzxr.html
When I read this article, the video to the right of the web page was titled “Melbourne’s hottest March night on record”.
Very nice post. An emphasis on volume and thickness is needed when trying to explain the enormity of the problem.
Terry
which came after the longest number of consecutive days on record (9) above 30 deg C.
Those days were all above 32 deg C by the way, but I don’t know what the previous record for consecutive days above 32 deg C was.
Judging by this, Melbourne might have just had its hottest monthly average (both max and min) on record.
This might be a more permanent link for Melbourne’s longest number of consecutive days above 30 deg C on record.
Tamino,
In their September 2012 Arctic Sea Ice News and Analysis the NSIDC credited M. Tschudi and J. Maslanik, University of Colorado Boulder with the image of old sea ice (scroll to the bottom of the post to see the graph). You could pixel count the image or better, write to the authors for the original data.
No warming for 15-16-17 years! The temperature has gone up in our room and the fridge is defrosting, clearly the projections did not expect the fridge door to be quite so loose. I can’t quite get my head around a world where the sea is warming but the surface is constant [ish] and I still need to stop and think with the ENSO cycle that cooling years is when the sea is warming and the hot years are when it is cooling. It does make perfect sense and heat sinks of water are used in green energy projects and the out door swimming pool I went to as a kid tended to be a constant 60F over the summer despite the daytime temperatures. Curious though that it took climate science by surprise especially considering most of the planet surface IS OCEAN! [I’m sure some one will direct me to papers that did the correct projections- I would be grateful]
If this global warming of the seas becomes the trend [ i.e. another 15 years of ‘no warming’] then I think I prefer the old projection of warmer surface temps as all that energy is going to create the a more violent world. The Met Office way back, over the last couple of decades, stressed there would be winners and losers and just because the UK would be a ‘winner’ with warmer summers and milder winter we should not ignore the wider problem.
Well it seems we [UK] are going to be a big fat loser as well.
Perhaps someone can inform me of what constantly warming oceans mean. Evidently they transmit heat quickly to the cold bits and quicker than expected. I don’t imagine them to boil away [not yet] but will they give their energy off like ENSO [cycles of surface warming/cooling or with just more violence?
Do you not realise that there is all the difference in the world between “no warming” and “no statistically significant warming.” The extra worlds are actually there for a reason.
I would argue that the warming trend (ie global surface temperatures), far from halting in the 1990s as you try to insist, continued to accelerate until the middle of 2007.
Even the phrase “no statistically significant warming” is a bit misleading. The statistical test will tell you if the calculated trend is significantly different from the expected trend. If the expected trend is zero, then you are testing whether the trend is significantly different from zero. You can just as easily do a test to see if the calculated trend is significantly different from any other value – such as the past trend. In the latter case, the result is that the recent trend is not significantly different from the past longer-term trend (which was significant).
Combining the two tests, the current calculated trend is not significantly different from zero, and not significantly different from the past trend. In simple words, the data from the recent period is not sufficient to be able to distinguish between a true zero trend and a true “warming continues at the same rate” trend.
If you want to make any claim that looks like “the warming has slowed or stopped”, then the test that applies is the one that uses an expected value equal to the trend that you are claiming has “slowed or stopped”, not zero.
Hi Bob and Al- I don’t deny warming in recent years. I am curious about the way the oceans have soaked up that extra energy and why – given most of the earth surface is ocean, and that water is a natural heat sink- anyone should be surprised that the ice cap will melt first before surface temperatures show obvious and massive increases.
I think its important that the ‘warmist’ community doesn’t jump to conclusions when questions are asked- I use the term ‘no warming’ sarcastically.
julesbollocks.
If you were resorting to sarcasm, perhaps you should have work harder on sign-posting your sarcasm rather than simply repeating it.
You inquire twice now about “what a constantly warming oceans mean”, about oceans ‘soaking up that extra energy.’
These don’t really indicate very precisely what it is you’re seeking to understand.
Do you seek explanation of why oceans remain so cold, or why they need heating, or the mechanisms that control their heating, or the relationship between ocean heat content and surface temperatures? Or is it something else?
no reply option in your last post- and I will use smilies for sarc! [even though the ‘no warming in x years’ is a parody of scepticism and should no longer be answered given that the Arctic ice is melting more and more]- my question about ocean warming is a straight forward projection. given the current rate of ocean warming what are the longer term consequences?
Ocean warming/cooling cycle over apparent half decades like ENSO- in the Atlantic the heat seems to be going straight into the Arctic- So I wonder what sort of projections are envisioned with regards to this extra energy? Will the oceans just absorb this energy and return it as storms? are there limits to how much energy the oceans can absorb? and if there are limits where will the extra energy end up?
These are very basic questions that I have failed to find answers for. I hope that makes more sense.
julesbollocks.
“These are very basic questions that I have failed to find answers for. “
Indeed. And there are reasons for that.
Rising Ocean Heat Content doesn’t really feature as such on the list of horrors awaiting us in an AGW world. Even the IPCC AR4 doesn’t list it. Two OHC-related effects are in the list – Sea Level Rise and the Gulf Stream. The first will probably be entirely dwarfed by sea level rise due to melt in Greenland and Antarctica and the second could (lots of question marks) result in interesting times for us in Western Europe but IPCC AR4 assess it as “very unlikely” for it to turn nasty in a hurry over the next 100 years.
And I think I detect you conflating OHC with Sea Surface Temperature. The latter is a driver of weather events (indeed drive hurricanes but it is more complex than ‘more temp=>more hurricanes”,) and also exhibit wobbles the likes of ENSO & AMO. But OHC is more benign and has far less variability as graphed here.
Despite the oceans being the recipient of the majority of global warming, they remain mainly a sluggish environment, their major overturning motions even described as “vulnerable”. On the whole, this is because the heating is from above (mostly) and cold water sinks. Saltiness adds another complication so. For instance, ocean heat has always been flowing into the Arctic in a big way. That flow has been shown to have increased recently but the ice sits insulated on an upper layer of lighter fresh but cold water and so is protected from the full heating effect. This perhaps illustrates that oceans are, energy-wise, mainly sluggish but also complex.
OHC has to rise to simply to allow higher surface temperatures to exist. Because this rising in OHC is a slow process involving a lot of energy, indeed most of the energy required to raise global temperatures, the majority of AGW arrives decades (and a significant amount centuries) after the CO2 release (or any other forcing) that was the cause of the warming.
For Arctic multiyear ice (MYI) data, try Neven’s Arctic Sea Ice blog’s 2011 “New paper by Polyakov, Kwok and Walsh” and the recent “CryoSat-2 reveals major Arctic sea-ice loss” discussions (and references). Chris Reynolds (e.g. February 13, 2013 at 20:11) may have the data you want.
Analysing trends in average ice thickness is problematic because the average hides a lot of heterogeneity. In particular with multi year vs new ice, which especially in older times had much different thickness – witness that the peak in thickness was in Sept, when there was mostly old thick ice remaining. In more recent times of course the amount of multi year ice is smaller, and the annual response is more affected by thinning of the relatively larger extent of thinner ice – hence the gradual decline in thickness during the summer.
There’s a chart of Multi Year ice remaining during the minimum week in September at http://www.epa.gov/climatechange/science/indicators/snow-ice/sea-ice.html… description of where the data comes from can be found at http://www.epa.gov/climatechange/pdfs/sea-ice_documentation-2012.pdf (mostly from NSIDC, of course)
The graph you link to copies the NSIDC’s graph although a little less colourfully.
I am not an enthusiast of the graph formats used by NSIDC. To better appreciate the reduction in ice of different ages, a bar graph is advisable. Viola!!
Here’s an explanation for the drop in 2010 from the NSIDC in October 2010
http://nsidc.org/arcticseaicenews/2010/10/
Last winter, the wind patterns associated with the negative phase of the Arctic Oscillation transported a great deal of multiyear ice from the coast of the Canadian Arctic into the Beaufort and Chukchi seas. Scientists speculated that much of this ice, some five years or older, would survive the summer melt period. Instead, it mostly melted away. At the end of the summer 2010, under 15% of the ice remaining the Arctic was more than two years old, compared to 50 to 60% during the 1980s. There is virtually none of the oldest (at least five years old) ice remaining in the Arctic (less than 60,000 square kilometers [23,000 square miles] compared to 2 million square kilometers [722,000 square miles] during the 1980s).
When you refer to banner years for other (non-thickness) ice parameters in the 2nd last para, did you mean 2007 and 2012 rather than 2007 and 2010?
[Response: Yes.]
And now there’s this find of extensive fractures in the Arctic ice: http://www.climatecentral.org/news/large-fractures-spotted-in-arctic-sea-ice-15728
Doesn’t sound much like “stabilization”.
I am really pleased you are applying your energy, intelligence, and analytical skills to this topic. I look forward to your third post and the overall conclusions.
I, too, have been thinking about this issue, though descriptive statistics and graphs are more my speed at 40 years after graduate school and 20 years after I went from research to administrative work (also known as the dark side).
The site I’ve found most helpful is https://sites.google.com/site/pettitclimategraphs/pettit-climate-graphs, a site suggested to me by a commenter on this blog. And for the collapse of ice volume, the PIOMAS sea ice volume at yearly minimum data Pettit presents in “Artic Sea Ice Volume: Annual Maximum and Loss, and Ice Remaining at Minimum” https://sites.google.com/site/pettitclimategraphs/sea-ice-volume#asivamlir seems to be particularly useful. Do you find the following nontechnical summary close enough to your analysis?
The course of events displayed in the graph is that the sea ice volume minimums for 18 of the 19 years 1979-1996 are between 17 and 12 thousand cubic kilometers (one lower), 8 of the 9 years from 1996 – 2006 are between 11.99 and 8 (one higher), all 5 of the years 2007 – 2011 are between 7.99 and 4, and 2012 is between 3.99 and 0. Rounding these numbers for expository purposes, in the recent past it has taken 20 years for the sea ice volume minimum to fall from 17 and 12 thousand cubic kilometers, 10 years to fall from 12 to 8, 5 years to fall from 8 to 4, and we are now in our first year below 4.
So I guess my questions are: Are there any physical processes underway that will stop or reverse this decline, or are we headed to a functionally ice free arctic? (By functionally ice free, I’m using Stephanie Pfirman as quoted on http://nsidc.org/icelights/2011/05/03/when-will-the-arctic-lose-its-sea-ice/, “Many climate scientists use the term ‘ice-free’ in a functional way, as a shorthand to mean very little reflective surface at the end of the summer when sea ice is at its minimum.” This would allow for studies that indicate “some of that ice will remain, pushed by the prevailing winds to pile up along the northern Canadian coast,” also quoted from the NSIDC URL, but not Prof. Pfirman.) If the arctic is going to become functionally ice free, when will that occur? What will this lack of ice mean for further global heat absorption and warming in general and ice melting in particular?
Or, in nontechnical terms, how worried should I be?
I have long supposed that the decline in Arctic ice will be asymptotic, that soon it will level out and a small amount will linger. A discussion at skeptical science delved into the physical processes which may accelerate or hinder the ice loss, the general consensus was worrying.
Pretty much all the physical processes are working against a slow down in the disappearance of sea ice in the Arctic.
See Bob Wallace’s comment number 13 and onwards,
http://skepticalscience.com/2013-arctic-sea-ice-prediction.html
Before I would think to myself that the predictions of an “ice free” sea in the summer Arctic by 2015 were silly. A case of using extrapolation too far. Now maybe that sort of prediction is not too far off, depending on the weather. Of course some sea ice will persist in sheltered areas but otherwise the outlook is grim.
“Chumpionship Wrestling”
— by Horatio Algeranon
As ice gets thin
The skull gets thicker
The facts should win
But here’s the kicker:
It’s hard to pin
A cherry picker
Tamino,
I really should have read this before posting on the next post in this series. And I obviously should keep more up to date with what you post rather than leaving visits to once a month (or less).
The 2010 year is something I’ve been banging on about for over a year now. It is a great an event as 2007, but was hidden because it was a volume loss without an accompanying area loss.
2010 was a volume loss event that stands out as the most recent in a set of 5 large events:

2007 being the other recent one. These two most recent events are significant because they happened at a time of low volume following decades of loss of volume from the removal of thick multi-year ice (MYI).
2010 was caused by a combination of export of MYI into the Siberian seas, and (probably) a lack of thinning due to warm anomalies over the winter of 2009/10, the winter of the Warm Arctic Cold Continents pattern.
http://dosbat.blogspot.co.uk/2013/03/what-caused-volume-loss-in-2010-part-2.html
2010 led to the destruction of a substantial amount of MYI, causing thickness levels to plummet because of a preponderance of thinner FYI (first year ice). MYI grows thicker by ridging, it can get very thick, the thermodynamic limit to thickening of FYI is of the order of 2m. This thinning is most evident in the distribution of volume attributable to ice of various thickness categories for September.

This removal of ice has led to a change in the seasonal cycle which is seen in the anomalies as an aggressive spring melt.

I’m still working on my next post on this matter, but in a nutshell, the cause of this spring melt is that from April to June MYI thins little, but FYI has a wider spread of thinning. This is using thickness in April as a proxy for sea ice being FYI or MYI. Why this should be is due to the treatment of thickness in the PIOMAS model, which may have significance for the real world. However as I argue in the post at the second link of this message, I see good reason to take the 2010 event and its effect on melt as real.