
For the sake of those with the guts to face hard science, who are willing to invest enough actual thought to learn something more complicated than soundbites and platitudes, we’ll address some of the mistakes in Joe Bastardi’s comment. There are too many to address them all in one blog post. So let’s start small, with just the first paragraph:
When one pushes an empty cart and then stops pushing, the cart keeps moving until the work done on it is dissipated. How is it, that the earths temperature has leveled off, if co2 continues to rise and it is supposed to be what is causing the rise.. The answer is obvious. it is the earths temperature which is driving the co2 release into the atmosphere. That is what Salby opines, and he is correct.
Congratulations, Joe, you’ve managed to squeeze quite a few fallacies into a single paragraph. Impressive indeed.
Consider the first sentence:
When one pushes an empty cart and then stops pushing, the cart keeps moving until the work done on it is dissipated.
Objects in motion have an inherent tendency to keep moving. We’ve known about this since the days of Galileo, and Newton formalized the principle as his first law of motion. It applies to massive objects in motion (or at rest, for that matter). It does not apply to global temperature. There is no such thing as an inherent tendency to “keep warming” or “keep cooling.” If there were, then that would violate the first law of thermodynamics.
If Bastardi is suggesting that our climate system exhibits such a tendency, he’s mind-numbingly wrong. If not, then what’s the point of his very first sentence?
Let’s move on to the second sentence:
How is it, that the earths temperature has leveled off, if co2 continues to rise and it is supposed to be what is causing the rise..
I’m so glad you asked.
This offers a fine illustration of the fact that simplistic one-liners aren’t sufficient to understand what’s going on. There are three parts to the answer. Let’s hope that’s not too much for Joe Bastardi to handle.
Let’s consider each in turn. First, take a look at this obvious downward trend in temperature data:

We can even put it into context with more data:

It sure looks like temperature has “leveled off” since 1998 — in fact, perhaps since 1996 or even earlier! That’s obvious, right?
The problem with that conclusion is that these are not temperature data. They’re artificial data. They were constructed by combining a constant upward trend at 0.018 deg.C/yr (about the same as in the real world) with random noise having a standard deviation of 0.1 deg.C (about the same as in the real world). There is absolutely no doubt, none whatsoever, that the actual trend is not only upward, it’s at exactly the same rate throughout, it didn’t stop or slow down or level off. We can be quite certain, because the data were made that way.
I didn’t get that by generating lots and lots of random data sets until I found one showing this behavior. I just created one such data set, and there it was. It illustrates the fact that on short time scales, the appearance can be misleading, which is entirely due to the noise in the data, while the signal simply continues its increase at the same rate for the entire time span.
It’s the very nature of statistics that not only is is possible for false trend reversals to appear for no other reason than random noise, it’s actually inevitable. In fact it’s even easier for this to happen with real global temperature, because the randomness exhibits autocorrelation. That’s why, if you really want to know whether or not global temperature has leveled off, you have to apply significance tests, you have to compensate for autocorrelation, you even have to allow for the fact that a 130-year (or 160-year) record gives you lots of chances to see such behavior just by accident.
Has Joe Bastardi done that?
Let’s move along to the second point. It’s common for fake skeptics to claim that real climate scientists ignore everything which affects global temperature except greenhouse gases. The opposite is true. In fact it’s the real climate scientists who identify those other forcings and study their behavior scientifically, including such things as variations in the output of the sun, explosive volcanic eruptions, and the el Nino southern oscillation.
We can even approximate the impact of these other factors on recent temperature changes. I’ve done so myself; here for instance is the match between known factors and the global temperature data from NASA GISS:

Well, whattaya know? Those other factors really do affect global temperature!
If we remove the non-global-warming factors (solar variation, volcanic eruptions, el Nino), then we’ll get a much clearer picture of how global temperature is changing due to global warming (you know, from the increase in greenhouse gases). I’ve done that too. Here it is, not just for data from NASA GISS, but for all five major global temperature records:
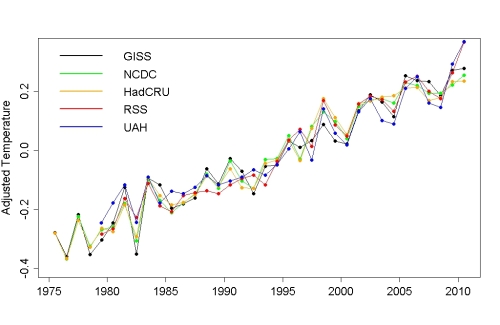
Please note that the global warming part (from greenhouse gases) hasn’t stopped. In fact, it hasn’t even slowed down.
On to the third point. Even if we don’t account for those other factors which affect temperature, global temperature hasn’t leveled off. Bastardi says later in his comment that
… earths temps have leveled off the past 15 years …”
To get some context for the last 15 years, let’s begin by looking at the past 36 years:

I’ve added a trend line (by linear regression) in blue. Now let’s add a trend line (in red) estimated using only the last 15 years:

Note that the trend over the last 15 years is no different from the trend over the last 36 years. Note also that the hottest year of all was last year, 2010. If this is Joe Bastardi’s idea of “leveled off,” then I wonder what’s his idea of “global warming.”
Some would object that you have to use a different data set (like the data from HadCRU, or NCDC, or RSS, or UAH) to see that it’s leveled off over the last 15 years. Unfortunately — for them — it ain’t so:

All five data sets show an upward slope over the last 15 years.
Let’s finish off an already long post with Joe’s final sentences from his first paragraph:
The answer is obvious. it is the earths temperature which is driving the co2 release into the atmosphere. That is what Salby opines, and he is correct.
Joe, please. Even if you were right about the basic facts (which you’re not), this is a logical fallacy. Do you really not get this?
Then there’s this little matter:

Boy, that’s one hell of a hockey stick. If you really believe that temperature controls CO2, then temperature must have been remarkably stable until the industrial revolution starts and you can say goodbye to the “medieval warm period” and the “little ice age.” But quite by coincidence CO2 starts to rise at exactly the time that we (humans) started pumping CO2 into the atmosphere — even more CO2 than has accumulated since that time. What an astounding coincidence that is!
It’s also an amazing coincidence that the added CO2 in the atmosphere since the industrial revolution has shown exactly the “isotopic signature” of fossil-fuel CO2. For one thing, that means that it has less carbon-13 than volcanic or oceanic CO2 because it’s “biogenic” carbon (from plant matter, in this case long-dead plant matter). And for Murry Salby’s information (he discussed the carbon-13 issue), it’s also not modern biogenic carbon because it has vastly less carbon-14 (the “other” rare isotope) than modern biogenic CO2. In fact, the “Suess effect” which originally identified fossil fuels as the source of CO2 increase, at first wasn’t about carbon-13, it was all about the carbon-14.
Let’s not ignore yet another astounding coincidence, that the amount of carbon in both the oceans and in the biosphere is also increasing.
So: carbon is coming from somewhere — God only knows where — but it’s not the oceans because oceanic carbon is increasing, it’s not the biosphere because biospheric carbon is increasing, it can’t be from volcanoes because it has the exact isotopic signature of fossilized biogenic carbon. But it’s not from fossil fuels because Murry Salby says so, even though it starts its increase just when we start burning fossil fuels in large quantities.
How gullible do you have to be to believe this? No real skeptic would swallow that. Only a fake skeptic could.
These are some valuable lessons here. For one thing, the statistical behavior of global temperature (and just about everything) is quite more intricate than meets the eye. For another thing, the evidence that CO2 increase is due to human activity is overwhelming. Perhaps the most important lesson is that fake skeptics aren’t really skeptical at all. Joe Bastardi and his comrades are the epitome of gullibility.
These are just a few of the more obvious mistakes in Joe Bastardi’s comment. But we only got to the first paragraph.


Or as some very right wing sites are putting it about Bastardi, Utter Climate Ignorance, which shows the virtue of Tamino’s persistence. Even the comments are limp
Quite a few dead fish in that barrel. . . still, the precision of their dispatch is praiseworthy.
Seems like a great opportunity for a soundbite of our own: “Joe Bastardi is a weather forecaster. He can’t even predict the weather next week. Why would you trust him to predict anything about climate change?” (with appropriate apologies to weather forecasters who actually live on planet earth)
[Response: LOL]
In the link to Bastardi’s writing from the Settled Science post, what I find especially funny is the following:
“Over a year ago I advised a client of mine at the time to purchase less air conditioners than for 2010 because the summer of 2011 would be cooler than the summer of 2010. Now there is talk that this is going to turn out like last summer, but assuming it won’t, the forecast was made. BEFORE LAST SUMMER.”
I wonder whether, after the 4th hottest July on record the continental US just had, Mr. Bastardi regrets boasting about predicting far in advance that demand for air conditioners would be lower this summer than last summer. Maybe his client only operates in one of the parts of the country that has had a cooler summer but if they sell air conditioners nationwide, I’m thinking they may be an ex-client of Bastardi’s.
Joe has recently tweeted that this summer is only the 38th warmest summer in the U.S. record so far, and the recent cool spell over the central U.S. should push it to 40-45. I haven’t followed the rankings, and I don’t know where he gets those numbers, but I don’t see how that possibly can be right after the 4th warmest July. It’s not good for a forecaster if he or she cannot even forecast the past correctly!
Since June was the 26th warmest, and July was the 4th warmest, it’s highly unlikely that the combined interval could be the 38th warmest.
CapitalClimate are those the figures for global or US temps? Bastardi carefully mentioned US temps not global.
Yes, these were specifically the U.S. rankings.

His tweet:
“Summer so far.. 38th hottest on record for the nation as a whole. The cool shot now will chop that down to 40-45”
http://twitter.com/#!/BigJoeBastardi/status/101272608460382210
Apparently, he’s so busy spewing, he thinks “summer” is “Jan-July”:
(Rank 79 out of 117 is 39th warmest; he made the classic “off-by-one” error.)
Like many forecasters, unfortunately, he’s all wiggly lines and arrows, but a complete train wreck when it comes to actual numbers.
Use “fewer” instead of “less” when the item can be counted.
Fewer air conditioners.
Less understanding.
The isotope data is certainly strong but at a more basic level, try explaining the strong, cold season rise in NH atm. [CO2] without reference fossil fuel emissions.
Jim: Have you seen this beautiful graph from Scripps of the difference between Mauna Loa and South Pole CO2, vs anthropogenic emissions?
http://scrippsco2.ucsd.edu/graphics_gallery/mauna_loa_and_south_pole/mauna_loa_and_south_pole_difference_with_fossil_fuel.html
(I presume the explanation is the time it takes CO2 from the NH to be carried to the SP. So in a sense it’s just a natural way of taking the derivative of the CO2 concentration.)
Tamino: Very well put. The synthetic temperature graph is superb. (But the 1998 peak was a bit of luck, unless you picked the dates.)
[Response: I did pick the dates. The point is to illustrate that short-timescale false reversals are common, which it illustrates well. In fact this wasn’t the only one in the record of artificial data. See this.]
Thanks Kevin, I’d not seen that.
There’s actually more in that graph than inter-hemispheric transport times. That’s showing something very interesting about relative sink strength changes over time in the two hemispheres (or at least, between Mauna Loa and South Pole): the NH sink is decreasing relative to the SH. Given that a decrease in the SH ocean sink from ~ 1980-2005 has been empirically described*, this indicates that the NH sink is decreasing even faster. See http://scrippsco2.ucsd.edu/images/graphics_gallery/original/mlo_spo_record.pdf for perhaps a more helpful image in that regard. Note the increasing separation over time.
Also, I should clarify my statement above. The point is that if you assume Bastardi’s position (that [CO2] increases are not from ff burning), then the large increases in NH cold season [CO2]–on the order of 20 Gt or 10 ppm–must be due (1) almost entirely to ecosystem respiration (Re) on land, or (2) degassing from the ocean. But his is the *cold* season, which argues against massive ocean degassing, and on land means that the *warm* season respiration would be several times the cold season (ecosystem respiration being highly T dependent), which in turn requires an enormous sink somewhere to get the observed atm. [CO2] warm season decline. The only explanation that satisfies all the known changes in oceanic and terrestrial C is land-based sequestration in the summer that exceeds respiration, a reverse of that in the cold season, and a fossil carbon source to balance the atmospheric increase.
*LaQuerre etal, 2007, Saturation of the Southern Ocean CO2 Sink Due to Recent Climate Change, Science 316: 1735.
In addition, Bastardi’s whole argument here is a wonder of illogic. I paraphrase: “CO2 and T do not correlate. Hence CO2 cannot be driving T. Therefore it must be T driving CO2”.
One can easily turn it around to get to the opposite conclusion:
“T and CO2 do not correlate. Hence T cannot be driving CO2. Therefore it must be CO2 driving T”.
Ironically, although the premises are false and the logic is invalid, both conclusions have some truth in them, if one only remembers that there also are other things driving both CO2 (fossil fuels dominate) and T,
I still maintain by offer an open debate to Joe Bastardi that I left on the other thread. My guess is he will not reply, but I would like to see how he performs when required to actually defend the false claims that he has made on the now very non-credible fox news. For example, he says that ~3% of the 1.5 ppm/yr rise in CO2 is due to humans. This is simply nonsense, and it comes from stringing together various contrarian claims (the 3% number is roughly the percent of human emissions relative to total sources, not the percent we contribute to the annual increase in concentrations). He is simply talking to fox news viewers in an attempt to confuse.
*I also noted on WUWT that the “skeptics” reaction to his article there would be a good test of their own skepticism.
Chris Colose | August 13, 2011 at 12:40 am — You could send him an e-mail.
I opine he’ll not reply to that, either.
I’ve been trying to think of a way to clearly show why it’s wrong to think this way. The best I can come up with is the following, but I’m not all that happy with it:
Joe and Gavin go into a store to buy some clothes Joe buys a $30 shirt and Gavin buys a $970 suit. Gavin returns the suit the next day for a full refund. What portion of the store’s profits come from Joe’s shirt?
Ernst, I think that’s brilliant. Simple and to the point. May I use it?
The correspondence may be imperfect, but it is sharp and somewhat provocative, and does get to the issue that magnitude isn’t the only criterion one needs to worry about. I think it’s not bad.
BPL,
Kevin’s “not bad” sums up my opinion of it, but I’m glad you like it.
If you think you can make it useful, consider it public domain.
Except best not to use the word “profits” – it immediately makes one think about irrelevant complications like how much the store paid the wholesaler for the shirt etc.. Better to replace it with “income from this encounter” – or something like that.
Actually, the profit angle is used to account for ocean and land uptake of CO2.
I was event thinking of including a comment like “the store sells all goods such that it’s profits are 60% of revenue” but that isn’t realistic IMHO, so I left it out.
Tamino, in your post “ How Fast is Earth Warming?” (where you calculate the temperature data after removing the effect of ENSO, Solar Cycle and Volcanic Activity) you found an impressive agreement between all datasets, (inluding showing 2010 as the hottest year and 2009 as the second-hottest years) you assumed that volcanic forcing in the 21st century was zero.
You assumed this because there were no big volcanic eruptions after the Pinatubo event. However, there were a series of minor eruptions that caused some negative forcing. This is shown in the article:
“The Persistently Variable “Background” Stratospheric Aerosol Layer and Global Climate Change”
Click to access solomon-07-22-11.pdf
Quoting:
“Several independent data sets show that stratospheric aerosols increased in abundance since 2000. Near-global satellite aerosol data imply a negative radiative forcing due to stratospheric aerosol changes over this period of about –0.1 W/m2, reducing the recent global warming that would otherwise have occurred (…)”
Using this new data, the signal of man-made global warming will surely be even bigger than the results you obtained before.
[Response: Unfortunately the volcanic aerosol data I had didn’t go past 2000. If I repeat the calculation, I’ll try to get aerosol optical depth data since then.]
Tamino, I have just gave you a link to a paper that shows the aerosol forcing after 2000:
“The Persistently Variable “Background” Stratospheric Aerosol Layer and Global Climate Change”
Click to access solomon-07-22-11.pdf
The notion that there is some kind of elastic effect seems increasingly common – it’s a neat little idea that’s very useful for convincing people that warming results in cooling and melting ice caps are a sure sign of the next ice age. Boiling a kettle may seem to end up, eventually, with cold water – modern ones turning the heating element off automatically; for climate, with CO2 as a primary temperature control, the point is that far from turning off automatically, it actually can’t be turned off or back down at all by any normal means. Can’t even pull the plug. The contents boils away and the kettle ends up ruined. If lucky the house doesn’t burn down when it burns out.
‘From Peru’ — the paper isn’t the data, it’s a pointer to what was published.
You gave a link to a copy of this file at junkscience:
The Persistently Variable “Background” Stratospheric Aerosol Layer and Global Climate Change
S. Solomon, J. S. Daniel, R. R. Neely III, J. P. Vernier, E. G. Dutton, L. W. Thomason
http://www.sciencexpress.org / 21 July 2011 / Page 1 / 10.1126/science.1206027
A bit more detail from the pdf article as I wouldn’t trust whatever “junkscience” is claiming about it, knowing their record.
Supporting Online Material
http://www.sciencemag.org/cgi/content/full/1206027/DC1
SOM Text Fig. S1 Table S1 References
24 March 2011; accepted 29 June 2011 Published online 21 July 2011; 10.1126/science.1206027
and Acknowledgments:
The satellite aerosol observations were analyzed by J.P.V. during his fellowship through the NASA Postdoctoral Program at Langley Research Center, administrated by Oak Ridge Associated Universities. It is also a part of his Ph.D. thesis financed by the Centre National la Recherche Scientifique at LATMOS/UVSQ.
The CALIPSO data were made available at the ICARE data center ( http://www-icare.univ-lille1.fr/ ). The authors also want to acknowledge help from A. Hauchecorne, J. P Pommereau, J. Pelon, and A. Garnier in the analysis of the GOMOS and CALIPSO data sets, J. Barnes for Mauna Loa lidar data, and C. Wehrli for PFR data. Funding has also been provided by the Atmospheric Chemistry and Climate Program of NOAA’s Climate Program. Helpful discussions with J. Gregory and D. L. Murphy are gratefully acknowledged.
here’s a really great quote from Bastardi’s article on WUWT from yesterday:
»We have a gas that is .04% of the atmosphere that increases 1.5 ppm yearly and humans contribute 3-5% of that total yearly, which means the increase by humans is 1 part per 20 million. In a debate, someone argued just because it is small doesn’t mean it is not important. After all even a drop with 0.042 gm of arsenic could kill an adult. Yes but put the same drop in the ocean or a reservoir and no one dies or gets ill.«
May be he don’t know that there are10exp19 CO2 molecules in just 1 liter of air? 20 million (if it is correct, I don’t think so) can be a large quantity , but is less than a drop of air!
Notice Bastardi’s complete lack of math to substantiate the last part of his ‘argument’.
Fixed.
— frank
(To clarify, by “last part” I meant the part where Bastardi is supposed to show that “a drop” of arsenic “in the ocean or a reservoir” is equivalent to at least “1 part per 20 million” or more.)
— frank
Regarding CO2 origin, there’s also the fact that CO2 in the atmosphere is increasing about half the amount we are pumping into it. Therefore, non-human influences are having a net effect of sinking, precisely about half of our emissions.
Yes, ‘recovery from the last Ice Age’ is frequently taken to be a physical mechanism, which of course it is not.
Notice also the shift of argument in Bastardi’s reply : he shifted from “greenhouse CO2 violates the first law of thermodynamics” to “1st law of thermodynamics is not violated, but the added heat is negligible”.
Which raises some questions :
– why did he shift from a blatant idiocy to something at least physically more correct (although it shows also serious misconceptions) ?
– did he learn really fast basic thermodynamics, or did he say the first time that the 1st law was violated [i]knowing very well that he said something wrong [/i]? After all, he got a college degree to be a meteorologist, so the first alternative is debatable …
– if the second part of the alternative is true, how can anyone trust him now, since he would be deeply dishonest instead of being only illeterate ? Someone can somehow discuss with someone not learned with physics, but someone deliberatly lying ?
– therefore, how can someone engage in a “open discussion” with “skeptics”, as the deniers and Revkin demand ? It shows at least the way to follow : no discussion, but a barrage of quick answers fueled with Tamino and SKS analysis to make the deniers unhearable. If they do not play fair, we don’t have to do so, and we have a good weapon : correctly used science.
And yeah I’m a fake naive :]
I could only find the following reference to C14 in AR4:
” Carbon also has a rare radioactive isotope, carbon-14, which is present in atmospheric CO2 but absent in fossil fuels. Prior to atmospheric testing of nuclear weapons, decreases in the relative amount of carbon-14 showed that fossil fuel carbon was being added to the atmosphere.”
Can you point me to some C14 data that supports this claim?
B, for starters C14 has a half-life of about 5730 years. With oil you are talking about something tens of millions of years dead and buried,. End Cretaceous was 65.5 million years ago. 11431 half-lifes or thereabouts. Have you ever heard of King Shirhram and the Sissa Ben Dahir?
B Buckner,
The classic paper of the modern era that describes the reduction in 14C in atmospheric CO2 (by measuring tree ring 14C), as burning 14C-depleted fossil fuel “dilutes” the 14C content of atmospheric CO2 is:
P. P. Tans, A. F. M. De Jong & W. G. Mook (1979) “Natural atmospheric 14C variation and the Suess effect” Nature 280, 826 – 828.
http://www.nature.com/nature/journal/v280/n5725/abs/280826a0.html
Use Google Scholar with the Tans paper to find more recent examples; it’s a very well established and doumented observation, although modern analyses (post 1940s) are complicated by the residual effects of the atomic bomb tests.
B. Buckner,
Try here:
Click to access Revelle-Suess1957.pdf
Jim Bouldin | August 13, 2011 at 5:34 pm — Thanks, that was clarifying.
Another classic scientific Bastardi-zation:
“Interesting idea for AGW debate. Next Solar eclipse, track earths temps to see if it drops. Would tell us what we know,the sun is the source”
http://twitter.com/#!/BigJoeBastardi/status/101265551732645888
Well, duh, it gets dark every night, too.
But when global temperatures varied with the ENSO cycles, he said that proved that oceans, not CO2, are driving the global temperature. So which is it, the sun or the oceans? According to Joe, there can only be one driver of global temperatures – that’s why the role of CO2 can be ruled out.
Another way to show why the sun cannot be causing the warming is to view the pattern of warming in the new NOAA climate normals.
The physics of increasing heat-trapping gases tells us:
1) Higher latitudes (toward the poles) will warm the most while lower latitudes (tropics) will warm less
2) Interior continental locations will warm more than coastal regions
3) Winters will warm faster than summers
4) Nights will warm faster than days
Recently, NOAA (2011) issued the latest 30 year climate normals for the United States, and as expected, points #1-4 are evidenced in the NOAA graphics.
If the sun were the cause we would not see the biggest T increases in the low-sun winter and no-sun overnight minimums. And why would “oceans releasing heat” prefer the winter and nights while leaving the days and summers nearly untouched?
Images here: Global Warming: Heat Waves (Yes) – Rollercoasters (No)
Scott Mandia wrote:
Scott, I would expect interior continental locations to warm more quickly than coastal regions due to:
(1) ocean having greater thermal inertia and therefore warming more slowly than land; and,
(2) the drying out of the continental interiors, leading to a reduction in cooling through moist air convection.
I would expect the continental interiors to dry out since:
(1) given the greater moisture content over ocean due to higher temperatures, rain is more likely to fall out prematurely, over the ocean rather than land;
(2) moist maritime air will dry out in terms of relative humidity as it moves inland given the already higher inland temperatures ;
(3) higher temperatures leading to the evaporation of moisture and drying out of the soil; and,
(4) less moisture being carried inland by evapotranspiration such as what currently takes place in the Amazon, given the destruction of forest and forest canopy.
Unless I am mistaken, all of this is irrespective of the cause of global warming. Am I missing something? As an aside, I believe that the other points you raised are fairly solid.
Bastardi:
In that case the CO2 level should have been even higher during the Eemian (125,000 years ago) than it is now because the Eemian was warmer than it is now. Alas, CO2 levels during the Eemian (< 300 ppm) were far lower than they are now.
At this point Salby and Bastardi go into denial about the ice-core data.
I wonder how lucrative is what Salby does. No, I’m not accusing him of anything, far be it from me to do so without hard evidence… but I still cannot help wondering how lucrative it is.
Hmm, last time I heard that “Monnett” was the proper noun.
I suggested that you should be able to look up what a GS13 makes. (Don’t know for sure if that’s Dr. Monnett’s pay grade, but he mentioned in one of those comic-opera interviews that Dr. Gleason was at that grade–before taking a 2-level cut just to escape BOEMRE.
Scott,
Plus increased solar heating would heat the stratosphere first, where ozone absorbs solar UV. Instead, the stratosphere is cooling while the troposphere warms–the smoking gun for CO2-induced global warming. (One of many smoking guns, actually.)
It should be remembered that the lower stratosphere has cooled more due to the loss of UV-absorbing ozone rather than an enhanced greenhouse effect. However, the upper stratosphere cools more due to the enhanced greenhouse effect.
Please see:
I don’t understand why people like Bastardi, Salby et al do it. What is in it for them?
Is it just the chance to strut around all self important for a bit? Or are they deluded into thinking that they really do understand better than others what is happening? Or are they fighting for a cause they believe in?
Historically, the behaviour of the Einstein deniers were very similar. His theory of special relativity offended them, and they set about proving him wrong. They even organised lecture tours against his theory. And it wasn’t just anti-Semitism.
John, I didn’t know that bit of science history about Einstein and the reception of special relativity. Can you recommend a good book to read on it? Thanks!
“Einstein, A Life” by Denis Brian, John Wiley & Sons, 1966 ISBN 0-471-11459-6
I imagine any good biography would do.
There is one particularly good quote by a Dr Arthur Lynch:
“As I cast my eyes over the whole course of science, I behold instances of false science, even more pretentious and popular than that of Einstein, gradually fading into ineptitude under the searchlight; and I have no doubt that there will be a new generation who will look with wonder and amazement, deeper than now accompany Einstein, at our galaxy of thinkers, men of science, popular critics, authoritive professors and witty dramatists, who have been happy to waive their commonsense in view of Einstein’s fallacies.”
Make that “Mr. Arthur (Alfred) Lynch”. MA, worked as a civil engineer but also a physician, and quite much involved in politics, writing and fighting (as in “warfare”).
Good Lord yes, counters. Nazi Germany considered relativity “Jewish science,” and Nobel-prize-winning physicist Philipp Lenard wrote an essay denouncing it as such. He was “Chief of Aryan Physics” for Hitler.
“This world is a strange madhouse. Currently, every coachman and every waiter is debating whether relativity theory is correct. Belief in this matter depends on political party affiliation.”
— Albert Einstein in a letter to Marcel Grossmann, 1920
Climate denial activists’ parallel to anti-relativity movement of 1920s
Yes it is amazing… I suppose that back in those days, one motive for denying relativity was anti-semitism. That makes for an interesting challenge for those that demand that scientists get better at ‘framing’ the AGW problem in ways that match people’s political-religious world view: how would you ‘sell’ relativity to an anti-semite? By pointing out that many of the basic formulas already were found by Lorentz, who wasn’t Jewish? Or, that already Maxwell had a relativistically invariant formulation of electrodynamics, and he wasn’t Jewish either? Or just point out that a Jewish patent clerk put it all together, and you can go f**k yourself if you have a problem with that? I know what my choice would be.
Gavin’s Pussycat,
Actually, your speculations on how to sell relativity to an anti-semite were pretty much on the money–the German physicists working on the Nazi nuclear program did all this and more. Pretty amazing period in history.
Ray do you have a reference? I could imagine this being relevant reading to, eh, Chris Mooney or Matt Nisbett :-)
GP, It was a long time ago, but I believe it was the Farmhall Transcripts. Here is something that makes reference to the process:
http://books.google.com/books?id=QuM9hfLqBZ8C&pg=PA269&lpg=PA269&dq=nazi's+and+relativity,+atomic+bomb+project&source=bl&ots=c1_8RFW9jm&sig=4BU3AOWfV_EAXB8SebdNWENQMD8&hl=en&ei=7jxNTuauMeiy0AHf4YTxBg&sa=X&oi=book_result&ct=result&resnum=4&ved=0CDEQ6AEwAw#v=onepage&q&f=false
For both the climate change deniers and the relativity deniers, the science is very unsettling because it conflicts with — and threatens to overturn — their “comfortable” and comforting world view.
In Bastardi’s case, it’s at least partly the money, but there is a ginormous ego at work also:
“Been posting relentlessly on how this season would turn ( cooler august, tropical impact ramp up) on weatherbell.com 50cents a day cheap eh?”
http://twitter.com/#!/BigJoeBastardi/status/103438609423679488
Apropos the Einstein digression:
http://bahumuth.bitfreedom.com/climate-denier-libertarian-award-named-relativity-denier
when i was checking carbon 13 numbers at http://gaw.kishou.go.jp/cgi-bin/wdcgg/download.cgi?index=MLO519N00-NOAA¶m=200612120907&select=inventory I noticed that it was listed as a negative number, any idea why this is?
thanks jacob l
[Response: The given values are “delta-carbon-13”. The “delta” values represent a difference between the concentration and a reference value. Specifically, the ratio of the number of carbon-13 atoms to the number of carbon-12 atoms is
where is a reference value (usually 0.0112372), and
  gives the deviation from that reference value. Since observed atmospheric CO2 is depleted in carbon-13 relative to the reference value, the
  values are negative.
Note also that the values in the data files are in units of “per mil”, or “per thousand.” Hence when the value is listed as -8, that really means -0.008.]
There are still STR deniers– some very clever people get obsessed with the oddities of STR and can’t seem to focus clearly enough on how the theory works to see how they fit together into a coherent account of space and time. Some basic intuitions/ reactions apparently can’t be corrected by careful thought, even in people who are capable of thinking quite well in other cases.
The real question: Is it gross incompetence, or gross duplicity?
Good question. I would give him the benefit of the doubt, if only I knew how to…
A rather special form on incompetence, I fear. See the details posted just below by others.
FYI, I’ve addressed the rest of Bastardi’s comments (here and on Fox News) in a post to be published tomorrow on Skeptical Science.
It goes to show the power of the Gish Gallop. In a 3 minute interview on Fox and one comment here, Bastardi managed to jam pack enough myths that it took me over 2,000 words to respond to them all. And most of his arguments here were repeats from Fox!
link:
http://www.skepticalscience.com/one-confusedi-bastardi.html
tamino thankyou for your reply
going to think about for awhile, have some questions on how delta 13 co2 compare with total co2
sincerely jacob l
Just to help [not] the Bastards [Italian plural for Bastardi], do there exist any approximations of how many cubic kilometers / miles of biomass has disappeared off earths surface since say, start of the 19th century. Talking long lived CO2 sequestering vegetation. Google produces this on a search v.v. forest: http://www.google.it/search?q=how+much+forest+was+lost+since+1800
Found this paper, only discussing the Eastern USA
http://www.aibs.org/bioscience-press-releases/resources/Drummond_Loveland.pdf but no real volumetric numbers.
Interested in the CO2 tonnage that went the Anthropogenic way into the atmosphere, desequestered on a permanent basis.
(Bastardi made me think of that British comedy series with the Alan B’stard character: http://www.youtube.com/watch?v=8aUxilWb2Og … promises [it aint true])
Back in the early 80s I used to enjoy reading the books of science fiction author James P. Hogan. By the end of that decade he seemed to be getting increasingly fascinated by conspiracy theories, and I stopped reading his books.
Hogan passed away recently, and on the occasion I looked a bit into some of his recent writings. It turns out he’d gotten into climate denialism, ozone denialism, evolution denialism, Velikovskian cosmology, and pretty much every other crank cause you can imagine, up to and including questioning “mainstream” accounts of the Nazi Holocaust.
I recently read his poorly written but imaginative and entertaining novel “Bug Park”. The protagonist is an engineer by training, but also an amateur Galileo, attending scientific conferences to give presentations that poke holes in Einsteinian relativity and other pillars of mainstream physics. There’s much grousing about how science has been corrupted by “consensus” and groupthink, and how close-minded scientists are incapable of questioning their received dogma.
It was an enlightening and disturbing glimpse into the kind of Dunning-Kruger afflicted mindset that characterizes so many of the “skeptics” we see in the climate science blogosphere.
Tamino,
Minor point. You consider effects of El Nino on temperatures; whereas Bastardi uses PDO/AMO as follows:
I know the PDO/AMO is not really an oscilation, that the data only go back a hundred years or so, and that there is little understood science behind these ocean temperature variations. Perhaps i have answered my own question, but is there a way for you to evaluate these claims?
It sounds like Bastardi would believe that diaper sales cause babies.
I also notice that Bastardi uses US tempteratures, and then labels it “Earth’s Temperature”. Classic denialist trick!
Of course, the main difference between Einstein’s STR deniers and AGW deniers is that back then there wasn’t a cartel of global corporations financing a global PR machine intent on disproving relativity effects that might dent a billion dollar a day plus profit stream by disseminating lies, slanders, falsehoods and encouraging persecution of scientists.
Concurrent with Dr. Monnetts inquisition (and the equally valuable attendant smear value prior to any outcome) Montford is also
musing – not researching, not investigating – just ‘pondering’, if lack of prosecutions for scientific fraud is “credible”. His near vaporous ‘reference’ to hang this dogwhistle on is Douglas Keenan, he of the disproved accusation against Phil Jones’ collaborator Wei-Chyung Wang.
And so the indiscriminate, non-Einsteinian sliming continues.
I must say that I do find the lack of prosecutions for scientific fraud incredible. Just how do Baliunas, Ball, Carter, de Freitas, Douglass, Easterbrook, Gray, Kininmouth, Plimer, Singer, Soon, and the rest get away with their blatant misrepresentations and false analyses?
Freedom of speech. People are allowed to say all sorts of nonsensical things, and should be (outside of libel/slander). It should have an affect on their employment if they’re an academic, but it isn’t the State’s business to intervene.
I’m not talking about opinions in blogs and newspapers. I’m talking about papers that get published in journals, just as Montford is (if not, just what is he talking about?)
I don’t think there is a special legal status for scientific journals–and I rather agree that it would be dangerous to institute the same.
The best sanction is looking like the back end of a large mammal to your peers–though clearly that is currently a less-than-perfect deterrent.
No, there isn’t, so what is Montford talking about when he refers to
?
Where would be any evidence for “research fraud” if not in published papers?
Indeed. I could get all snarky about Montford, but I really have no more basis for that than he apparently did for his comments.
If the oceans really controlled temperature, I would expect to see heat content varying inversely with surface temperature (over long periods) – but that isn’t the case, except for ENSO, when one looks at the tropical Pacific only; El Nino reduces basinwide heat content and La Nina increases it (there was a recent study that attributed a slowdown in ocean warming in the past decade to frequent El Ninos, but expected it to resume due to ENSO trends).
Also, for the PDO/AMO, I see them as regional patterns of variability which don’t have much effect globally (the PDO has been mostly negative in recent years, yet warming continues); cooling in one area is offset by warming elsewhere; for example, the PDO causes cooling along the west coast of North America but warming in the central and western North Pacific (I have also heard that the PDO itself is just due to ENSO variability and isn’t a real climate pattern).
More Bastardi-zation; Big Joe yesterday:
“The most amazing thing.. 5 days ago, anyone besides Wxbell talking about cooling into Texas? DFW stopped short 100 3 days ago only 80s ydy”
http://twitter.com/#!/BigJoeBastardi/status/102764724382482433
Today, Dallas is back over 100, and Waco ties the annual record for 100 degree days with 105, but not a mention in his dozen or so twitches today.
As everybody knows, one day of cooler weather means that it will never get hot again. :)
Bastardi is right. The Dallas temperature data show a cooling trend, probably related to the lack of sunspots, GCRs, the PDO, and the AMO:
Aug 9: 107 F
Aug 10: 104
Aug 11: 97
Aug 13: 89
With my advanced statistical powers, I’ve used sophisticated linear regression modeling to determine that these data show a cooling trend of 4.66 degrees F per day. Extrapolating forward, this gives a daily high temperature of only 28 F — well below freezing — by August 26th.
Clearly, Dallas-Fort Worth is in imminent danger of being buried under a new continental ice sheet. We must burn more fossil fuels ASAP!
Good work, Ned. A most excellent example of BS (Blog Science)! Probably worthy of a PhD (Piled higher and deeper). :)
The latest from BJ:
“Global temps next 8 days have dropped to normal.. cooling from peak already starting”
followed by:
“I am forecasting drop to -.2 to -.3 C for Jan-mar. keep track here”
B Buckner | August 15, 2011 at 3:18 pm & Michael Stefan | August 15, 2011 at 8:07 pm — The AMO, properly done [revised or new AMO] is basically a nothing internal variability. Tamino pointed this out on a earlier thread here; after much kicking & screaming I’ve finally managed to see the light; its a nearly nothing.
On the other hand, the PDO is a way of viewing an actual climate pseudo-periodic phenomenon; whether deep water upwells off the Pacific Northwest coast or the coast of western Alaska. Whichever has the upwelling finds excellent fishing; the other place the reverse. The quasi-period for some time (tree ring proxy) was around 40 years. Recently it has been more like 16 or so.
However, it is possible to devise a 2 box climate non-model, similar to the one(s) Tamino has used, to see if the PDO [as usually measured] has an effect upon climate. The answer is almost none. Using a standard method of determining which model is better strongly suggests leaving it out [as the additional parameter does not contribute enough to the predictablity of the global temperature].
AMO is Ammo
— by Horatio Algeranon
AMO is ammo
For those who wear camo
To hide global warming
Which is quite alarming.
They sit in the blind
And shoot from behind.
Then gather their game
And return whence they came.
Like old Elmer FUD,
Their talk’s clear as mud.
But they sure don’t worry
‘Cuz truth’s not their quarry
Can Bastardi learn? Apparently not. This morning’s postings:
In regards to attacks on me cause of my co2 explanation on Fox..The Point: It has no provable affect on the earths energy budget
5 hours ago via web
Attack all you want, the reason for the “missing heat” while co2 rises is that it does not help “trap” heat ( energy).
5 hours ago via web
He really is digging in his heels. It would almost be sad if he weren’t so obnoxious about his willful ignorance. He’s positioned himself such that any retreat would be an admission his accusations of fraud and conspiracy were a lot of hot air. I think he’s in this for the long haul. If he had refrained from the emotional posturing and slanderous attacks on actual scientists, and simply presented his reasons why he disagreed with the overwhelming scientific consensus, he might have had an honorable out and said, “You know, I was wrong”. But he’s made it all personal and he’s been vindictive. That’s a reflection of more than just knowledge or intelligence; it’s a sign of character. The longer he keeps it up, the harder it is to make it right.
When you abandon logic, ad hominem is often the fallacy of choice.
But the more he will discredit himself. I should check his stuff for “When Did Global Warming Stop” printbits.
In other words, Bastardi doubles down on stupid.
Yeah, that’s a winning strategy, alright.
For those to dare to attempt to help J.B. see the light, recommend
(1) Why does climate change? Causes and Timescales
August 14, 2011 at 5:51 pm by Chris Colose
http://blog.timesunion.com/weather/why-does-climate-change-causes-and-timescales/1261/
(2) “The Discovery of Global Warming” by Spencer Weart:
http://www.aip.org/history/climate/index.html
(3) Ray Pierrehumbert’s “Principles of Planetary Climate”
http://geosci.uchicago.edu/~rtp1/PrinciplesPlanetaryClimate/index.html
This suberb book requires serious study; I’ve read it once and now I’m carefully studying it.
I think he picks this stuff off of the tin foil hat websites. I have seen some of my fellow TV Mets. say much the same thing, and I’m talking about those who have at least an undergrad degree in atmos. physics.
Throwing a bone to anti-science crowd can be quite lucrative, not that I am making an accusation here, just trying to fathom the delusion of someone who has the background to know better!
Exc. debunking Tamino and written so that the average guy can “get it”.
Dan Satterfield | August 18, 2011 at 9:02 pm — Atomospheric physics? Maybe meteorology is what you mean?
Thank you for this. as an “average guy”, I assure you, it was, in fact, written so that I could understand.
Hey, remember Tamino’s post back in May in response to the guy who was so impressed that Bastardi was ballsy enough to make his prediction six months before? When the guy taunted Tamino about not being courageous enough to make such an early prediction, and Tamino pointed out that he had actually made a prediction a month before Bastardi?
I wonder how those two predictions are holding up with ~1 month to go in the melt season….hmmmm let’s take a look…
Tamino: (yes I know you’ve revised your estimate since then, but I’m looking at the original here) 4.63 +/- .9 million km2.
Joe B: 5.5 million km2
Current IJIS 2-day average extent: 5.41 million km2
One month of melt to go…whose forecasting method seems to be doing a better job–the “professional” forecaster, or the statistician?
The chart here (http://nsidc.org/arcticseaicenews/) shows the melt approaching 2007.– again — after slowing in late July to early August. Through most of the summer, this year’s melt has exceeded 2007’s. Regardless, it’s currently out in 4 sigma land. (approximately 1 year in 770) and since melt hasn’t been inside of 3 sigma in some time, it definitely signals a new baseline has been reached.
Another chart (http://nsidc.org/images/arcticseaicenews/20110816_Figure5.png) shows ice volume — an eyeball examination shows volume out 3 sigma from the mean and much less than in the previous record year of 2007.
With so much at risk, there really aren’t words to describe how vile the deniers and obscurers are.
Hah, but Bastardi has set up a such a wide error bar, that he’ll still claim skill and accuracy even if he’s 1km square within, AND handwave vehemently when little outside… just luck, all natural variation, no statistical proof, nobody projected that earthquake in March, all in the 8th decimal of that 61.32458666 year climatic cycle, or was it 35.73251666 years newly discovered oscillation ;o)
Bastardi’s .9million km2 error bars are comic. 4 standard deviations! It’s like confidently predicting the batting champ will hit 325 with error bars of +/- 100 pts. Take a victory lap, Bastardi. You da man.
I don’t know if Bastardi has used 0.9 million km^2 error bars but Tamino certainly did last October when predicting this year’s lowest extent. He said “4.63 +/- 0.9 million km^2”.
Kevin,
Tamino’s updated September Ice Extent prediction is here:
Incidentally, here is Bastardi’s original claim:
He basically admits he’s pulling numbers out the Wazoo (‘If I had to put a number on it….”). No error bars are included that I saw, and no explanations on the 5.5 million KM2 estimate.
No error bars, not even 0.9M, Jeff mentions? Not the Wazoo, The Grand Wazoo, (a musical experience for Frank Zappa connoisseurs, ca 1972, when GSFC started recording sea ice extent and stopped round about when the IJIS/IARC/JAXA system started recording in 2002)
@Kevin – With a month to go, it’s clearly favoring Tamino since it has already passed up Joe’s, but then again, who is surprised by that?
“but then again, who is surprised by that?”
Bastardi? Nah, probably not even him, although I doubt he’d admit that in public.
on the other hand, I’d sure like to know the reaction of the guy who was praising Bastardi and mocking Tamino. But I’m sure he’d have a ready list of reasons why it’s no big deal.
“Not Knowing sure beats No-ing”
— by Horatio Algeranon
He doesn’ t want to know
‘Cuz knowing makes it so
That he must then deny
What he knows he will not buy
Somewhere, I asked if some of the deniers would actually tell Joe he was full of it. I specifically mentioned Christy, Watts and Spencer. I haven’t heard if they have said anything, but Curry and Muller both have said Joe is wrong. If Watts actually comes out and claims Joe is wrong, please make a post about that, Tamino. thx.
FWIW, BJ seems to be using a different measure, so he sez now; don’t know what it was originally:
“Same for ice. I said it would be a 5.5 mil sq km at lowest this year. Currently at 6.1” [Aug. 14]
http://twitter.com/#!/BigJoeBastardi/status/102767792708792320
He also likes to conflate now (for large values of “now”) with the annual minimum:
“Another chart showing where we are, still well above 2007” [Aug. 16]
http://twitter.com/#!/BigJoeBastardi/status/103538039724314625
(BTW, tweets are remarkably hard to Google, even if you remember reading them originally–just sayin’.)
According to the link to WUWT above, he was using JAXA, which is down to about 5.4m km^2 already, not 6.1m km^2. Lord knows where he’s getting his numbers from.
It’s clear that Joe uses whatever data support his ideas most. He says he only trusts the satellite-based global temperature record, but he won’t mind showing the HadCRUT record if it has the lowest short-term warming trend. I don’t know the differences between the different sea ice products, but it’s clear that Joe will link to that IMS sea ice data if it has the highest sea ice extent. He also will point to whatever Arctic sea ice product that shows the biggest discrepancy between this year and 2007 like NORSEX SSM/I sea ice extent. And as we have seen, he will interchange global and U.S. temperature records if doing so will strengthen his point of view in his mind.
@Sekerob | August 19, 2011 at 6:19 pm |
Looking through the Bastardi WUWT post and the comments the closest thing I could find describing error estimates was this from a Bastardi comment:
“The ice is coming back, will do so in forward and back steps, with forward defeating the back steps. I am on record as saying we will be back to 1977 levels by 2030. The real problem would be is if there is no corresponding drop in the southern hemisphere sea ice. Like the 70s, cries of ice age will start again. So my forecast for next years melt is for 5.5.”
I don’t know Sekerob maybe Jeff could tell you where found the error bar. I couldn’t find it in the WUWT post or thread but maybe I missed it. After stumbling across that quote above I called it quits so maybe its in there somewhere.
Kevin McKinney | August 19, 2011 at 9:51 pm — GS-13 earns at least US$83472 in Alaska.
Not surprised. Certainly less than many comparable private sector jobs.
If Tamino would like to shoot some more fish in a barrel:
Watts’ plot has got to be one of the messiest, least informative pieces of gobbledygook I’ve seen passed off as scientific analysis. Overlaying arrows with arrows with captions is a joke.
Girma at WUWT:
“Anthropogenic global warming advocates always accuse skeptics of cherry picking. A working definition of a cherry picker is one who makes conclusions based on comparison of oranges to apples. Let us see who is the greatest cherry picker.”
I think Girma is a few grapes short of a fruit salad.
“I think Girma is a few grapes short of a fruit salad.”
On the contrary, his salad bowl is overflowing with fruity arguments.
Robert Murphy | August 20, 2011 at 4:50 pm — Her.
Her? I don’t think so.
(I have a long-term bet with Girma. It has 2 parts, one that ends in 2020, the second in 2030.)
Girma is a he!
TrueSceptic | August 21, 2011 at 12:36 am — Him.
Fooled me.
It’s not a name I’ve seen elsewhere. Girma Orssengo is an Ethiopian who moved to Australia some years ago.
Greetings TrueSceptic
I am confident I will win our bet.
The record GMT of the 1998 is not going to be repeated in a long time:
http://bit.ly/omzALZ
Regards
todd:
How confident are you that your model worked in 1800 and earlier?
todd,
I didn’t realise you were Girma (BTW is that pronounced with a hard or soft G?).
You really think so? We’ve got 9 years for Part 1 and then another 10 for Part 2. ;)
TrueSceptic
With the hard G.
Cannot wait to see the GMT values for the next 5 years. I expect a big drop.
Takecare TrueSceptic
Hmm, well GMT temperature for 1998 has already been exceeded but I am guessing you must have bet on LTT off satellite instead. In that case I would say you are betting on there not being an El Nino greater than around 1.9-2.0 in the next 9 years. Good luck on that. Does this bet use an escrow?
Phil
Here is the data
http://bit.ly/pJF8GB
The 1998 record was 0.53 deg C and it was 0.47 deg C for 2010, after 12 years. As we go further from the previous peak, it is unlikely the previous peak will be matched as shown in the following history of global mean temperatures.
http://bit.ly/omzALZ
Why on earth would you say “unlikely”? Statistics aren’t the phenomenon. Your position would posit that in August of 1945 the residents of Nagasaki were pretty safe. After all, look at how many people had already died in the war!
Since Girma’s Woodfortrees graph uses HADCRU, I’m guessing that’s the reference for the bet. And in HADCRU still has 1998 as #1, so Girma hasn’t lost. . . yet.
I am unlikely to lose.
Do you see what happened to the global mean temperature (GMT) after the 1880s and 1940s peak in the following graph?
http://bit.ly/omzALZ
That will happen to the current peak as well.
We must trust what the 160 years of data tells us.
Why does not the GMT touches but not cross for long the upper GMT boundary line (the blue line)?
Todd/Girma and TrueSceptic,
Please link/explain the detail of this bet (except the stakes).
I want to estimate the odds.
Also, Girma/Todd, I think you have way too much confidence that your upper bound line has any physical meaning whatsoever.
Some people (mostly deniers) are into “mathturbation”. Girma is into “graphturbation”.
One never knows.
But there’s this stock market saying that applies: “Past returns are not a guarantee of future performance.”
In the case of physical systems, ignoring known physical forcings doesn’t seem to me like a good recipe for long-term success. There’s a big difference between a statistical projection forward (say) three months and one forward nineteen years.
Me, I’d have to wonder about the probability of both parties being around, in touch and ready to pay in nineteen years.
“We must trust what the 160 years of data tells us.”
Instead of trusting in mathturbation and climastrology, where curves are fitted without regard to physical causes, how about instead we trust what the physics says? Climate changes long term because of the totality of forcings, not because of imaginary cycles.
For what it’s worth I ran a little monte carlo simulation based on the assumption that the earth’s temperature is a function of ENSO, volcanic activity, sunspots and GHG forcing.
I am assuming a linear growth in GHG forcing, normal sunspot cycles, continued minor volcanic eruptions, and a random selection of historic ENSO patterns.
My estimate for maximum end of year HadCRU3v global mean temperature over the period 2010-2020 is 0.67 +/- 0.035 (95% range). Which means 0.53 is about 8 standard deviations below the mean.
In fact, by 2020 you can expect even strong la nina years to break 1998 for HadCRUv3, which (remember) doesn’t include the poles.
So, assuming the 2020 bet hinges on whether or not HadCRUv3 has at least one end of calendar year GMT greater than 0.53 by 2020 (and including 2020) then I peg the odds of Todd/Girma winning his bet at approximately 1 in 1,000,000,000,000,000 (give or take a few orders of magnitude).
OK, I still can’t stop playing with this little toy I’ve made.
If we assume that a Pinatubo + 50% scale eruption (significantly larger than Krakatoa) will happen in late 2017, then the expected maximum end-of-year HadCRUv3 maximum temperate over 2011-2020 is 0.605 +/- 0.051 (95% confidence range). Todd/Grima’s chances of winning have now increased to 1 in 750.
What this means is that even if there is a strong la nina year in 2016, a Krakatoa+-scale eruption in late 2017 (during an el nino), and another la nina in 2019/20 then there is still about an 80% chance that we will see at least one year warmer than 1998.
To answer several questions:-
I suggested HADCRUT because it seemed the most favourable to the “other side” and in any case 1998 had already been exceeded in GISTEMP.
No escrow: this depends on trust and if either cheats on the bet this will be pointed out in blogs like this one.
The bet
Reply
Follow-up
Reply
Ernst K
Assume you are given the following data:
http://bit.ly/ro1G9A
Assume you don’t know the GMT after 1940.
Could you please predict the GMT for 1950s?
Is the method you are using now valid for this problem?
Why?
Girma
Assume you are given the following data:
http://bit.ly/ro1G9A
Assume you don’t know the GMT before 1850.
Could you please hindcast the GMT for the 1700s?
Is the method you are using now valid for this problem?
Why?
Well, Girma, if I had a modern climate model back in the 1940s, and forcing data for the 40s and 50s, I think I would be able to do quite a good job of prediction.
But wait…. that’s something we can actually test, isn’t it? Climate models have already been tested in this manner (although not in this exact scenario), and they do very nicely indeed, thank you.
And if you were trying to cherry-pick the point where models do worst, you really should have set your dates a decade earlier. And, of course, that particular anomaly is reduced now we are correcting sea surface temperatures during the period.
Girma,
I would never try to forecast future temperatures based solely on a time series analysis of past temperatures alone. I would want to include data on things that determine temperature, like CO2, solar radiation, etc.
The model I used was based on the Multi-variate El-nino Index which only goes back to 1950. But I have another, slightly more complicated, variant that uses the Southern Oscillation index which goes back to the 1800s. It was calibrated over the period 1960-2000 and reproduces the 1880-1950 variation pretty well.
My own analysis concludes that you’re going to lose this bet big time unless we’re “lucky” enough to get hit by multiple major volcanic eruptions. If I’m wrong about that, I’ll have to re-evaluate everything I know about the atmospheric sciences.
Problem is: Bastardi knows it all – and we are still too polite, or timid? to call him what he is re AGW: a liar.
G: Cannot wait to see the GMT values for the next 5 years. I expect a big drop.
BPL: I expect you have no idea what you’re talking about. But I’m saving your post so I can wave it in your face in 2016.
BJ doesn’t have an agenda:
“Is economic “graceful decline” the true agenda of some warmists? http://t.co/6UZeEZ8 /via @wordpressdotcom I believe this is the true agenda”
[Warning: link is to WTFUWT]
BJ = JB ?
He calls himself “Big Joe”; it’s also his regular initials backwards, which is appropriate to his “science”, and of course, there’s that other meaning.
Thanks–I think. . .
Will Hadcrut3v exist, with its current coverage area, throughout the duration of the bet? If not, what happens? If HADCRUT products start covering the arctic before the end of the bet, Todd’s odds go from infinitesimal to a tiny fraction of that. As Foghorn Leghorn might say, “as small as the pointy end of nothing, sharpened.” (Foghorn Leghorn is a cartoon rooster popular in the US when I was a child, for those unfamiliar)
I was (am!) a Foghorn fan. We got all those cartoons in the UK too. :)
I’m sure we’ll keep track of any changes to HADCRUT. If it’s changed too much, we’ll probably call it off (although no such stipulation has been made and I would consider the bet to remain valid).
Todd/Girma…now that I think about the polar coverage issue, it makes me curious…doesn’t it present a problem for your rationale, that if one includes the poles, your rule (about peaks not being exceeded for long periods of time after they occur) has already been broken? Or are you really saying that you believe mainstream climate science is wrong regarding the coverage area of HADCRUT, but right for the globe as a whole?
Chris, Ernst K
If there is further warming of 0.2 deg C per decade in the next two decades, your side wins.
If there is slight cooling in the next two decades, the skeptics sides wins.
As shown in the following graph, further warming would mean, for the first times in 160 years, the GMT exceeds the upper boundary line. That is almost impossible. The skeptics must win.
http://bit.ly/omzALZ
Chris, I cannot say anything about the temperature in the 1700s because the data started from 1850.
Why is it that you can say something about temperature beyond one end of the data but not beyond the other?
Presumably, by “slight cooling” you mean at least “0.2 deg C per decade”?
[Response: Perhaps we should emphasize what Girma (and others) refuse to acknowledge: that if there is further warming of 0.2 deg C per decade (or thereabouts) in the next two decades, then EVERYBODY LOSES. Big-time.]
Girma,
Out of curiosity, according to your theory, should it also be “almost impossible” for the temperature to drop below the lower bound?
Do you think we’re doomed to reach +6 deg C by the year 3000?
Ernst K
Here is the last 130 years global mean temperature data:
http://bit.ly/njBdvW
In the above graph, although the upper GMT boundary curve is a straight line for the relatively short 130 years data, in a longer time scale, it is part of a very long curve that contains the Little Ice Age, Medieval Climatic Optimum, Holocene Maximum, etc.
A shift in climate is indicated when the slope of the upper & lower GMT boundary line changes. Climate change is also indicated when the magnitude of the swing between the two boundary lines changes. In the last 130 years, according to my interpretation of the data, no climate change has occurred.
Girma,
I cannot understand why you are unable to apply the same method you use to create your forecast for the future, to reconstruct the temperature trend before 1850. You have said that “We must trust what the 160 years of data tells us.” If all the information about the behavior of the system is contained in those 160 years of temperature vs. time data, and that same information is all you need to forecast the future trend according to your methods, then that same information must be sufficient to “backcast” the temperatures before 1850. If the up/down cycles you mention for the 1880s and 1940s repeat moving forward, they must repeat moving backwards unless you have any solid reason why this wouldn’t be the case. The overall linear trend in the data must also be assumed to be valid moving back as well as forward based on your methods (the trend is undeniable in the 160 years of data), unless you have a solid reason to justify a change in the trend in either direction. This means that before ~1500 years ago the earth was pretty frigid (~25degC colder than today), which we know wasn’t. But any reason you give us to justify assuming that the linear trend or the up/down cycles are not valid before the start of the time series, must be based on information that is NOT contained in the 160 years of temp. vs time data. This immediately means that there must also be other information outside of the temp. vs time data that can tell us about how the temperature will behave moving forward, and how it behaved before 1850. Scientists know what that information is: the laws of physics, plus CO2 concentration in the atmosphere (atmpspheric composition, in general), solar irradiance, changes in earth’s orbit, volcanic eruptions, albedo changes, etc. Maybe the earth wasn’t frigid 1500 years ago because the linear trend visible in the 160 years of temp. vs time data wasn’t there before 1850? What could have changed since 1850 that made that trend appear? The sun hasn’t changed, the orbit hasn’t changed, the rate of volcanic eruptions hasn’t changed . . . But wait . . . humanity has been dumping massive amounts of CO2 into the atmosphere starting with the industrial revolution, a gas that since the late 1800s is known to absorb certain wavelengths of infrared radiation. Or maybe it’s all little fairies creating magical cycles and trends in the temperature that sometimes stay the same moving forward, but maybe not moving backwards.
If you cannot do backcasting with your methodology, then the conclusion is clear that all your forward estimates based on that methodology are bogus. Understanding climate science is much, much more than an exercise in curve-fitting. You have to understand physics to predict how things behave.
Rafael.
Give Wormtongue a break. His climastrology is based on drawing lines through constellations of points, and not on anything that pertains to, you know, actual physics.
You’re asking far too much of the guy by suggesting that he do real science.
I’m still staggered that a university that values its reputation actually gave him a doctorate…
Rafael
I am only interpreting the following data.
http://bit.ly/njBdvW
The above data shows a persistent warming of 0.06 deg C per decade with a cyclic cooling and warming of 0.5 deg C every 30 years. This result gives a cyclic 30-year global cooling of 0.32 deg C (= 0.5 – 0.06 deg/decade x 3 decade) and a cyclic 30-year global warming of 0.68 deg C (= 0.5 + 0.06 deg/decade x 3 decade).
As this result has been valid for the last 130 years, it is reasonable to assume it will also be valid for the next 20 years.
I am not going beyond 20 years before and after both ends.
The GMT for the 2000s peak is about 0.45 deg C.
As a result, the predicted GMT for the 2030s is about 0.13 deg C (= 0.45-0.32).
The predicted GMT by the IPCC for the 2030s is about 1 deg C.
http://bit.ly/n1S1Jf
Let us see which prediction is realized.
I don’t need to know why the sun rises in the east (i.e: the physics of the phenomenon), but everyday since I was born it rises in the east. It is therefore reasonable to assume it will continue to do so for the next 20 years.
Rafael, do you stand by the IPCC’s prediction for GMT of 1 deg C by 2030?
Grima/Todd,
We understand that you are interpreting the data to follow a formula of the form:
T = a + b*(t-1880) + c*sin(d*t+e) + residual noise
What we don’t understand is why temperature should be restricted to this form, and not something like:
T= a + b*(t-1880)^2 + c*sin(d*t+e) + residual noise
I can guarantee you three things:
1) the 2nd equation will fit the historical data better than the 1st equation
2) the 2nd equation is just as physically valid as the 1st equation
3) the 2nd equation will lead to a very different conclusion about future global temperatures
So my question is why limit your analysis to the first equation?
Ernst K
“So my question is why limit your analysis to the first equation?”
Let us compare the two models regarding the peak and valley values.
I do for my model (30 years global cooling by 0.32 deg C followed by 30 years global warming by 0.68 deg C) and you do for yours.
The 1880s GMT peak => -0.27 deg C
The 1910s valley => -0.27 – 0.32 = -0.59
The 1940s peak => -0.59 + 0.68 = 0.09
The 1970s valley => 0.09 – 0.32 = -0.23
The 2000s valley => -0.23 + 0.68 = +0.45
Here is how the above estimation compares with observation:
http://bit.ly/njBdvW
That is an excellent approximation of the observed values. (Note that is much simpler to predict the peak and valley values than the intermediate values)
Ernst, if there is IPCC’s 0.2 deg C warming in the next two decades, I will accept AGW.
Will you reject AGW if in the next two decades the GMT drops to 0.13 deg C (=0.45-0.32)?
“Will you reject AGW if in the next two decades the GMT drops to 0.13 deg C (=0.45-0.32)?”
I assume we are talking about year end annual averages from HadCRUT3v, and that this “valley” has to happen in the 2030s?
Let me put it this way:
If the model I used to make this prediction:
“My estimate for maximum end of year HadCRU3v global mean temperature over the period 2010-2020 is 0.67 +/- 0.035 (95% range).”
has 3 or more years that fall more than 3 standard deviations below its estimate, before 2040, then I will admit that I don’t understand atmospheric science well enough to have a serious opinion.
Assuming there aren’t any colossal eruptions or a major Geo-engineering program underway, it’s pretty safe to say that if your 0.13 prediction comes true then my model will fail the above test.
Girma, there’s no physics in your projection, just mathturbation. It’s therefore worthless, except for cheap thrills. It’s literally no better than reading tea leaves.
Once upon a time there was a girl who developed a model to predict horse racing. She factored in all available historical data–horse types, genetics, previous races, conditions, cohort patterns, even sickness patterns. She tested the model and found she could predict the next ten races, 1, 2, 3. She laid test bets. She won all ten. She tested again. She won all ten again. On the next ten races, she then put all her money and a large sum borrowed from Joe down at the Money Shack. She lost six of ten and suffered two broken legs. Because she was confident of her predictive abilities, she eschewed insurance. She died homeless in poverty.
What happened? The favorite in two of the races was shot in the front legs. The disruption caused the dynamics of three other races to change. The sixth race was an inexplicable loss. Joe was later tried for the shooting, but his lawyer convinced the jury of his innocence (if not the prosecution).
Moral? Well, let’s have another story–a shorter one. Bob’s hen laid either eight or ten eggs every week for five years. One day, Bob cut the head off this hen, bled her, and cooked her in a nice sherry-rosemary-butter-mushroom sauce. Bob was shocked to find that the hen produced zero eggs the next week. He put a zero on his egg chart, and he wondered if next week’s total would indicate a shifting trend.
Changes in the physical basis of the model should be reflected in model output. Girma, would your model output change if I were to somehow double global water vapor? Something tells me “no.”
Bastardi says: “When one pushes an empty cart and then stops pushing, the cart keeps moving until the work done on it is dissipated.”
Tamino says: “Objects in motion have an inherent tendency to keep moving.”
Who is right? From my perspective, it depends on whether you are a pragmatic weatherman living on the planet Earth – where friction is ubiquitous, a theorist whose mind is in outer space – where there is no friction, or a teacher of basic physics who hasn’t gotten to friction. Here on the earth, when one pushes an empty cart (work = force times distance), the cart keeps moving until the work done on it (which now might be called kinetic energy) is dissipated (as heat).
Now Tamino says: “[The cart analogy] does not apply to global temperature. There is no such thing as an inherent tendency to “keep warming” or “keep cooling.” If there were, then that would violate the first law of thermodynamics.”
Again, the correct answer depends on what type of world or system one is trying to describe.
[Response: No it doesn’t, An “inherent tendency to keep warming or keep cooling” violates the first law of thermodynamics. Period. No amount of hand-waving, clever arguments, or sham “it depends” will change that. You need to take the advice of your own pseudonym and “get real.”]
Some believe that the earth is warming because increasing CO2 has created a imbalance between the earth’s incoming and outgoing radiative energy. As long as that imbalance persists, the earth should continue to warm. That imbalance will persist until the earth has warmed enough to bring incoming and outgoing radiation into balance. Even if CO2 stopped rising today, many climate scientists believe the Earth faces several decades of “committed warming” totally about 0.5 degC. From this perspective, Bastardi’s question makes perfect sense:
“How is it, that the earth’s temperature has leveled off, if co2 continues to rise and it is supposed to be what is causing the rise..”
[Response: I already answered that question in this post. The part of the answer you should pay most attention to is: it has not leveled off. No amount of hand-waving, clever arguments, or sham “it depends” will change that. You need to take the advice of your own pseudonym and “get real.”]
DSL
“Girma, would your model output change if I were to somehow double global water vapor? Something tells me “no.””
God does not play dice.
The earth is extremely resilient beyond your imagination. It has a governor a thermostat that we have YET to understand.
” It has a governor a thermostat that we have YET to understand.”
Except you, of course. Obviously, you understand it.
You can’t explain it, but you understand it. It hasn’t worked in the past — after all, things have warmed outrageously in past geological eras — but it’s there now. Just in time to keep the carbon extraction industries insanely profitable.
For awhile, anyway.
That’s hilarious …
It’s pretty much akin to saying the earth’s 6,000 years old and there’s some mechanism out there that makes the earth appear to be much older that we have YET to understand.
What do you mean by “resilient”? You mean it’s going to bounce back to what it was like 4.5 billion years ago? Two billion? 4500?
I understand that there are a number of integrated systems that respond in various ways when the values of components are changed. Your model does not have a physical basis–or at least not one that you can express. It is much less robust than even the fairly simple model that Ernst proposes. Perhaps you should say, “It has a governor a thermostat that I have YET to understand.” I mean, you could at least try to incorporate some of these changing atmospheric components. Or are you one of these Gaia folk who don’t believe that it is possible for humans to render the planet lifeless? I’m not saying that our changes to the climate will do this; I’m saying that if we wanted to do it, we could, given current technology and knowledge. Nothing–no God, no Gaia, no extra-natural force–would stop us. And there’s nothing extra-natural to stop CO2 from doing its thing.
Girma,
God does not play dice.
Do you know who said that and why? What relevance does it have to DSL’a question anyway?
I believe the earth is extremely resilient, as this is the requirement for life to exist continuously for billions of years.
So, you use a well known quote but have no idea what it meant?
Actually Earth does have a good thermostat that evidently doesn’t work on Mars or Venus. Silicate Weathering regulates CO2 (as a negative feedback to temperature) on tends of thousands to millions of year timescales. It was first proposed in 1981.
Click to access Walker+1981.pdf
Very cool reference, Chris. Thank you!
Tamino: Do you really think that your readers are ignorant enough to believe that your “artificial” 1976-2007 “not temperature” data was really created by taking a trend of +0.018 degC/yr and adding Gaussian noise with a standard deviation of 0.1 degC? I created 1000 sets of data with this trend and noise and calculated the least-squares linear trend for the last ten years in each data set. The standard deviation for the slope was 0.0108 degC/yr. The 95% confidence interval for slope for the last 10 years was -0.0032 to 0.0392 degC/yr. The slope for the “artificial” data you supposedly obtained by chance was -0.007 degC/yr, giving a z-score of -2.3 and a 1% probability of being due to chance.
[edit]
[Response: Since you got pwned for being wrong — every bit as wrong as Joe Bastardi — I guess you just had to strike back any way you could. But you’re embarrassingly bad at it.
The artificial data were explained fully here. It’s the same data. You failed to understand what was done, but instead of asking politely you choose to call me a liar. That makes you both an idiot and an ass.]
LGR,
Some of us might not be as knowledgeable as others but to call any of us “ignorant” tells us that you really don’t understand irony, do you?
In addition, it seems that you are not only dishonest but shameless about it too. Nice.
The comments on this thread has become increasing bizarre and tiresome.
Girma,
your latest comments make it patently clear that your are a complete ignoramus. As I said before, your understanding of the world it’s all little fairies creating magical cycles and trends in the temperature, and now we can add one really big and wise fairy, the mother of all fairies, responsible for the fabled “Governor Thermostat”. By the way, does the big fairy always tell the little ones what to do? Or are the little ones free to be very creative and playful with their wiggles? Or, perhaps, the inner workings of the Great Governor Thermostat Fairy Circle are so mysterious that we don’t really know these details? Please enlighten us, if you have any more information about these wonderful beings and their relation to the 160-year temperature data set that you know so well.
Rafael, TrueSceptic, dhogaza, Jeffrey, Ernst K
I believe what I see.
I accept the data.
The data shows an invisible upper boundary wall for the global mean temperature (GMT) that it hits and bounces back about every 60 years as shown in the following graph:
http://bit.ly/omzALZ
We have early evidence for the GMT bouncing back from its current peak as shown in the following graph:
http://bit.ly/n7uB0b
What is the cause of this upper limit, this GMT wall, this governor, this thermostat?
I acknowledge this invisible wall, you don’t!
WHY NOT?
“I acknowledge this invisible wall, you don’t!”
I stopped believing in mythical invisible stuff the day I found out the Tooth Fairy and Santa Claus both weren’t real (it was a bad day).
You missed your calling, Girma. You have a talent for fiction.
Ok, not really.
“I accept the data.”
You abuse the data. You force curve fit it unphysical, mythical cycles.
“The data shows an invisible upper boundary wall for the global mean temperature (GMT) that it hits and bounces back about every 60 years as shown in the following graph:”
Only a statistical illiterate would claim a 60 year cycle on such a small number of years. You speak of temperatures as if they go up or down magically.
“We have early evidence for the GMT bouncing back from its current peak as shown in the following graph”
We have evidence that two years were already warmer than ’98. I notice you ignore that data. We have evidence that the last ten years were easily the warmest on record. We have evidence that the warming of the earth has not stopped.
“What is the cause of this upper limit, this GMT wall, this governor, this thermostat?”
The willingness of the people to see cycles and patterns were none exist. There *is no* wall, or governor, or thermostat that keeps temps within a certain bound (at least within the bounds we are talking about here). You are deluding yourself if you think you can explain or predict temperature changes with no regard for the physical forcings at play.
“I acknowledge this invisible wall, you don’t!
WHY NOT?”
The same reason I stopped believing in Santa Claus when I was a kid, or that I reject claims that lack any physical basis and misuse statistics in a mathturbational frenzy. It’ll make you go blind, scientifically speaking.
Girma,
we don’t accept your “invisible wall” because you haven’t proposed a single plausible physical mechanism that could account for such a thing. We are talking about the real world here, governed by the laws of physics. At the risk of repeating myself too much: Science is much, much more than curve fitting.
By the way, why is there a clear upward trend in the data, and why is your supposed wall moving up along with that trend? Your Fairy Governor Thermostat should not allow the temperature to drift upwards like that for 160 years, and much less a “wall” which any fairy knows is a pretty unmovable object.
And you still haven’t given me an explanation of why you cannot use your data analysis methods to reconstruct the temperature trend before 1850. I already proposed that if your methods are valid, and your “invisible wall” is a meaningful concept, you must be able to backcast as well as forecast. You keep saying that we just need to look at the time series data and believe in it. So look really hard and believe with all your soul, and tell me what happened before 1850. I’ll be waiting patiently while you do the looking and the believing. If you can’t do this backcasting, tell us why.
I’ll stop here with this topic because you are not going anywhere with it, and some in the classroom are getting bored.
Rafael
“Your Fairy Governor Thermostat should not allow the temperature to drift upwards like that for 160 years, and much less a “wall” which any fairy knows is a pretty unmovable object.”
The wall is inclined at 0.06 deg C per decade, not the IPCC’s 0.2 deg C per decade!
Rafael
“And you still haven’t given me an explanation of why you cannot use your data analysis methods to reconstruct the temperature trend before 1850.”
In an interview by Roger Harrabin of the BBC, Professor Phil Jones stated: “Temperature data for the period 1860-1880 are more uncertain, because of sparser coverage”.
http://bbc.in/qXQ3Tp
As a result, the GMT data before 1880 cannot be used for verification.
Girma,
I never mentioned the IPCC, so the drift I’m talking about is precisely that 0.06degC/decade you mention. Why is your “thermostat” allowing the temperature to change like that for so many years? As others have asked, when did that drift start? Why can’t you use that slope to backcast old temperatures, even if just coarsely?
“I acknowledge this invisible wall, you don’t! WHY NOT?”
I’ll have to say, that is one of funniest quotes I’ve read on a climate blog in quite a while.
Are you Borat?
stephen
Don’t you see the two upper and lower GMT boundary lines in the following data?
http://bit.ly/njBdvW
Are not these boundary lines invisible unless you draw them?
I do see those upper and lower lines Grima – I see them because you drew them. I don’t acknowledge an invisible governor though, because he is, well, invisible. In my experience invisible things usually aren’t real.
Look, I could do the exact same thing with a time line of my bank account balance that you have done with the climate data. I could probably identify cycles and a slope of some sort. I could encompass the data with a pair of straight lines demarking the limits of variation around the slope.
Would that mean I could spend money at will without consequence for my bank account? Of course not! My bank account balance varies for a reason – namely, because I deposit and withdraw money from it (you’ll have to trust me on that!) There is no invisible beneficent invisible governor obsessive compulsively poking my account back and forth around some mean incline. Would that there were!
Climate also changes for a reason – namely because energy is added, lost or moved about between reservoirs. That is the governor of the climate, and it is not invisible. One can measure it.
Frankly, I think it is a very bad idea waiting to see if such a non-informative prediction pans out. You have committed such a simple basic mistake that you might as well have pulled a number out of a hat. And waiting 10+ years has consequences when it comes to climate change.
I have to admit, this is the first time I’ve ever seen a statistical mime.
MartinM FTW!
Girma, you see what appears to be a rough pattern over a short period of time and you claim long-range cycle. You do this without taking into account observed physical changes–volcanic eruptions, the physics of GHGs, solar cycles, etc.–and your model produces an long range output (past and future) that even you would not believe. You do all of this and you still don’t recognize why you’re being laughed at. I don’t believe you when you say you’ll accept AGW if you’re proven wrong. You show no understanding of AGW, so acceptance won’t mean much–about as much as any of the posters here “accepting” your model.
Ugh, it must be a really slow month if Bastardi and Grima are on the table.
DSL | August 26, 2011 at 1:41 am — Well, a little earthquake didn’t speed it up, but now we have Irene…
Girma — Do study Ray Pierrehumbert’s “Principles of Planetary Climate”
http://geosci.uchicago.edu/~rtp1/PrinciplesPlanetaryClimate/index.html
but also enjoy “Why does climate change? Causes and Timescales” by Chris Colose
http://blog.timesunion.com/weather/why-does-climate-change-causes-and-timescales/1261/
Thanks David for the links.
Had not Tycho first accurately described the observed data for the orbits of the planets, before Kepler came up with the equations?
I don’t accept the “accelerating warming” interpretation of the GMT data by the IPCC.
I accept the GMT behaved like a pendulum with a swing of 0.5 deg C every 30-years with a steady warming of 0.06 deg C per decade.
Fortunately, we will find out which interpretation is correct within the next decade.
I will accept AGW if we see “accelerated warming” in the next two decades.
I will be vindicated if we see slight global cooling in the next two decades.
Yes, so you keep saying.
Got it.
Girma,
I’m hoping you can help me with a little puzzle I have in my lab. This morning I went into the lab and found a container with an unknown liquid sitting on a hotplate that is turned on to a low setting (some messy student left it there). The temperature of the liquid is 75degC right now, and the temperature seems to have been going steadily up by 0.1degC per minute for the last 6 hours (temp. was 39degC when I first saw the liquid 6hrs ago). This is a much simpler problem than the one with the earth’s temperature. My liquid temperature data doesn’t have any visible cycles, just a steady slope upwards, and the noise is very, very small (less than +/-0.01degC) because I have a very good thermometer.
What do you think the temperature of the liquid will be in 2 hours, assuming nobody changes anything in the setup? I locked the lab door to make sure nobody messes up with the setup. The data is right here in front of you, just like it is for the global temp. anomalies, and should allow us to make a prediction based on your methods.
The Tycho reference does you no favors Girma. Yes, Tycho accurately measured star and planetary position and movement, but he still misinterpreted it in terms of the sun and moon rotating around the earth.
So Girma’s “analysis” intrigued me enough that I got all “Tamino” on it and spent a good 15 minutes on the following exercise while some code was compiling/running.
To generated 130 years of temperature “data”. It was simply a linear trend with a slope of 0.01 deg/year, with some Brownian (red) noise on top (standard deviation of 0.05). I then generated a bunch of these and flicked through the plots. Lo and behold, who would have thunk it, a number of “cycles” appeared in the data.
These “cycles” were generally between 20 and 40 years in length, and varied with the time step and standard deviation of the data. Some “data” series showed no “cycles”. Others showed them very strongly. I did not run any significance tests on these cycles, because I’m lazy and have real climatology to do at my day job. My guess is that all but the “strongest” would fail most standard tests.
The point I think I’m trying to make is that it’s not hard to generate a fake data series that mimics the global temperature with some auto-correlated noise that gives the appearance of psuedo-periodic cycles. There are good reasons, physics based properly researched reasons, to suspect temperature anomalies to show some redness, and no reasons to impose arbitrary 30-year “cycles” that come from eyeballing the daya.
I’m certainly not a statistician (I only know enough to get into trouble), but even I can see through this. Why can’t the goons at WUWT, much less a highly educated engineer like Girma (who is clearly no Steven Goddard) not?
In other words, you emulated Girma perfectly, except for the ‘real climatology’ part.
Jeez, give me a break. It’s an (off topic) comment on someone else’s comment on someone else’s blog post. I gave Girma’s hypothesis around 15 minutes of my attention. That’s all I thought it deserved. All I wanted to do was make the point that “cycles” can appear by random processes.
So, to assuage my guilt I’ve now spent a total of 1 hour on Girma’s stuff. I used a Fisher test* on 1000 samples of synthetic “data” of 130 years long with red noise and a trend of 0.01 deg/year. Of these data sets, a surprisingly high number passed significance (about 15%) at the 90% level. Of the signals that passed significance, they generally had detected periods of less than 40 years (so “cooling” / “warming” cycles of around 20 years in Girma’s parlance). So, yes, it is possible to generate short, noisy time series that give the appearance of periodicity.
Happy now?
(As an aside, I found this really easy to do in Python. Python, I think I love you)
*I followed the recipe here: http://www.ict.griffith.edu.au/~alanliew/my_papers_eCopies/pr09.pdf
ChrisC
You wrote:
I followed the recipe here: http://www.ict.griffith.edu.au/~alanliew/my_papers_eCopies/pr09.pdf
Are you saying the GMT does not have the following highly “periodic expression profile”?
http://bit.ly/emAwAu
Hello Girma,
What I am saying is that in this data you have (barely) two complete cycles. This is insufficient data for demonstrating periodicity. Indeed, I can generate synthetic data with no periodic component, only auto-correlated noise, that gives the appearance of a periodic signal. You need to give some kind of evidence that this signal is periodic beyond an “eye ball” guess.
Your “cycles”, can (indeed, are likely to) arise simply because of noise in the data set and other factors (for example, its understood that the reduction in detrended-GMT between about 1940 and 1970 is due to increased aerosols in the atmosphere).
I recommend that you read this old post of Tamino’s to see what I’m on about: http://web.archive.org/web/20080421005505/tamino.wordpress.com/2008/04/15/cycles/
“Had not Tycho first accurately described the observed data for the orbits of the planets, before Kepler came up with the equations?”
We have the equations. We have the data. They match. They don’t show a 60 year cycle. They show various physical forcings affecting temperatures, and those forcings are what will decide temperatures in the decades and centuries to come, not imaginary cycles you’ve invented using the mathturbation that has blinded you.
“I don’t accept the “accelerating warming” interpretation of the GMT data by the IPCC.”
Yes, we already knew you denied the science. What’s more, you have not provided one physical reason to deny it. Like Bastardi, you are unwilling to learn from your mistakes.
PS: Tycho was a great astronomical observer, but his description of the orbits of the planets was wrong (not right) precisely because it lacked a proper physical basis. His data needed a Kepler for it to make sense.
I suspect we’re dealing with an attention-w****.
Let the observed data be the judge
Don’t forget me when the GMT drops to 0.13 deg in the next two decades.
For your reference, here is my article: http://bit.ly/o7w5fq
Thank you all.
Girma, you ask “why does the temperature not cross the line?”
I think the correct answer is “because you drew the line across temperature maxima”–one criterion for causation being that the cause (temperature maxima) must precede the effect (line), after all.
This one doesn’t even rise to “post hoc, ergo propter hoc.”
Don’t worry. I’ll be reminding you about our bet when the time comes. ;D
Hey Todd: has this situation of a .06C/year upward trend with periodic .5C pendulum swing always been the case?
>> invisible box
> a statistical mime.
Perils thereof, llustrated:
http://fourpanelhero.deviantart.com/art/Why-mimes-shouldn-t-cheat-194898587?offset=0
That is a perfect metaphor for the entire climate denial movement, except that (sadly) when are in the box with the mime while mother nature is nailing us in.
How on earth did you find that?
ChrisC | August 26, 2011 at 8:27 am — Pink noise produces “cycles” when one eyeballs the series:
1/f noise: a pedagogical review
http://arxiv.org/abs/physics/0204033
1/f noise
http://www.scholarpedia.org/article/1/f_noise
Red noise (1/f^2) produced even more pronounced “cycles”; both cases being like the bear upon the stair.
By “when” I meant “we.”
Girma:
A quick comment about your answer to a previous question.
When asked why you refuse to backcast the temperature series prior to 1850, you replied by quoting Phil Jones as saying ““Temperature data for the period 1860-1880 are more uncertain, because of sparser coverage.” You conclude from this that, “As a result, the GMT data before 1880 cannot be used for verification.”
Two quick points. First, the fact (if it were a fact) that data prior to 1880 cannot be used for verification does not mean that you cannot use your model to do the actual backcasting or retrodicting. But second, and more importantly, surely even fairly unreliable data prior to 1880 are sufficient for falsifying outlandish claims. For instance, if a given climate model “predicted” that GMT in the 15th century was, say, 45C lower than GMT today, we know enough to conclude that the model is incorrect, right?
So, surely, even if we can’t “verify” whether a model gets things exactly right, we can certainly test whether it’s even in the ballpark, no? Or is your claim that the data prior to 1880 are so unreliable as to not permit even “ballpark verification”?
Brian
Okay.
Here is my estimation for the 1850s.
As the GMT for the 1880s was a peak, the GMT for the 1850s should be a GMT valley. Therefore,
GMT for 1850s = GMT for 1880s – 0.68 = -0.27 – 0.68 = -0.95 deg C.
But the observed data is about –0.43 deg C.
For some reason the two results do not agree.
“For some reason the two results do not agree”
But doesn’t it give you serious doubts about the validity of your simple model? At a minimum, it should kill any confidence you might have that it has any predictive power for the next few decades.
Indeed, if the upper bound falls by 0.6 deg C per century going back in time then estimates of past temperatures don’t have to be very accurate at all to falsify the upper bound. e.g. going back to the middle ages, 1000 AD, gives an upper bound of 6 deg C lower than it is now. There is no way in the world that the world (pardon the pun) was 6 degrees C colder (a full-on ice-age) during the “medieval warm period” than it is now. So Girma’s upper bound is falsified. It is nothing more than an accident of instrumental history.
Chris
What I am saying is that the current 130-year pattern can reasonably be extrapolated for ONLY 20 years. Of course this has to be verified with observation in the next two decades.
IPCC’s 0.2 deg C per decade further warming in the next two decades also need to be verified with observation.
According to the observation so far, IPCC’s projection is not looking that promising as the GMT appears to hit its upper boundary line and bounce back as shown in the following graph.
http://bit.ly/n7uB0b
Okay. You may ignore what I say. Will you ignore what Prof Michael Mann says in a paper he coauthored?
A signature of persistent natural thermohaline circulation cycles in
observed climate
Jeff R. Knight, Robert J. Allan, Chris K. Folland, Michael Vellinga,
and Michael E. Mann
http://bit.ly/nfQr92
Analyses of global climate from measurements dating back to the nineteenth century show an ‘Atlantic Multidecadal Oscillation’ (AMO) as a leading large-scale
pattern of multidecadal variability in surface temperature. Yet it is not possible to determine whether these fluctuations are genuinely oscillatory from the relatively short observational record alone. Using a 1400 year climate model calculation, we are able to simulate the observed pattern and amplitude of the AMO. The results imply the AMO is a genuine quasi-periodic cycle of internal climate variability persisting for many centuries, and is related to variability in the oceanic thermohaline circulation (THC). This relationship suggests we can attempt to reconstruct past THC changes, and we infer an increase in THC strength over the last 25 years. Potential predictability associated with the mode implies natural THC and AMO decreases over the next few decades independent of anthropogenic climate change. Citation: Knight, J. R., R. J. Allan, C. K. Folland, M. Vellinga, and M. E. Mann (2005), A signature of persistent natural thermohaline circulation cycles in observed climate, Geophys. Res. Lett., 32, L20708, doi:10.1029/2005GL024233.
xxxxxxxxxxxxxxxxxxxxxxxxxxxxxxxxxxxxxx
What Future Observation Will Confirm Anthropogenic Global Warming?
In its Fourth Assessment Report, The Physical Science Basis, the IPCC stated:
“For the next two decades, a warming of about 0.2°C per decade is projected for a range of SRES emission scenarios. Even if the concentrations of all greenhouse gases and aerosols had been kept constant at year 2000 levels, a further warming of about 0.1°C per decade would be expected.”
http://bit.ly/n1S1Jf
As shown in the graph above, a GMT increase in the next two decades of 0.2 deg C per decade as projected by the IPCC, to a value of about +1.0 deg C by the 2030s, means that the GMT will stop behaving like a stable pendulum, and the magnitude of its swing will start to increase from its constant value of 0.5 deg C for the last 130 years. This also means that the slope of the upper GMT boundary line will increase from its constant value of 0.06 to 0.2 deg C per decade. If this happens, the climate will have shifted and we skeptics should accept anthropogenic global warming.
Further 0.2 deg C per decade warming will not happen because of the existence of oceanic thermohaline circulation cycle.
Expect global cooling in the next two decades.
Note that the THC anomaly in Figure 4 of the above paper correlates well with the following global mean temperature data:
http://bit.ly/emAwAu
(@Todd continued)
…and will +.06C/yr with a .5C cycle superimposed always be the case?
I assume you would answer “no” to my earlier question…it can’t have always been the case, as Rafael and Brian and others have tried to get you to acknowledge. The planet would have been too cold for life in the relatively recent past.
And I imagine you would answer “no” to this second question as well…or maybe you really think in 1000 years the earth will be 60C warmer than today on average.
If you acknowledge that the pattern you extract from the data has changed and/or is likely to change in the future…what do you think might have caused past changes? What do you think might cause future changes?
And if your answer is “I don’t know,” then on what basis can you predict that for any given amount of time it *won’t* change?
Without physical reasoning, you are saying: “This is a system that changes for reasons I don’t understand and cannot predict, but I can CONFIDENTLY predict pretty much exactly what it will do in the next 20 years.”
And also: “Although 97% of the people who have made a career out of studying this system think they do know quite a bit about the reasons this system changes, they are wrong. I.e., my absence of knowledge of climate forcings puts me at a predictive advantage over climate scientists.”
Kevin
“I assume you would answer “no” to my earlier question…it can’t have always been the case, as Rafael and Brian and others have tried to get you to acknowledge. The planet would have been too cold for life in the relatively recent past.”
I agree.
Although the upper GMT boundary curve is a straight line for the relatively short 130 years data, in a longer time scale, it is part of a very long curve that contains the Little Ice Age, Medieval Climatic Optimum, Holocene Maximum, etc.
What I am saying is that the GMT data for the last 130 years shows a persistent warming of 0.06 deg C per decade with cooling & warming of 0.5 deg C every 30 years.
This interpretation is more reasonable than IPCC’s “accelerated warming” shown in the following graph:
http://bit.ly/b9eKXz
In its Fourth Assessment Report, The Physical Science Basis, the IPCC stated:
“For the next two decades, a warming of about 0.2°C per decade is projected for a range of SRES emission scenarios. Even if the concentrations of all greenhouse gases and aerosols had been kept constant at year 2000 levels, a further warming of about 0.1°C per decade would be expected.” (http://bit.ly/caEC9b)
Here is the above projection shown graphically: http://bit.ly/n1S1Jf
A GMT increase in the next two decades of 0.2 deg C per decade as projected by the IPCC, as shown in the above graph, to a value of about +1.0 deg C by the 2030s, means that the GMT will stop behaving like a stable pendulum, and the magnitude of its swing will start to increase from its constant value of 0.5 deg C for the last 130 years. This also means that the slope of the upper GMT boundary line will increase from its constant value for the last 130 years of 0.06 to 0.2 deg C per decade. If this happens, the climate will have shifted and we skeptics should accept anthropogenic global warming.
This is almost impossible because it is physically impossible for the climate to suddenly change in the next two decades from its pattern for the last 130 years. There is also a physical explanation for this impossibility given in a paper coauthored by Prof Michael Mann that shows there will not be any further warming due to the cooling phase of the oceanic thermohaline circulation (http://bit.ly/nfQr92)
AMO = de-trended area-weighted mean of North Atlantic Sea Surface temperature anomalies
“Girma” oscillation = de-trended area-weighted mean of global surface temperature anomalies
Hmmm … I wonder why these two resemble each other?
G: it is physically impossible for the climate to suddenly change in the next two decades from its pattern for the last 130 years.
BPL: Change the input, change the output. If the sun permanently doubles its output tomorrow, will the climate suddenly change? Why or why not? Show your work.
And then, according to the Knight et al. paper (p. L20708 top right) the global temperature peak-to-peak variability in their simulations due to AMO, as computed by regression, is 0.1 degrees. But Girma’s/todd’s peak-to-peak oscillation from the global instrumental data is no less than 0.5 degrees… where did the missing 80% come from?
Even the peak-to-peak of really observed, instrumental North Atlantic sea mean surface temperatures is only 0.4 degrees (Figure 1a). As the Southern Hemisphere isn’t along at all in the AMO, again how do you get to Girma’s 0.5 degrees globally?
Gavin’s
Due to the persistent 0.06 deg C per decade warming, during the 30-years global cooling phase the actual fall in GMT = 0.5 – 0.06×3 = 0.32 deg C, not 0.5 deg C.
Eh, was this meant as a reply?
Apparently not…
This whole exchange belongs in Bedlam.
I’m sure the residents there will recognize it.
At first this was amusing. Now it has become embarrassing. Soon it will be painful…
…Like 15 minutes at WUWT.
Girma’s had much more than 15 minutes at WUWT…
Well, not wishing to be accused of ignoring Knight et al., I find that it says, inter alia:
“The simulated temperature changes associated with THC variability cannot fully explain the 0.6 C of 20th century warming seen in both global and Northern Hemisphere mean temperature [Folland et al., 2002], but are
large enough to modify estimates of the rate of anthropogenic climate change.”
Which suggests to me that Knight et al do not “expect global cooling.”
> cannot fully explain
The art of understatement…
As a Canadian born and bred, I am highly appreciative of understatement.
(Oops, maybe that was too enthusiastic.)
I’m curious about our host’s lack of response to Girma’s blundering about.
A measuring of rope mayhaps?
G, do me a very large favor, please, even though I’m a complete stranger.
Do the following things:
1. Buy an introductory statistics book. Read it, study it, work all the problems.
2. Do a linear regression of temperature on time for the 130 years you’re using. Check the t-statistic on the coefficient.
3. Add a squared time term and check t for that. Then cubed, then so 4th power, and so on. What happens to the t values as you add more terms?
4. Learn how to do a “partial F test.” Apply that to each model compared to the previous one. How long does significance persist?
Note: p = 2.
-BPL
That last line should have read, you generally want p .LT. 0.05 (using Fortran notation, since angle brackets set off an HTML browser freakout) for a scientist to take a term in a regression seriously. This corresponds to roughly |t| .GE. 2.
-BPL
Also, that first “so” in step 3 should be deleted.
-The Proofreading Fairy
Barton Paul Levenson — You don’t actually expect him to do that, do you?
Barton Paul Levenson
I don’t want to be bogged down with statistics in the chaotic ANNUAL GMT, which varies widely with one year changing from the previous one by up to +/-0.2 deg C. As I see the GMT data, the only predictable values are the extreme GMT that lie on the upper and lower boundary lines that occur at about every 30 years as shown in the following graph.
http://bit.ly/njBdvW
Since we had the same warming from 1910 to 1940, the current warming from 1970 to 2000 is not unprecedented. AGW can only be confirmed if we have further warming above the 2000s GMT anomaly peak of about 0.45 deg C in the next two decades.
Can we wait for this confirmation before implementing any policy?
Well, the problem with waiting is that if the mainstream view is correct, then we have landed ourselves much, much deeper into the soup by the time we have that ‘confirmation.’ Rather like a driver saying, “I’m not sure that’s a cliff up ahead!” and holding off the brakes.
If potential costs are a concern–as they seem to be for many ‘skeptics,’ who could fairly be called financial ‘alarmists,’ if you ask me–there are quite a few ‘no-regrets’ strategies that could be given first priority. Energy conservation measures are one such; typically there is a big payoff environmentally and financially, though initial costs can be a serious barrier. But there are others as well; this is a big topic.
I really like that term, financial alarmists. Brilliant. But I wouldn’t put it in scare quotes.
IPCC has made a projection of 0.2 deg C per decade warming.
[Response: Get the facts straight. That’s “about” 0.2 deg.C/decade over the next several decades, not “at least” 0.2 deg.C/decade each and every decade.]
Policy must follow validation of a scientific theory. AGW, if true, is a long term problem. A decade will not make much difference. However, verification is a must for the integrity of climate science. Further warming in the next decade would make many of us skeptics join the AGW camp. Science without validation is not science; it is something else that I am not allowed to say in this blog.
[Response: Global warming science is based on fundamental physics. Your theory is based on nothing but numerology. But you want your flim-flam to dictate policy because you’re so afraid of “expense” that you’re willing to risk the life and health of generations to come. Shame.
Your crackpot theory is the one that has NO verification at all — so why do you believe it? Projections of warming were made decades ago (and in fact even before that) AND THEY HAVE ALREADY COME TRUE.
You have the gall to demand “verification” — but you claim to know the truth without it, while you and your gullible ilk won’t accept it when it’s right in front of your face. As for convincing “skeptics,” you’re just a fake one.]
Kevin McKinney.
The allegory I use is that of the captain of the Titanic saying “that’s not an iceberg ahead”, then saying, “well, it might be an iceberg, but it’s smaller than you claim, and we can’t afford to lose speed”, and then saying “other ships have struck icebergs and suffered no damage”, and then saying “OK, so it’s an iceberg, but running into icebergs is good for cleaning the hull of the ship”…
…and then, when he’s slammed straight into the massive berg and opened his hull as he would a sardine can, he yells “full steam astern!” to the engine room…
Torsten, thanks! Punctuate it how you will–I have an unfortunate liking for ‘scare quotes.’
Bernard, very apt–except maybe the post-contact behavior, which might just as well be “Bump? What bump?”
You forgot to add that the wealthier passengers were up on the bridge, chortling and egging on the captain. When the sardine can spilled its contents, they were already in the only lifeboats, one per boat, with some explaining to the drowning passengers not to worry because “the economy, you know, lifts all boats” and others saying, “well, you know, you chose to be a second-class passenger. Not my fault. I was only doing what God intended me to do,” and still others grinning and saying, “Externalities are a bitch, aren’t they?” Glug glug glug . . .
Now that’s what I call ‘working a metaphor.’
(Scare quotes intentional.)
Kevin, it gets worse. It turns out that the wealthier passengers also have shares in a shark farm, and so they call up their managers to helicopter in a few hundred sharks. I mean, after all, why let all that drowning meat go to waste? Crisis is opportunity.
Analogy is funner than Girma.
And it’s a judgement call which of the two should make one queasier.
A coincidental illustration serendipitously came upon this fine day: http://content.cartoonbox.slate.com/?feature=621c703b340245f44bceb2a1b1380e33
Tell me why not using best mathematical tools ? Maybe, just maybe, cause you don’t get a clue ? And why using method, which increases noise instead of decreasing it ? I mean, why to spoil data and make it even more susceptible to random events ? This makes no sense to me and is actually putting fog on things in order to prove your point. Not very convincing to me, actually. But very, very desirable when you want to do politics instead of actual measurements and science – which is politically unbiased as far as I know. And yes, science and measurements must and shall provide the policy makers the most accurate data and predictions possible – it is still up to politics, what they will do about it, but to question scientific measurement and as accurate predictions as they can be made with use of at most unscientific and inaccurate points, is a way to most distorted politics I can think of. And, yes, if you are real worshiper of free market and democracy, you should know that the very base foundation of free market and democracy is that all people are well informed about issues. So if you want to support democracy and free market, you should work with pure scientific honesty and try to learn.
“Can we wait for this confirmation before implementing any policy?”
I might be willing to wait if you could actually provide a compelling physical reason why global temperatures should be following your drifting pendulum model, or if the IPCC analysis was simply an extrapolation of the global temperature trend from 1980-present.
But your model is entirely conceptual and the IPCC analysis is based on our best understanding of the relevant underlying physics.
So forgive me if, in the meantime, I choose to base policy on the best available science until the evidence shows otherwise.
Girma, when discussing the cosmic-cycles ‘paper’ over at WUWT one of the authors complained that critical commentators ‘must be biased’ against considering cycles.
Well it’s true.
The bias in question can neatly be summed up as Ockham’s Razer, which postulates that smart people consider hypothesis which require testing fewer new concepts first – because that’s the most efficient way of doing research and the best way to ensure you don’t waste your short life chasing imaginary fairies.
What you and the cranks over at WUWT are postulating requires Global Mean Temperatures to have an invisible upper boundary, a lower boundary, to behave like a steady pendulum and to be governed by mysterious 30 year and 60 year cycles which may or may not come from the cosmos (but no other cosmic cycles apply, just those two) none of which are anywhere near robustly evident in the temperature data – and all of which are not only untested, but also new to science.
And it’s not as though there isn’t already a very good explanation.
If I was an arse I’d suggest you go away and spend your life hunting these strange cycles – but in truth it would certainly be a life wasted and I wouldn’t wish that on anyone, not even a dedicated crank.
Jay
“The bias in question can neatly be summed up as Ockham’s Razer, which postulates that smart people consider hypothesis which require testing fewer new concepts first – because that’s the most efficient way of doing research and the best way to ensure you don’t waste your short life chasing imaginary fairies.”
Girma
I agree completely with that statement: Postulate climate changes naturally as it has done for millennia!
Jay
“If I was an arse I’d suggest you go away and spend your life hunting these strange cycles”
Girma
The data clearly shows the global mean temperature has a cyclic component
http://bit.ly/c0Jvh0
Jay, should I stop believing my eyes?
Yes, because they are lying to your very muddled mind.
Humans are notoriously inept at discerning real patterns from pseudo-patterns in 2 dimensional (or higher) data. It’s one of the many reasons why we use statistical analyses with which to interpret data, and you have soundly demonstrated to the world over the last several years that you have a very poor – in fact, an almost completely ignorant – grasp of statistical analysis…
Grima, what is the physical basis for the patterns that you claim to see? What causes the ‘ups’ and the ‘downs’, and what causes the underlying increasing trend that you keep sweeping under the carpet, and what causes the “imvisible boundaries” of which you are so enamoured?
I can guarantee that you will not be able to come up with a robust physical model that accounts for your “claims”, and that simultaneously describes why the phenomena identified by climatologists (including increasing GHGs and other forcings/feedings-back/sensitivies) do not actually contribute to current temperature trends. I can pretty much guarantee that you will not be able to elucidate a physical model of any description.
You are a self-deluded, egocentric Dunning-Kruger afflictee of the highest order; one who is firmly convinced that he can see, using lower high school arithmetic, what thousands of professionals using complex state-of-the-arts have missed.
It’s pathological – a disease – and to the extent that you’re contributing to – and enabling – delay, you’re inflicting on many, many innocent people the consequences of your intellectual illness. In decades to come you will be reviled for your complicity in inaction to address human-caused global warming.
Girma
“I agree completely with that statement: Postulate climate changes naturally as it has done for millennia!”
“Naturally” is not a forcing. Paleoclimatology shows us what those “natural” forcings (and feedbacks) are/were. So it’s not like “natural” sources of climate change are some impenetrable mystery.
The greenhouse effect is also “natural,” in that it is a feature of the physics of this universe. The human species is also “natural;” it is a product of biological evolution on this planet. The distinction between human and non-human sources of change on this planet is important to *us*, since it points to what we may or may not hope to control, but that distinction means nothing to physics. We are every bit as “natural” as the organisms that filled the atmosphere with free oxygen however many billions of years ago….
G: The data clearly shows…
BPL: Until you take a statistics course, so you understand what you’re doing, you have NO WAY OF TELLING what the data clearly shows.
“Postulate climate changes naturally as it has done for millennia!”
Right. In response to actual forcings. There’s no physical thing called “natural variation”. Natural variation is the variation of an actual physical process. A volcano explodes. The sun dims or brightens. An ocean current brings a mass of very cold water up from the deep. It definitely isn’t a statistic about the process. Statistics are descriptions with numbers. They’re like numerical adjectives. You seem to imagine that the adjective “red” is an actual tint.
Actually, I doubt that you do. IMO, you’re like so many deniers — neurotics and showboats just pleased to attract attention. Trivial but, alas, you vote.
You know what? We’ve been hammering away at Todd/Girma for his interpretation of the evidence here but you know what? At least he has expressed an openness to re-thinking his position if future data goes outside what his model leads him to expect.
I think we’ve all probably engaged people, on the internet and/or irl, who appear to be *completely* closed to letting new data change what they “know.” They take the Procrustes approach…anything that doesn’t fit what they “know,” they cut off what they don’t like and strrrrrrrrrretch what they do like, far beyond valid inference.
So I just want to say that I appreciate that about Todd.
(I have no idea why the evidence hasn’t *already* convinced him of course…)
Ooooh, YEAH.
And we don’t need to “search” for replacements. We already have them, and they are increasingly affordable. Indeed, in some cases, notably energy efficiency, they actually save money.
What’s needed (among other things) is less mythology promulgated by those vested in the status quo, and more clear-sighted pragmatism.
Kevin
Thank you.
As fossil fuels have transformed the naked animal to human, by protecting him from the freezing winter, sweltering summer, backbreaking drudgery, etc, we must be absolutely sure that their uses really cause global warming, before we search for their expensive replacements.
IPCC says 0.2 deg C per decade in the next two decades.
The data shows a long term (130-years) warming of 0.06 deg C per decade.
The data shows a 30-years warming of 0.16 deg C per decade.
http://bit.ly/njBdvW
In the next two decades, what will be the observation?
a) I PCC’s warming of 0.2 deg C per decade
b) Slight cooling similar to those after the 1880s or 1940s
We have to wait for the observations for confirmation.
What is the cause of the long-term warming of 0.06 deg C per decade? Is this warming rate due to human emission of CO2? Why was no change in this warming rate before and after mid-20th century?
Longer Girma: “we must be absolutely sure that their uses really cause global warming”
Shorter Girma: “Look, something shiny”
This has become a Groundhog Day train wreck.
Huh? Say that again?!
“… transformed the naked animal to human…”?
“…protecting him [?!] from the freezing winter, sweltering summer, backbreaking drudgery…”?
“…we must be absolutely sure that their uses really cause global warming, before we search for their expensive replacements”?
This is leg-humping Randian necrophilia of the silliest sort. The pathetic thing is that you probably have absolutely no clue why this is so.
That you don’t know the answers to these questions shows what an ignorant you really are. The physics involved completely eludes you, by your own admission.
No we don’t.
And if we did, and if (as is the case), the physics is correct, then waiting for the sort of confirmation that would convince you, would be far too late.
Like the captain of the Titanic, you would be calling for evasive action only after your vessel has already been cleft in twain.
Girma/Todd,
I would really appreciate an answer from you to the problem I posted earlier about predicting the temperature of a liquid that was slowly heating up in my lab on Friday. It’s a very simple problem, so I want to know how well your prediction methods apply to it.
Rafel’s Question: Find T(2hrs)
http://bit.ly/mXzgjz
Linear Equation => T(t) = mt + c, where t is minutes
Given: m = 0.1 deg C per minute; T(0)=c=39 deg C; T(6hrs)=75 deg C
Solution:
T(2 hrs) = T(120 min) = mt + c = 0.1×120 + 39 = 51 deg C.
Check:
T(6 hrs) = T(360 min) = mt + c = 0.1×360 + 39 = 75 deg C.
Sorry Girma, but I was asking for the temperature 2hrs after the 6hr point at which I posed the problem, so that would be t = 8hrs. I’m sorry if I didn’t make that clear.
In that case T(8 hrs) = T(480 min) = mt + c = 0.1 x 480 + 39 = 87 deg C.
Maybe his life would be more productively spent searching for Sasquatch – sitings of which seem to be somewhat cyclic, after all!
Girma | August 29, 2011 at 11:47 pm — Yes, you should. Instead learn the physics; I provided a link to a very good book.
Host:
“You have the gall to demand “verification” — but you claim to know the truth without it.”
I am not claiming I know the truth.
Feynman advised: “Details that could throw doubt on your interpretation must be given, if you know them”
http://bit.ly/hiD0JD
IPCC gave an “accelerated warming” interpretation of the data.
http://bit.ly/b9eKXz
I gave a cyclic warming interpretation of the data.
http://bit.ly/ps8Vw1
What is wrong in verifications of possible interpretations with observations?
We know that AGW is a long-range problem, and a decade of verification will not make any difference.
[Response: You have repeatedly used the phrase “almost impossible” to emphasize your disbelief that your crackpot theory could be mistaken. In your previous comment you insisted that science without verification is meaningless, but you can’t see that your own nonsense is meaningless. Meanwhile you refuse to accept the verification of mainstream global warming theory that has ALREADY happened. What a load of crap — you’re not even consistent with YOUR OWN standards.
When it’s pointed out that your “theory” utterly fails before 1880, you resort to “the earlier data are too unreliable.” How pathetic! The earlier data are less reliable than modern data, but they’re plenty reliable to contradict your idea — one which can’t even make a successful hindcast, let alone forecast.
And you still have not one shred of physics to back you up. How scientific is that?
You are not a skeptic at all. You are a gullible numerologist so in love with you own theory, that you’re willing to risk LIVES on the outcome. Other people’s lives. We’re at the brink of crisis but you want to wait decades for verification — when you’re too blind or stubborn to see the verification that’s staring you in the face. Disgusting.]
Tamino, Rafel, Daniel, Kevin, Jay, Ernst, Patrice, Barton, dhogaza, Gavin’s, Chris, Brian, Stephen, Jeffrey, MartinM, DSL
Please give me the luxury of asking you one and only one question.
In its Fourth Assessment Report, the IPCC reported to the world “accelerated warming” of the globe shown in the following graph.
http://bit.ly/b9eKXz
Is this “acclerated warming” interpretation of the global mean temperature data valid? Why and why not?
First, they say it “indicates accelerated warming”, which it undoubtedly does because acceleration is defined as increasing slope. Even your model indicates accelerated warming over the period mentioned. The difference is that your model predicts that rapid deceleration has already started. I’ve also pointed out that a quadratic trend + a cycle fits the data better than your linear trend + cycle.
Now it is well known that cycles can confuse trend analysis, if they are real cycles and not merely an artifact of our instinctive tendency to see patterns where they don’t exist.
What your theory needs is a compelling reason to believe that there is a physical cause of your cycles that can explain their magnitude and frequency. You don’t have one – your unsubstantiated AMO isn’t strong enough (as others have pointed out).
There is absolutely no evidence for any large “energy source” (I’m using that term loosely) that fluctuates over 60 year cycles. Your model breaks down when you try to use it to make a short-term hindcast.
The IPCC analysis is based on detailed modelling of the underlying physics. That figure you linked is just an illustration of what is happening – it’s not the actual analysis. We do know of a significant “energy source” (again, used loosely) that can cause significant warming that is also accelerating – greenhouse gas concentrations, particularly CO2.
If you seriously think that the IPCC AR4 report is equivalent to your analysis then you are beyond reason. I could understand it if you were a scientific layman, but you are apparently well trained in the physical sciences. You should know the difference between real physical modelling and curve fitting.
Girma, the rise in global temps you refer to is a response to the radiative forcing from mankind’s CO2 emissions. This is something we can measure (the CO2 output and the rise of the atmospheric concentration of the same). Based on that and the lags due to thermal inertia of the oceans, and other major forcings being static, we see the expected rise we do. Arrhenius predicted it (as best he could at the time) over a hundred years ago, Wally Broecker predicted it back in the 1970s, James Hansen predicted it back in the 1980s.
All those predictions, based on the radiative properties of CO2, comply with known physics. Unless you have some “Magic Physics” that shows why anthropogenically-derived CO2 differs in its radiative properties that does that already present in the carbon cycle, you’re a crackpot wearing a tinfoil hat. There’s no polite way of saying it other than that.
Don’t ask me, I’m a lay person.
But it does occur that if warming was linear the graph would show it. If the warming was decelerating the graph would show that also. But it doesn’t – it shows that the warming is accelerating. Which is clearly what the data is doing – so it seems fair enough to me.
It also occurs that the graph doesn’t predict the future. That’s what physics is for. Nobody is saying that because warming has accelerated in the past it must carry on accelerating. They’re saying that warming will continue because of physics – ie tangible physical reality and processes that we can observe, poke, pull apart and measure.
“…we must be absolutely sure that their [fossil fuel] uses really cause global warming, before we search for their expensive replacements”?
I don’t know where you’ve been for the last 30 years, but there’s been a concerted, multi-billion dollar international effort, at the behest of policy makers, to do just that.
And it doesn’t matter whether it’s satellites pointing this way or that, an international network of temperature monitors on land and sea, evidence from geology, paleoclimate, oceanography, atmospheric sciences, biology, chemistry or physics – all the data points to CO2 in concert.
Frankly, to dismiss all that science and decades of international endeavor without having much of a clue about it and claiming instead that an up and down bit in some up and down data must ‘clearly’ be a cycle and thus an explanation is utter foolishness. And that foolishness is what you’d want to base public policy on, not just for your home country, but as this is an international commons issue, for the entire world.
Jay
Girma-san,
Here are the average NASA GISS land-ocean temperature anomalies for each decade since the 1880s:
Decade Anomaly
1880s -0.25
1890s -0.26
1900s -0.27
1910s -0.28
1920s -0.16
1930s -0.03
1940s 0.04
1950s -0.02
1960s -0.01
1970s 0.00
1980s 0.18
1990s 0.32
2000s 0.51
A linear fit is dT = -11.1455 + 0.00572 D, where D is the decade mid-point (1885.5, 1895.5, 1905.5, etc.). This has R^2 = 85%, standard error 0.098, and the t-statistic on the D term (7.88) is significant at p < 7.51 x 10^-6. A darned good fit.
But now I do a quadratic fit: dT = 166.3156 -0.17678 D + 0.0000469 D^2.
This one has R^2 = 91%, SE 0.078, a better fit. But the t-statistics on the X terms are now -2.60 (p < 0.0267) and 2.68 (p < 0.0231).
Cubic: dT = -4829.446 + 7.530 D – 0.003915 D^2 + 0.0000006789 D^3. This has R^2 = 93%, SE 0.076. Apparently it's a better fit than the quadratic, and it would LOOK like a better fit on a graph.
But! The t-statistics on the X terms are now 1.25 (p < 0.242), -1.27 (p < 0.237), and 1.28 (p < 0.231). None of them are significant any more. We fit the data points better, but at the cost of an equation where the terms don't mean anything.
Your curve fit was nicely done, but there are too many terms for it to be a meaningful description of nature. Consider a 13th-power fit to the above 13 data points–that would have R^2 = 100%, an apparently perfect fit. But it would be absolutely meaningless. You'd do just as well to copy the points and call it a perfect fit.
The more complex your equation, the more likely the added terms are meaningless, or at least not statistically significant. You have to justify each new term in a regression, and that's where the "partial F test" I mention comes in. You can also check the t-statistics on the coefficients, as I did above.
Please crack an intro stats book. The study is interesting in and of itself to anyone with a real interest in math. Anyone can learn. There are plenty of things I don't know either, including, I'm sure, areas you're very well versed in. If I were to talk about those areas, I'd have to study them first. You're in the same boat with regards to statistics. It doesn't make you a bad person. Ignorance, of any subject, is not morally culpable. But refusing to learn when you could… that, in my book, is intellectual sin.
You have the brainpower to learn this stuff, your math abilities show that. Don't waste it. Study. It's a good thing.
I give up.
Girma,
thanks a lot for answer the question about my little lab puzzle. I appreciate that you took the time to answer.
Here is the teachable moment I had been waiting for since I posed my question. The fact is that you had absolutely no way to know what the temperature of the liquid in my lab was going to be at t=8hrs without knowing more about the physical characteristics of the system. Only looking at the temperature vs. time curve would not allow you to make any solid predictions either forward or backward in time. Any such predictions you make can be correct only because you are lucky, not because you truly understand what’s going on. The fact that the temperature had been going up linearly for 6hrs in my experiment did not mean at all that it would continue doing the same in the future. There are different scenarios under which the temperature would stop going up (for a while at least), or the slope will change, due to the physical properties of the system. For example:
1) If the hot plate is set high enough, the fluid reaches its boiling point, where further heat addition does not increase the temperature at all until the liquid has completely evaporated. If the fluid was, for example, ethanol, with a boiling point of 78degC, the temperature would reach 78degC, then stay there until all the ethanol evaporates, and then continue going up after that, but likely with a steeper slope than at the beginning (at least for a while). After the liquid evaporates less heat is required to rise the temperature of the system, since you don’t have the evaporative heat loss you had when there was fluid in the container. In this scenario, the temperature will almost for sure not be the 87degC you predicted for t=8hrs.
2) If the hot plate is not set high enough, at some point heat losses due to radiation, air convection around the container, and liquid evaporation will match the heat input provided by the hotplate and the temperature will stabilize until all the fluid has evaporated.
Many other scenarios are possible, but the main point here is that looking at data and doing fancy fits to it is meaningless unless you understand the physical mechanisms that are responsible for producing the data. The fact that you see a certain slope and two up/down “cycles” in the global temp. vs time curve do not mean anything at all, unless you have a model for the climate that incorporates the physics of how the atmosphere and the oceans, and all those other things work together. If we didn’t have any information about the physics, then we would have to rely on your methods to make predictions, knowing that the predictions would be very, very poor. But we have tons of information about the physical processes that drive the climate. That information has been put into both simple and very complex *physical* models that scientists use to make predictions. So I trust those models way more than your little “curve divination”. If your “mathturbation” is pathetically wrong about something as simple as a pot of liquid on a stove, what chance does it have with the climate of a whole planet?
I forgot to make clear that in scenario 2 above, the hot plate is not set high enough to bring the fluid to boil. The fluid will evaporate without boiling.
[edit]
Tamino, you say that is my “crackpot theory”. However, that is my HONEST interpretation of the data.
[Response: So you’re an honest crackpot.
In case you haven’t noticed, we’re no longer interested in having you link to the same graphs over and over and over again.]
I’m still kind of hung up on the point that if one uses GISS, your honest interpretation was proven wrong less than 10 years after 1998’s peak-that-shall-not-be-exceeded. If your system worked, wouldn’t it still work when the arctic is included?
“TomG | August 30, 2011 at 4:57 am |
This has become a Groundhog Day train wreck.”
The Guinness World Record Girma Train Wreck is apparently held by the 2213 comments at Deltoid (Aug. 2009-Jan. 2010):
Matthew England challenges the climate science skeptics at the Ultimo Science Festival
http://scienceblogs.com/deltoid/2009/08/matthew_england_challenges_the.php
Sorry CC.
I just clicked Deltoid’s meter over a little more.
Yep, during which I made the bet with Girma.
Tamino
Thanks for indulging me with my contrarian posts.
Kind regards to all
Girma,
Thank you for your polite conduct in the face of determined, and sometimes hostile, opposition. I hope you’re not leaving permanently. If you read this, please, please, do take an intro stats course. You can learn almost all of what you need very quickly that way, and study the details you need on your own. The basic concepts are important.
Barton wants to assume the best in all human beings… Girma, show yourself worthy.
It’s not entirely an assumption. . . Girma was polite, if persistent.
I’ve “known” Girma for about 2 years now. He’s always been polite and I’m convinced he’s sincere in his beliefs, misguided as they are (IMO).
If I ever meet him, I’ll gladly buy him a drink, which is not something I’d even consider for many “climate sceptics” out there.
TrueSceptic, politeness is overvalued. Think of S. Fred Singer, “Chief Smiling Bull”, always polite, soft-spoken, never losing his temper, impeccably dressed with his butterfly tie. Yet this is the monster that deceived Roger Revelle on his deathbed.
Perhaps Girma has the saving grace of being honestly deluded; perhaps. IMHO it’s hardly an excuse he has left after this thread. But politeness is overrated. Among character traits that do earn my respect, the ability to get honestly angry at dishonest bull figures high. Unfortunately it doesn’t with the public. That’s a bug, not a feature.
You are probably right. Without politeness, charlatans, shysters, and crooks in many spheres would not succeed in what they do.
Fred is a good example, isn’t he? Always comes over like a favourite uncle when he’s telling the most outrageous lies.
He’s just – “politely” – repeated his drivel over at Real Climate, showing absolutely no indication of having learned a thing (given that he’s hijacked threads at several sites over the last couple of years, and has been awarded guest poster status at WUWT, this is no surprise).
In my mind, such behavior is just about as rude as one can be.
If Girma very politely gave us tickets to an one way ride into a Canfield Ocean scenario would that make it okay??
I was reprimanded on another blog for calling him a nutbar, but I will stand by that call.
He is a nut.
TrueSceptic, buy him a drink if you like, that is your choice.
I will pour mine on the floor and leave…..
Well, if it’s nutbar or liar, I’ll drink with the nutbars–especially polite ones.
That does not, of course, mean that I buy used cars from them.
The issue of sincerity is a thorny one because the mind has an audience of 1. But Girma and others like him aren’t simply posing questions. They are advocating policy. They wants to continue with BAU a policy which has a very good chance of knocking civilization into the trash.
Politeness on blogs has nothing to do with the infliction of unimaginable damage to our hold here on Earth. It could simply be a pose. After all, every used car salesman is sincere. Every politician looks you in the eye and repeats lies and platitudes. Every humbug preacher has learned to coax tears from his congregation. There’s never been another case where horrifying possibilities are ignored in order to respond to every possible theory. The avowed aim of climate septics is to delay action. So how should we judge Girma’s tug of the forelock and ask us to delay policy? Me, I think he knows what he’s asking for. And it’s poison.