
NASA has just released their latest global temperature data, including the month of August 2016. It’s hot.

This was also the hottest August on record (by far) …

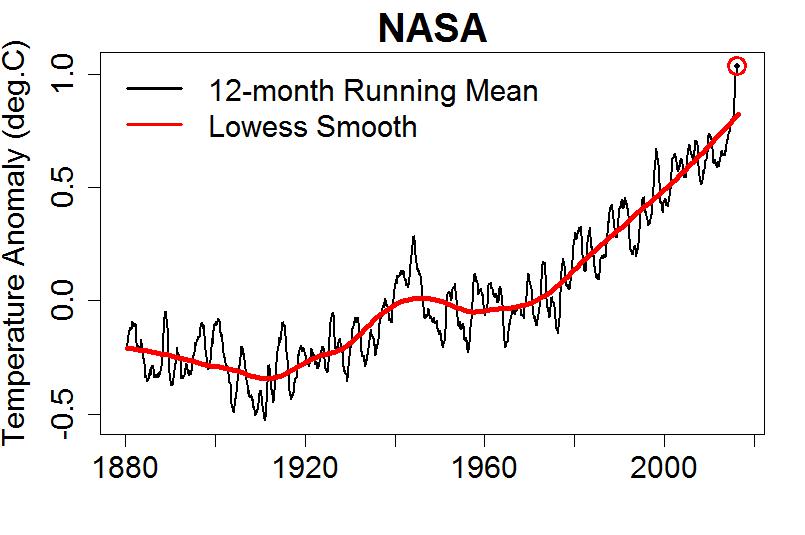
… and we’ve just had the hottest 12-month period on record:
As deniers like James Inhofe (R-OK) and Lamar Smith (R-TX) and Donald Trump (idiot) imitate a broken record by repeating, again and again and again, their claim of “slowdown” or “hiatus” or “no warming for 15 years” or whatever or “global warming is a hoax invented by the Chinese” … global temperature keeps breaking records.
This blog is made possible by readers like you; join others by donating at Peaseblossom’s Closet.


Indeed, global temperature HOT! Thanks. And since you’ve hit two of my three hot spots today, note that Typhoon Meranti is barreling towards Taiwan at 180 mph:
mashable.com/2016/09/12/super-typhoon-meranti/
And New York Times has done a goodish job here on ocean heat (one Tim Wallace) here:
Here’s the (ot) Meranti link in clickable form. It’s up to 185 mph:
http://www.mashable.com/2016/09/13/typhoon-meranti-strongest-storm-taiwan/
The tropics are a picture I like to look at, not sure how much I learn from it, but as an outward and visible manifestation of amplified energy, it’s a snapshot, and a lot of snapshots (say 10 years …) make a “film”.
http://mp1.met.psu.edu/~fxg1/SAT_NHEM/animw.html
This lovely can be moved around, if your computer has bandwidth.
https://earth.nullschool.net/#current/wind/isobaric/850hPa/orthographic=-174.78,50.05,401
NOAA has been altering SST Anomaly maps since 1998 – nearly 20 years – all the agencies are lying and altering data. We’ve caught them numerous times. We take screen shots. We’re way above 2C already.
[Response</b: Wow! You take screen shots? Forget about NASA, NOAA, The Hadley Centre/Climate Research Unit, the Japan Meteorological Agency, the Berkeley Earth Surface Temperature Project, the World Glacier Monitoring Service, the Mauna Loa atmospheric observatory, the National Interagency Fire Center, the National Snow and Ice Data Center, … you’ve got screen shots!]
They’re all part of the Great Conspiracy, i.e. “all the agencies are lying and altering data”.
Chris, for once in your life…
pause to think:
When the Magna Cum Laude…
from Stanford, Columbia, MIT, Oxford and Cambridge graduate…
who do they go to work for?
Are they hired by the public agencies?
Do they take a $50,000 a year job…
when they can get over $100,000 a year?
Is that what you think?
The Magna Cum Laude –
from the highly-selective top ten universities in the world –
are hired by the billionaires of the world –
surely you realize this, Chris.
Who else would the billionaires hire?
Do you think the billionaires of the world go to the public agencies for their climate updates?
Why would billionaires go to the public agencies for their reports when the most brilliant minds are already under contract, working for the billionaires?
Do you never pause to think about this?
You think the public agencies hire the 160 IQ’s?
The public agencies and public universities hire the 120 IQ’s…
from the University of Iowa, the University of Arkansas, the University of Alabama…
You don’t realize what this means, do you, Chris?
Pardon me, while I explain it to those who actually care –
I know you don’t care because you’re too busy pointing to the public agencies –
as if they are the authority on climate change –
you don’t realize how preposterous your stance is
and you don’t realize what that says to the rest of us who read your failed attempts at sarcasm.
Remember the developmentally challenged students in school?
Their IQ’s are about 15 points * lower * than the ” average ” students.
The developmentally challenged students have a different curriculum –
and we all know why.
You’re aware the developmentally challenged students don’t take Algebra –
and you’re aware the ” average ” students don’t take Calculus.
But when it comes to the 40-point difference in IQ between the true experts
and the experts-on-parade in the media –
the public is quite content to overlook the 40-point difference in IQ.
Do you not realize the 160 IQ’s sign a non-disclosure agreement to get their six-figure salaries?
Do you not realize the fake science gods on parade –
for public consumption –
are clueless about climate change?
You think the 120 IQ’s know more about climate change than the 160 IQ’s from highly-selective universities?
You don’t realize a 40-point difference in IQ relegates a person to the position of being an imbecile, do you?
A 40-point difference on the left-hand side of the IQ bell curve relegates a person to being an imbecile –
and a 40-point difference on the right-hand side of the IQ bell curve also relegates a person to being an imbecile.
The difference in intelligence is so extreme that – not only is an entirely different curriculum required –
but the math and language skills are so inferior as to be worthless.
Next time you see a moron…
remind yourself this is the equivalent of the intellect that you get your climate reports from.
Will anyone understand this post?
Will anyone be able to understand what this means?
Or are they all too well-programmed with lunacy?
[Response: Don’t forget to wear your tin-foil hat.
Seriously: accept the fact that we’re not interested in your conspiracy theorizing. Take it elsewhere, you’re not welcome here.]
I will assume that this crazy-man ‘whirledpublishinggmailcom’ has been banished from posting here but he does set a challenge for readers suggesting that only an exceptionally few readers here “will … understand this post, will … be able to understand what this means.”
Ignoring the Flynn Effect which at face value would suggest our grandfathers were all congenital idiots or our grandchildren all veritable genii; ignoring this, to assume that an IQ of 160 turns the holder into some form of intellectual superman is the fatuous nonsense.
There is but one reason to believe that the very brightest of students are all “hired by the billionaires of the world,” but one reason to believe that the work of such gifted youngsters is lost to public scrutiny in such a manner. Indeed, there is no evidence and only one logical reason to doubt that “billionaires of the world (do) go to the public agencies for their climate updates.” That one reason to believe in such nonsense of course would be the mental problems possessed by a crazy-man.
You don’t like it when someone tells you the truth about what you’re saying, do you?
I have to admire whirligigs effort here. Just one tiny problem. You don’t need an IQ of 140 to understand climate science. Having an extra 20 or 30 points of IQ doesn’t change the facts.
Wow! Cool! This is time-cube level crazy! I don’t know which is more telling:
1)That he’s impressed by an IQ of 160?
or
2)That he thinks a 6-figure salary is impressive?
The former implies that he has never been around smart, creative people and so thinks that intelligence can be expressed in a single number. The latter makes me think he is posting from his mother’s basement fantasizing about how much better his pot would be if he made a “6-figure salary”.
Tell us more, whirled. Did they fake the moon landings, too? How about bigfoot and Area 51?
Yep, you’re whirled alright.
Whirled Publishing: Take a look at PW Anderson. He’s my father and he and all his friends (a dozen or so Nobelists) agree that climate change is real and it’s here. So cut it out with your conspiracy nuttery.
In any case, genius must be applied, and the best ones know their limitations and don’t pronounce outside their area of knowledge; that’s a sign of intelligence, not the reverse.
(ps, sorry everyone else, I avoid this kind of stuff but this is the pits and it seemed worthwhile mentioning what real physics genius looks like (I wish I had 10% of his ability, though I have my points, but he’s humble about things outside his field))
If you want dumb, try Congressional Republicans, say Lamar Smith, Ted Cruz, Inhofe, Barton, Issa, and the whole phony Kochtopus- and fossil-supported galere.
Thanks, Susan. I have just 2 words more to contribute on this topic: “publication record.” You’ll get it. Whirled? I doubt it.
Susan, Whirled Publishing does not deny climate change, he (most likely he) is claiming we already crossed the 2°C level.
I have some evidence that we indeed had more warming than the main instrumental datasets show.
http://variable-variability.blogspot.de/2016/02/early-global-warming-transition-Stevenson-screens.html
I am trying to provide more evidence than just some “screen shots”. :-) An IQ of 160 would no doubt help a little. But most of the work is simply work and we do not have many people working on instrumental data.
VV, thanks, good point. I’m going to look at Tamino’s more recent article on that topic. But the peculiar obsession on IQ points and belief in “secret” knowledge is off the charts.
Of course, it’s complicated; the Arctic, for example, is already there. If one were talking about what’s already baked in, my personal opinion is it will be near the high end of IPCC projections. While we may have a kind of state change, I can’t help remembering how 1999 followed 1998.
I’m much more distressed at the way fringe people are now saying we must have geoengineering. I’m with Oreskes (and Pierrehumbert’s =Barking Mad ) on that one.
There are so many ways to refuse to dare to interfere with business as usual, or otherwise be apathetic or lazy (I’m not exempt) that I’m with the guys who say, for heaven’s sake, let’s not exaggerate.
Susan, I did not want to claim that Whirled Publishing is sane. :) It does open the interesting question: once you let go of reason, that is your reason to prefer one conspiracy over the other?
Especially if USA goes rogue in November, there is probably no way to stop low lying countries starting with geo-engineering by solar radiation management.
It will have unforeseen consequences for the hydrological cycle and mess up US agriculture, but low-lying countries typically have enough water and sea level rise is determined by the mean temperature, does not depend on regional changes.
Hard to tell low-lying countries not to do geo-engineering, while US president Trump speeds up geo-engineering by CO2, while sending insulting tweets to all heads of state.
So much for a La Nina holding down 2016’s temperature.
Reblogged this on Don't look now and commented:
The BBC should use Tamino’s Open Mind to balance it’s business friendly and climate limp output. See http://www.brusselsblog.co.uk/bbc-promotes-growth-and-ignores-climate-dangers/
Slightly off-topic, but still relevant to the discussion, I think.
Randall Munroe has made an excellent infographic about Earth Temperature over on xkcd: http://xkcd.com/1732/
The comic’s alt-text (mouseover) text is terrific.
(D’oh! Just seen the previous post, where you referenced it. Sorry – just delete both these comments in moderation!)
The Gistemp LOTI August anomaly at +0.98ºC was +0.13ºC above the July anomaly of +0.85ºC, the July 2016 temperature also being declared the warmest month on record in absolute terms. This is despite July 2016 being only the 19th highest anomaly because the anomaly base for global temperature has a strong annual cycle and July sits atop that annual cycle. (See here. It has a peak-to-peak cycle of 3.78ºC.)
As the drop July-to-August in the anomaly base is only 0.11ºC, we can thus declare July 2016 no longer the warmest month in absolute temperature on record as August with an anomaly 0.13ºC warmer, was thus warmer in absolute terms and can now claims the title.
Thus the record for hottest absolute month on record was broken two months in a row.
I’m not normally a fan of mixing the global seasonal variation by month with the long-term warming trend, but the multicolored plot that Gavin Schmidt is now using communicates both features very well.
http://data.giss.nasa.gov/gistemp/news/20160912/
I tried looking for a discussion on the 1940’s through to 1970’s pause. Can anyone help with a link? I vaguely remember reading a long time ago that it had something to do with the sun blocking effect of pollution temporarily counter-acting the warming trend. Is that right?
Incidentally, that is one of Malcolm Roberts “inconvenient truths”, mentioned in his first speech before the Australian senate: “from the 1930s to the 1970s, during the period of the greatest industrialisation in human history, when our carbon dioxide output increased dramatically, atmospheric temperatures cooled for 40 years straight”, see:
http://parlinfo.aph.gov.au/parlInfo/search/display/display.w3p;query=Id%3A%22chamber%2Fhansards%2F7bf9040b-3855-4d2d-840b-2e051635f1c8%2F0133%22
Which looks like this, in the GISTEMP record:
http://www.woodfortrees.org/plot/gistemp/from:1930/to:1980/mean:13/plot/gistemp/from:1930/to:1980/trend
Not sure the roughly 0.1 C warming is statistically significant, but it sure as hell ain’t cooling.
Doc: For what its worth: Roberts refers to the 1930s to the 1970s and also refers to a 40 year period, so he could legitimately have been referring to 1935 to 1975, which does have (very very marginally) a negative trend on WfT:
http://www.woodfortrees.org/plot/gistemp/from:1935/to:1975/mean:13/plot/gistemp/from:1935/to:1975/trend
Well, if he’s that adroit a cherry-picker, he ought to be able to remember the key dates! ;-)
Pretty much. The truly enormous post-WW2 industrial boom in the US, Europe, Japan, and other parts of the developed and developing world pumped out steadily growing amounts of sulfur dioxide, black carbon soot, ash and dust from every chimney and tail pipe 24/7/365, year after year without any kind of pollution controls. It was like Mt Pinatubo popping off every other year or so for 35 years, totally suppressing the warming of the also steadily rising CO2 from those same chimneys and tail pipes.
And then the Clean Air Act in the US and similar legislation in Western Europe was passed and went into effect and rapidly reduced those sunlight reflecting and blocking emissions, unmasking the growing warming produced by steadily rising CO2 that was there all along.
Yes, although I think that it hasn’t been clearly demonstrated quantitatively that that’s the explanation (or sole explanation?) There are other contenders, last I heard, and IIRC.
Chris O’Neill: There were other periods of statistically significant cooling, for example 1880 to 1912 or thereabouts in GISTemp.”
Not sure if that is statistically significant, if you have to select the period that precisely (multiple-testing), but at least the instrumental land datasets do not show much warming for this period and the sea surface temperature has a hint of cooling.
It is also the period Stevenson screens were introduced, which typically record lower temperatures as the older screens used before. Thus it may have warmed more over land in this period than we currently think:
http://variable-variability.blogspot.com/2016/02/early-global-warming-transition-Stevenson-screens.html
A recent temperature reconstruction published in Nature also suggests that the warming started earlier, already in the 1830s:
https://theconversation.com/the-industrial-revolution-kick-started-global-warming-much-earlier-than-we-realised-64301
“Yes, although I think that it hasn’t been clearly demonstrated quantitatively that that’s the explanation (or sole explanation?)”
Perhaps not the sole explanation, Doc, but its plausibility is supported by the observed effects of Pinatubo itself, not to mention the “Asian brown cloud”. What ever other factors may have been in play, increased aerosol blocking during the post-war boom was very much part of it.
That is the standard explanation for the hiatus, the “real” one, which is in the main temperature datasets from 1940-1970. I am personally not that sure it is real. The data in WWII is very uncertain and may well still be too warm also after adjustment. If you think away 1940-1946. this hiatus becomes a lot smaller, possibly no longer statistically significant. Something I have wanted to compute for a long time.
[Response: The mid-century hiatus (the real one) is statistically significant.]
There were other periods of statistically significant cooling, for example 1880 to 1912 or thereabouts in GISTemp.
So there were naturally occurring periods of statistically significant cooling in the past and no doubt naturally occurring periods of statistically significant warming too.
The thing that’s different now is that the only statistically significant change is warming. Periods of statistically significant cooling came to an end in the 1950s.
Tamino: “Response: The mid-century hiatus (the real one) is statistically significant.”
In the current temperature datasets it is. However, if you set 1940-1946 to missing, I am not sure it still would be.
(That would just be a first step to show that a potential problem would have consequences. The final solution would naturally be to better understand the biases, correct them and compute the likely larger error bars for this period.)
But I don’t have to select it precisely. You can vary the start and finish by several years and still get statistically significant cooling.
The point is that there is no reason why nature or even human-caused processes other than CO2 emissions on their own cannot produce statistically significant cooling or warming. The temperature record provides reasonable evidence that they have actually happened.
I have no problem with the possibility of hiatuses, I am just not that convinced about this one yet.
I wasn’t talking about hiatuses, which is usually what happened until the 1970s btw. I was talking about (statistically significant) cooling and warming periods.
I also have no problem with (statistically significant) warming periods. (Isn’t a hiatus a (statistically significant) cooling period?) Especially if your null-hypothesis is white noise and not long-range dependent noise.
[Response: I think the term “hiatus” refers to the absence of warming, not necessarily cooling.]
Not only is a (warming) hiatus not (just) a statistically significant cooling period but in the sense that global warming denialists used it, it referred to a period longer than usual when the null hypothesis (noise) was not rejected. e.g. Global warming denialists liked to describe (beginning of) 1998 to (beginning of) 2015 as a hiatus.
re: “naturally occurring” cooling and warming. It bears remembering (Greg Laden makes some imho good suggestions about improving the xkcd summary) that human activity has altered the climate (not being a statistician, I’ll just say “measurably”) before the recent history that is in the forefront of our memory boxes.
http://scienceblogs.com/gregladen/2016/09/13/everybody-always-gets-this-wrong-even-smart-people/
Yes, that was a sloppy formulation of me. I was thinking of a statistically significant break in the trend that changes the long-term (secular) trend, that break can either go down (relative cooling) or up (relative warming). (Somehow one should also still take into account that a non-linear secular trend should not be seen as an hiatus by such a trend break test.)
I am open to the existence of such trend breaks if your null-hypothesis is trend plus white noise. If only because the climate is correlated on all time scales (has long-range correlations) and a test on white noise will thus often be too greedy.
However, due to known problems with the data around 1900 and in WWII, I would not claim a hiatus just based on statistical evidence alone. It should also be significant in size relative to the size of possible inhomogeneities in the data.
The same goes for the recent period the mitigation sceptics called a hiatus. Even if that would have been statistically significant, I would never have dared to act like our data is sufficiently accurate to detect such a minimal change. We are just in the middle of a transition to Automatic Weather Stations on land and on the sea we are nowadays more and more missing ship identifications due to piracy worries and are partially for the same reason in a transition to much more buoys.
(Let’s not go the bizarre way of the mitigation sceptics and call any statistically non-significant trend a hiatus. That would make almost any short term trend a hiatus. No wonder they are so angry, that kind of thinking makes your head hurt.)
Tamino, in January you modeled the effect of el Niño to global temperatures and the model included “a nonlinear el Niño effect which lags 10 months”:
Can you tell a bit more about that effect? Could we be seeing it right now as it is about 10 months from the peak el Niño?
To my knowledge, El Nino only contributed 1/5 to the recent temperature records after all.
I don’t even know what that means. The most obvious interpretation, that you measure the temperature in kelvins and take four fifths of it to get the temperature without El Nino, is clearly nonsense.
I’m sure Nemesis is referring to coverage such as this:
http://blogs.ei.columbia.edu/2016/02/02/el-nino-and-global-warming-whats-the-connection/
As you see, the interpretation isn’t any clearer there. But I’m not sure why you think that a fractional attribution of the temperature anomaly doesn’t make sense.
Without a time scale, the factional attribution really doesn’t make sense. Over one year the record was almost entirely caused by El Niño. Over 100 years it was almost entirely caused by global warming.
@Greg Simpson
” I don’t even know what that means. The most obvious interpretation, that you measure the temperature in kelvins and take four fifths of it to get the temperature without El Nino, is clearly nonsense.”
Please see here for further investigation into what I am talking about:
http://www.skepticalscience.com/how-much-el-nino-boost-2015-temp.html