We’ve already seen how ice-out on the Tanana River in Alaska has been trending earlier in the year. We’ve also seen a lame attempt at WUWT to suggest that it’s because of anything but warming temperatures. Ooh ooh — is it the Pacific Decadal Oscillation? Uh, is it urban heat island effect from the giant city of Fairbanks, Alaska 40 miles away? No it isn’t. What could it be? Hmmm, could it be … Satan?
Since the subject came up, let’s look at some more ice-out data — from a part of the U.S. quite far from Alaska. The U.S. Geological Survey in Maine has ice-out dates for New England lakes. 29 lakes, in fact, with data from as early as 1807 up to 2005. Let’s take a look.
The overall trend in ice-out day is quite similar for all these lakes. Compare, for instance, the record for Cobbosseecontee Lake:
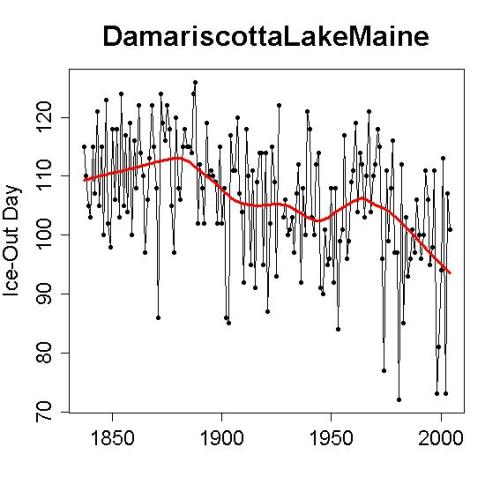
to that for Damariscotta Lake:
Not just the overall trend, but the year-to-year fluctuations are quite similar. That’s because the changes in ice-out day are primarily due to warming temperature.
Of course these data only go up to 2005. But I doubt there’s been a sudden reversal of the trend, especially since the Portland Press-Herald reported on March 23, 2010, that “A Maine lake has been declared ice-free earlier in the season than any other year in 136 years of record-keeping,” referring to Maine’s Lake Auburn. If the paper reported ice-out on March 23rd, it must have happened by March 22nd, which is day 81 — considerably earlier even than what would be expected from the receding trend which was already obvious by 2005:
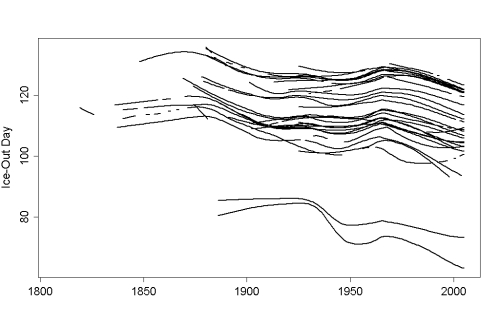
We can even compare the smoothed curves for all 29 lakes on one graph:
Most of the lakes have an average ice-out day later than day 90, but two of them tend to thaw earlier. They’re from the more southern part of New England, Houghton’s Pond and Ponkapoag Pond in Massachusetts. We can also take a closer look at the 27 other lakes:
What conclusion is blatantly obvious from this? Hmmm…
Of course, we can fit a linear trend line to the data for each lake. This is an imperfect way to characterize the trend, because clearly the trends are not linear, but at least it will give an overview of the general “consensus” of New England lake data. Out of 29 lakes, 27 show a negative linear trend in ice-out day while only 2 show a positive linear trend. But the 2 positive trend rates fail statistical significance (not even close) — it’s more descriptive to say that out of 29 lakes, 17 show a statistically significant negative trend (earlier ice-out) and 12 show no significant trend.
And why, you wonder, is the ice breaking up earlier on New England lakes? Hmmm …


Your output on this blog blows me away. Really makes we want to learn statistical analysis too, it’s just so useful. Any tips?
Get an intro stats book and read through it–and work all the problems!
Sleegammage,
Following up on Barton’s suggestion Schaum’s Outline on Statistics and their Outline on Probability are two very useful, practical books with many examples and many problems to work (with answers usually). They are designed for a quick pickup of the subject. They are pretty cheap too.
The statistics outline contains enough on regression and correlation to get you started on time series.
Don’t forget to check the archive of this site at Skeptical Science. There are many posts there that do a great job of covering statistical fundamentals in their discussion of climate data analysis.
Good luck to Anthony … in advance.
”What conclusion is blatantly obvious from this?”
That if we see a post at wuwt about New England lakes melting, it will be about the 2 cherrie flavored lakes that bucked the trend?
I was thinking the EXACT same thing.
Why?
Probably Satan, all right, heating up the boiling pitch for all us terrible ‘warmists.’ (Hmm, that thought gives the term ‘warmist’ a whole new meaning, doesn’t it?)
Remarkable that they all have such similar shapes. And that the shape seems to mimic (upside down) the rough shape of temperature change – a warm period about 1940s, then trending to cold in 1970, then steadily warming since…
Have you been able to compare the shape of these curves to that of the temperature record? And is it really comparable?
Ah, yes. Global Warming, the Church Lady and…Satan.
Correlation… or Causation? You decide.
Lake Auburn is within the city limits of the Lewiston-Auburn metroplex. The population of Lewiston is 35,026, a growth of -1.8% since 2000. Auburn has an additional population of 23,170. The area is the home of such massive industrial complexes as:
– Bates College
– Central Maine Medical Center
– Country Kitchen Bakery
– Walmart Distribution Center
– Sun Journal newspaper (circulation 33,900)
– LL Bean boot and tote bag factory
Within less than a mile of the shores of Lake Auburn is Auburn mall, anchored by both JC Penney and TD Bank, not to mention the adjacent Best Buy, Walmart Supercenter plus Ruby Tuesday’s, Starbuck’s and at least 2 pizza restaurants.
…all of which are anthropogenic.
The Wal Mart Distribution Center is the culprit.
Chinese ships are dragging warm water from the PDO down the Saint Lawrence Seaway.
Doh. It has to be the bakery. That’s UHI *incarnate*, I tell you.
The charts from New England also remind me of those from Lake Kallavesi in Finland . Oh wait was that Lake Mendota, Wi I was thinking of or Lake Menona, WI. Or maybe it was in Minnesota
I forgot to say great job. There is of course a different kind of ice out from lakes. That is when glacier retreat exposes a new lake that had been filled by ice. Such as for Freshfield Glacier, Alberta or Theri Kang, Bhutan or maybe Bear Glacier, Alaska
The New England data have been updated at least through 2008:
Historical Ice-Out Dates for 29 Lakes in New England, 1807–2008
Click to access ofr2010-1214.pdf
Lake Auburn hit day 90 in 2006; must’ve been a big year at Starbuck’s and the pizza joints.
Lake Auburn was ice-out 3-22-10, which was day 81:
http://www.maine.gov/doc/parks/programs/boating/ice_out10.html
The 2011 dates are being reported in real time:
http://www.maine.gov/doc/parks/programs/boating/ice_out11.html
Lake Winnipesaukee also set a record in 2010; March 24 beat the 1921 record by 4 days. This year was Tuesday, April 19, 2011 at 8:20 am, so we’re obviously headed for a new ice age.
http://www.winnipesaukee.com/index.php?pageid=iceout
For a closer look at New Hampshire’s big lakes, Winnepesaukee and Sunapee, see Figure 5 in the report, “Is New Hampshire’s Climate Warming?” Not much urban heat there, and yes they mirror the general temperature trend.
Click to access IB_Hamilton_Climate_Survey_NH.pdf
Hi Tamino,
rather than testing the trends at each lake independently, have you fitted a mixed model (“random intercept, random slopes”) to these data? – that would use all of the data (even lakes with short series) to estimate the overall mean trend (and its significance).
A mixed-effects model would be instant enough if the data are all in one file somewhere. (Are they?) And we could toss in AR(1) errors. That approach wouldn’t capture the nonlinearity of Tamino’s graphs or the report I linked above, though.
Nice post, Tamino. I believe this is kind of a return to your roots — didn’t you do a post about lake ice ‘way back when?
For those who are interested, there have been some good papers that looked at lake ice systematically over large areas:
Magnuson et al. 2000. Historical trends in lake and river ice cover in the Northern Hemisphere. (Science).
Wynne et al. 1998. Satellite monitoring of lake ice breakup on the Laurentian Shield (1980-1994). (Photogrammetric Engineering and Remote Sensing).
Hodgkins et al. 2002. Historical changes in lake ice‐out dates as indicators of climate change in New England, 1850–2000. (International Journal of Climatology).
Jensen et al. 2007. Spatial Analysis of Ice Phenology Trends across the Laurentian Great Lakes Region during a Recent Warming Period. (Limnology and Oceanography).
What conclusion is blatantly obvious from this? Hmmm…
…that the heat island effect from the city of Fairbanks, AK has a MUCH larger footprint than I originally gave it credit for.
[Mode joke on] All those plots show that all the measurements are wrong, except the two-three curves going UP (instead of the ones going down) during the last part of the record [Mode joke off]
The kind of reasoning above is quite usual in the denier camp, isn’t it? ;-)
The anomalies for Houghton’s Pond and Ponkapoag Pond are because they are in southeastern Massachusetts, not in Maine. Houghton is in the Blue Hill Reservation in Milton and Ponkapoag is in Canton, just a few miles south of Houghton’s. Houghton’s Pond is a glacial kettle hole with no inlets, which tends to extend the time the ice stays in place because there are no incoming streams to break up the thinning ice. Houghton’s and Ponkapoag are 180 miles south of Cobbosseecontee and much closer to the ocean. They are in an entirely different climate zone. My mother’s plants in North Easton, Mass. (near Ponkapoag) are always 2-3 weeks ahead of mine in Augusta, Maine, just a few miles from Cobbosseecontee.
mmm. Several consecutive posts on here advertising WUWT stuff !
Why not post some original climate science on here and stop ignore the other nonsense? It would make us more credible
[Response: Hmmm… several posts in a row embarrassing WUWT stuff. Nothing wrong with that, fools and charlatans should be exposed for what they are.
And other than the “set-up” (the introductory paragraph), this post is *not* about WUWT stuff, it’s about ice-out dates of New England Lakes.]