
I got a request for a revised form of some graphics. I do not intend to turn into everybody’s graphics monkey, so if you make a request don’t expect it to be fulfilled. But, this one seemed important enough to be worth doing. The data are from Cowtan & Way, their revision to the HadCRUT4 global average surface temperature. Feel free to use them.


What pause?
How do these graphs compare to the ‘unrevised’ data that was being used prior to Cowtan and Way? Can anyone help me set up a direct comparison? Thanks in advance.
Cowtan and Way(2013) can help you: http://www-users.york.ac.uk/~kdc3/papers/coverage2013/background.html
Or you can do it yourself with:
http://www.metoffice.gov.uk/hadobs/hadcrut4/data/current/download.html
versus
http://www-users.york.ac.uk/~kdc3/papers/coverage2013/series.html
Andy, I do believe Tamino in an earlier post shows a lot of different datasets showing the clear trend of warming and no “pause” or “hiatus” to see:
Thanks for making these Tamino, I use these frequently now in discussions whenever the “pause” myth comes up. It’s a shame that some scientists even insisted on explaining “it” when it really isn’t there. Ofc what they are really trying to explain is why substantial natural variation of cooling managed to get temps below the record El Ninõ of 1998, which really shouldn’t be a surprise in the first place.
I think it’s partially just sloppy terminology used by some scientists in their papers. The “hiatus/pause” meme has found its way into the scientific discussion as placeholder for explaining short term variability, which is a totally legit area of research, and the analyses in the papers may be just fine. Unfortunately, the “hiatus/pause” meme is reproduced in this way. AGW-deniers/fake skeptics refer to the use of this terminology by real scientists and present it as confirmation for their own propaganda about the alleged “global warming pause/stop”, although the real scientists actually don’t mean it in this way and wouldn’t agree with such an interpretation. This is made particularly easy, since no one has properly defined, based on rigorous scientific criteria, what actually constitutes a “hiatus” or a “pause”. The term is used as starting point as if the “hiatus” was just a fait-accompli. This is aggravated when the real scientists use the term “hiatus” even for a merely lower, but still positive trend slope of the surface/tropospheric temperature compared to the average trend.
I wonder whether the “hiatus/pause” is also partially used to catch attention in the media. Since the meme is going around, publishing another paper using the buzzword “hiatus” in the title or narrative may attract more readers and media attention than something boring like “On explaining the small and statistically non-significant negative deviation of the short-term surface temperature trend from the average trend” and not mentioning “hiatus” at all.
Nicely said Jan.
Pausists remind me of folk who claim “oh yes, I knew that you were a Sagittarian!” or “gee, that Mercurius vivus” worked a treat!”, or “no, there really is an image of Jesus on the surface of Mars!”
They just see what they want to see. It’s as simple as that.
Until it screws the planet for the future of humanity and the rest of the biosphere…
Personally, I’d like to see a statement before any answer about why the starting year was chosen. A simple elevator speech about why “some” would choose that year, why statistically that is misleading, and what the climatological trend is.
When you use such an elevator phrase right off, you place all this into context and don’t buy in to dishonest phrasing or media chasing a story.
.02
Best,
D
Rather than be everyone’s graph monkey on this, how about just link to the R code (I am assuming it is R) that you use and people that want variants, can make their own.
Here are some toys that are likely to be munged by the markup:
u=”http://www-users.york.ac.uk/~kdc3/papers/coverage2013/had4_krig_annual_v2_0_0.txt”
cw=read.table(url(u),col.names=c(‘date’,’temp’,’tu_1s’,’cu_1s’,’eu_1s’))
pind=cw$date>=1975
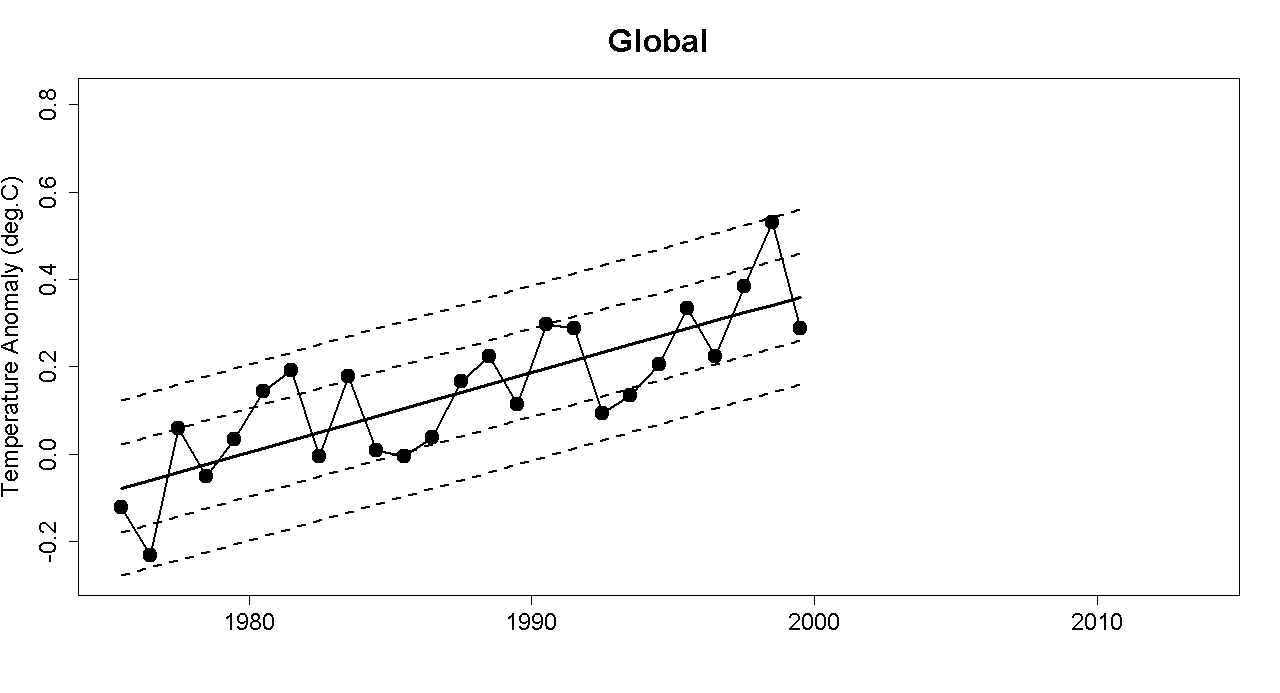
plot(temp ~ date,cw,type=’o’,pch=16,subset=pind & date <=2000,xlim=range(date[pind]),ylim=range(temp[pind]))
abline(fit<-lm(temp ~ date,cw,subset=date=2000)
se=sd(resid(fit))
for (m in -2:2) abline(coef(fit)+c(m*se,0),lty=2)
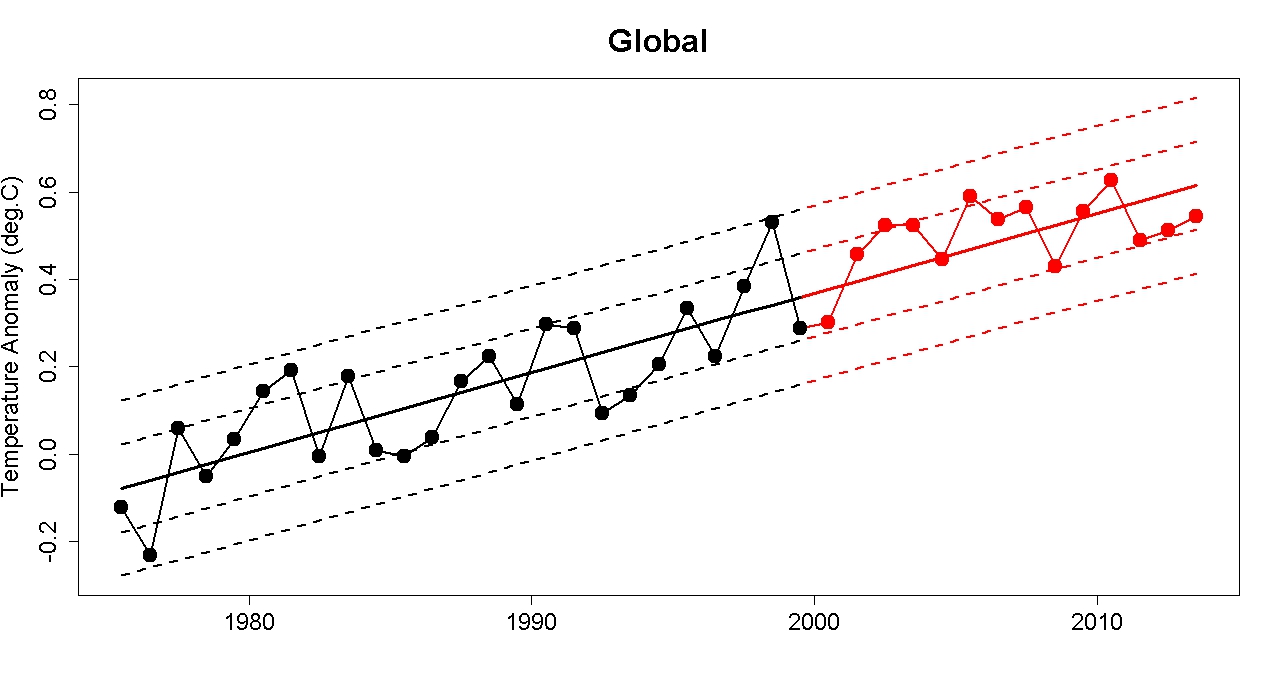
Variants in the datasets, subsetting and coloring are all the awkward fiddly bits.
Just the quotes got munged, sometimes they are ‘’ instead of ”. I had a little play with some linear regressions. There is no pause in this dataset :-)
The HADCrut4 global data is at:
http://www.metoffice.gov.uk/hadobs/hadcrut4/data/current/time_series/HadCRUT.4.2.0.0.annual_ns_avg.txt
The file format is described at:
http://www.metoffice.gov.uk/hadobs/hadcrut4/data/current/series_format.html
(Basically you want cols 1&2)
Additional, more specific data are available at:
http://www.metoffice.gov.uk/hadobs/hadcrut4/data/current/download.html
Thanks for this, Tamino. A very clear message.
Cue animated .gif version from the guys at Skeptical Science in 3… 2… 1…
Thanks a bunch for the replies folks. Busy old fella for a while, I’ll be. (crap! chanelling Yoda) :)
I was running data through tamino’s allfit software,adjusting for el nino and stuff, and thought you might want to know the results.
if you like i could post the 1979 to 2013 monthly.
thanks jacob l
obs,giss,noaa,cru,rss,uah,cowtan,time
1998,0.07,0.13,0.17,0.17,0.12,0.10,1
1999,0.00,0.08,0.08,0.08,0.01,0.02,2
2000,-0.01,0.02,0.02,0.05,-0.01,0.00,3
2001,0.10,0.11,0.12,0.14,0.09,0.13,4
2002,0.15,0.12,0.11,0.15,0.14,0.15,5
2003,0.13,0.13,0.15,0.12,0.06,0.15,6
2004,0.09,0.13,0.16,0.06,0.05,0.10,7
2005,0.23,0.21,0.20,0.17,0.17,0.24,8
2006,0.21,0.19,0.19,0.17,0.20,0.24,9
2007,0.21,0.19,0.17,0.12,0.11,0.26,10
2008,0.17,0.18,0.17,0.09,0.09,0.20,11
2009,0.25,0.20,0.21,0.19,0.24,0.27,12
2010,0.25,0.26,0.23,0.30,0.32,0.31,13
2011,0.28,0.24,0.26,0.22,0.30,0.27,14
2012,0.22,0.19,0.21,0.12,0.18,0.20,15
2013,0.24,0.24,0.26,0.11,0.17,0.23,16
Thanks
This is great
Interesting paper just out in Nature Climate Change:
http://www.nature.com/nclimate/journal/v4/n3/full/nclimate2145.html?WT.ec_id=NCLIMATE-201403#access
As reported here, with a bit on the methodology, which you can’t see from the Nature CC stub that’s outside the paywall:
http://www.cbc.ca/news/technology/extreme-heat-days-multiply-despite-global-warming-hiatus-1.2551270
“Pausia ad Nausea”
— by Horatio Algeranon
Pausia ad nausea
Grips the blogs
Noisia and noisia
Hiatiun dogs
Horatio… I know this has been said before, but you’re absolutely brilliant.
The depth and breadth this piece attains is amazing.
In a documentary about Muhammad Ali someone recounted how he claimed to have written the shorted poem ever.
Me, we.
When I heard that I was just blown away. Given who he was, what he accomplished, when he did it, and the entire social conflict/context of his life… it encapsulates an entire generation and makes us all part of it in such a profound and positive way.
With regard to this time now, and the challenges we face today, in your own way you’re very close to approaching the same level of genius.
I can’t stop reading this latest piece of yours. It’s true greatness, stated with full reference to the phrase, “I am the greatest!”
Thank you.
Those who claim there is no “pause” are missing something–there is more to climate science than anthropogenic warming. The question of what happens when we see a large fluctuation is INTERESTING! It gets at the sources of the noise in the anthropogenic signal, which in turn is driven by the dynamics of the climate system. It is not sloppy for climate scientists to talk about a pause. It is their job. If the lying liars want to take these comments out of context, then tant pis. If the public are so dim that they choose to believe the lying liars, then f*** them.
True. The presumption, of course, with the denialati is that the whole thing is ‘political’ from the get-go. Don’t want to adopt that mode of thought…
But the public is ‘ineffable’, since ‘eff’ them and it’s ‘eff you & I’ as well–particularly in the case of climate change!
“Those who claim there is no “pause” are missing something”
Is it some sort of brain haemmorage that stops logical cogitation? Do I win a prize for guessing correctly!
“there is more to climate science than anthropogenic warming.”
That’s rather like saying there’s more to engineering than cool cars.
“If the public are so dim that they choose to believe the lying liars, then f*** them.”
The public are, in just about every single measureable way, less in denial than the governments in charge of them. 2/3rds of the USA public want the government to do more in combating climate change than the government is currently doing.
Just because deniers own all the stations and all the papers and most of the noisiest blogrolls doesn’t mean the public believe them.
Wow, Care to try that again, but maybe in coherent sentences that have something to do with what I posted?
Thanks for this very educational graphics!
Apparently there has been some Godwin’s Law in action calling us “Climate Nazis”, so as a reply I would liken the “since 19978” crowd to this:
[edit]
[Response: Let’s just not get into that.]
However, I do have a reality check for the ‘enviro-nazi’ name-callers:
http://hubpages.com/hub/Green-Fascism-Let-The-Facts-Speak
[Response: Let’s not turn this post into that discussion.]
Probably a wise call; ultimately, it’s just ‘another squirrel’–or maybe white rabbit.
Still, I appreciate your letting the link stand. (And appreciate the couple of dozen folks who took the time to check it out–I hope it will be useful to someone.)